

Introduction
The global population is increasing at an alarming rate, with a projection of 9.8 billion by 2050 [1]. These future populations will trigger an 85% rise in food demand [2]. To meet this demand, an agricultural land gap of 593 million hectares (double that of the country of India) will be needed to yield sufficient crops and grasses [1]. The reclamation of saline-alkali lands is an effective and necessary [3] way to supplement cultivated land [4] for food production [5], especially for China, which is facing a sharply increasing shortage of arable land resources [6].
Saline-alkali lands are broadly distributed on the planet [7-10], comprising approximately 8.31×10⁹ hectares [7], contributing ca. 25% of the total land and 76% of the arable land [8], occurring in more than 100 countries [5, 11]. Kazakhstan possesses 111.55 million hectares [1], China 100 million [12-14], America 64 million, Russia 54 million [1], Uzbekistan 20.8 million [1], Turkmenistan 14.1 million, India 6.75 million [1], and Pakistan 6.67 million hectares [15]. This threatens over 1.5 billion people in food production [5]. Even worse, saline-alkali soil is expanding at a rate of 1.0-1.5 million hectares [5, 16] or a rate of 10% annually [11], especially under the adversities of rising temperature and evaporation [17]. Therefore, saline-alkali soils are a widespread global issue [1, 18]. However, the challenges of managing these saline-alkali soils still need to be addressed.
The saline-alkali soil is characterized by inferior physical properties [19-22], such as high pH [5, 18, 20, 23, 24], high electrical conductivity [25], and poor chemical properties [23], such as high salt [1, 11, 18, 20, 26], deficient nutrients [11, 19, 24, 26-28] (poor nitrogen [27], phosphorus [20], and potassium [25]), and less organic carbon (matter) [14]. These problems pose major challenges [24, 27, 29], not only negatively impacting soil quality [11, 21], soil health [18], crop growth [24, 28], and global agricultural productivity [11, 19, 21, 22, 27-29] and quality [23], but also adversely affecting food security [22, 24], the economy [18], and sustainable development of agriculture [30]. Therefore, it is pressing to develop a sustainable approach to revitalizing and managing saline-alkali soil [4].
To address these issues, modifying saline-alkali soil is a crucial [12] and global hot topic [31] with the physical (salt-washing [32], tillage [33], subsoiling [33]), chemical (organic acids [10], humic acid [34], hydrolyzed polymaleic anhydride [35], titanium gypsum [36], gypsum [5, 7, 37-39]), biological [23] (halophytoremediation [40, 41] and microbial inoculants [42, 43]), and combined treatments [44] widely used in saline-alkali soil amendments across the world. These measures require abundant manpower, appropriate climate, long time, high expenditure, and strict technical specifications [23] but cause low efficiencies [40] or secondary pollution [11]. These measures are thus very difficult to carry out [7]. Therefore, a novel amendment strategy is imperatively required for remediating saline-alkali soil. Furthermore, adding organic amendments has been extensively used as the most efficient [45] and key practice [6, 46] for revitalizing [47] soil physiochemical properties [46], enhancing soil carbon [46], and improving soil health [22, 48] due to its low cost, wide availability [45], and sustainable alternative to inorganic materials [49]. Organic amendments have positive effects on saline-alkali soil [46] through physical, chemical, and biological pathways, such as (1) converting organic materials into soil organic matter, (2) providing available and total nutrients directly and indirectly, and (3) changing soil structure and buffering capacity. However, the mechanisms by which organic amendments generate these effects remain poorly understood.
Moss is among the oldest nonvascular vegetation [50] and is the most widely distributed plant across the planet [51]. It is also widely planted in China. However, compared to other organic amendments, no study uses moss powder as a novel amendment in saline-alkali soils. Moreover, there are still knowledge gaps about the best addition rate and the reaction mechanism of the moss powder amendment-saline-alkali soils.
Soil stored ca. twice the atmosphere’s and biosphere’s total carbon [1], representing the largest terrestrial carbon stock [29, 52, 53]. Besides climate change mitigation [17], soil organic carbon not only provided nutrients [20, 54] and facilitated soil fertility [55] but also buffered salt stress [46]. Even minor changes in soil organic and inorganic carbon will significantly change the global carbon budget, air CO2 content [52-54], and succeeding global warming [20, 29], as well as soil quality [20], productivity, and food security [56]. Enhancing organic carbon is thus a crucial goal for improving saline-alkali soil; however, due to the deleterious impacts of soil salt and alkali, increasing soil organic carbon in saline-alkali lands has always been challenging [9]. Although the dynamics and driving mechanisms of soil carbon storage are a focus and hotspot of research [29], it is the most attractive [57] to increase soil carbon stocks [52] and understand their controls [58]. Notwithstanding, compared to soil organic carbon, our knowledge of soil inorganic carbon drivers is relatively poor [59]. Furthermore, although many organic amendments have been shown to increase soil organic and inorganic carbon [8, 9, 23, 60, 61], there is no knowledge about whether and how the moss powder amendment modifies the organic and inorganic carbon concentration and density of saline-alkaline soil. This gap may deprive us of the potential pathway for applying moss powder amendment to increase carbon in saline-alkali soils.
To fill this gap, we hypothesize that moss powder amendment can improve the organic and inorganic carbon content and density of saline-alkaline soil (H1), and there should be an optimal rate for enhancing the organic and inorganic carbon content and density of saline-alkaline soils (H2).
Specifically, using conventional statistics and artificial intelligence, we sought to (1) clarify the effects of moss powder amendment on the organic and inorganic carbon, physiochemical properties, and stoichiometric ratios of saline-alkali soil; (2) identify the critical thresholds and propose a best-use strategy in saline-alkali soil considering its effects on soil organic and inorganic carbon and the shortcomings of saline-alkali soil; and (3) explore the drivers that are crucial for soil organic and inorganic carbon and elucidate the response mechanisms of soil organic and inorganic carbon to moss powder amendment.
Our study would present valuable insight into the effective use of moss powder amendment in saline-alkali soils and an understanding of moss powder amendment-induced changes in organic and inorganic carbon based on conventional statistics and artificial intelligence.
Materials and Methods
Design and Sampling
Six treatments were arranged with different addition rates of moss powder amendment (0%, 2.5%, 5%, 10%, 15%, and 20% of dry soil mass; equivalent to 0, 12, 24, 48, 72, and 96 t/hectare in fields with a soil depth of 5 cm and a bulk density of 1.04 g/cm3). Three bottles (three replicates) were arranged for each treatment. First, 400 g [23] of dry soils and 0, 10, 20, 40, 60, and 80 g moss powder amendments were mixed in bottles, respectively. These bottles were cultivated at room temperature (avoiding direct sunlight). Since there was no study of the use of moss powder amendment in saline-alkali soils, the setting of these rates was based on (1) the empirical suggestions from moss experts in Guizhou Province, who believe that if moss powder amendment is added by more than 20%, the soil mixed with more than 20% moss powder amendment may not visually look like soil anymore but more like moss powder amendment, and (2) many studies about soil amendments have used rates of 2.5% [61-63], 5% [4, 23, 34, 61, 64], and 10% [61, 64]. The alkaline soil originated from the 31st Company of Xinhu Farm in Changji Autonomous Prefecture, Xinjiang province. Xinjiang is among the most important agricultural production areas in China, but more than one-third of the cultivated land in Xinjiang has suffered from soil saline-alkali [21], making Xinjiang the largest saline-alkali land area in China [65]. Moreover, the area of saline-alkali lands is constantly expanding [16, 65].
The dry moss was provided by Zilin Moss Planting Company in Dushan County, Guizhou Province, China. The moss powder amendment was obtained using a grinder. To simulate the scenario of drip irrigation planting rice with plastic film cover, the soil moisture content was adjusted to 50% for all bottles. After one month of culture, the bottles were moved to the rooftop greenhouse for natural evaporation for about 35 days. When no water was on the soil surface, soil samples were collected to test the following soil physicochemical properties. First, we gently used a ring knife to obtain soil cores for measuring indicators such as soil bulk density, water content, and porosity. Then, the remaining soil was mixed and used to determine its other physicochemical properties.
Determination of Soil Carbon Concentration and Physicochemical Properties
This part was performed by Yangling Xinhua Ecological Technology Co., Ltd. (CN). Briefly, soil organic carbon concentration (OCC, g/Kg) was tested using an elemental analyzer, soil inorganic carbon concentration (ICC, g/Kg) was tested using the volumetric titration method, and soil total carbon concentration (TCC, g/Kg) = OCC+ICC. pH was tested using a pH meter [66]. Soil bulk density (BD, g/cm3), total porosity (TP, %), capillary porosity (CP, %), non-capillary porosity (NCP, %), and water content (WC, %) were tested using an oven at 105°C and an electronic balance (Shanghai Baiyinghengqi Corporation, China). The ratio of soil porosity to solid soil was calculated as total porosity/(100-total porosity). Soil electrical conductivity (EC, μs/cm) was tested using a conductivity meter (DDSJ-308F, Shanghai Yidian Science Instrument Co., Ltd. – Thunder Magnetic). Soil total salt content (TS, %) was tested using the residue drying-weighing method. Soil water-soluble calcium concentration (WSCaC, mg/Kg) and water-soluble magnesium concentration (WSMgC, mg/Kg) were measured using the EDTA titration method. Soil water-soluble potassium concentration (WSKC, mg/Kg) was determined by the flare photometer method [67]. Soil water-soluble sodium concentration (WSNaC, mg/Kg) was tested using the flare photometer method. The alkali diffusion approach analyzed soil alkali-hydrolyzed nitrogen concentration (ANC, mg/Kg) [68]. Soil available phosphorus concentration (APC, mg/Kg) was tested using the sodium bicarbonate extraction-molybdenum antimony anti-colorimetric method.
Calculation of Soil Elemental Density and Soil Stoichiometric Ratio
Soil water-soluble calcium density (WSCaD, g/m3) was calculated using the soil water-soluble calcium concentration multiplied by the soil bulk density. Soil water-soluble magnesium density (WSMgD, g/m3) was calculated using the soil water-soluble magnesium concentration multiplied by the soil bulk density. Soil water-soluble potassium density (WSKD, g/m3) was calculated using the soil water-soluble potassium concentration multiplied by the soil bulk density. Soil water-soluble sodium density (WSNaD, g/m3) was calculated using the soil water-soluble sodium concentration multiplied by the soil bulk density. Soil alkali hydrolyzed nitrogen density (AND, g/m3) was calculated using the soil alkali hydrolyzed nitrogen concentration multiplied by the soil bulk density. Soil available phosphorus density (APD, g/m3) was calculated using the soil available phosphorus concentration multiplied by the soil bulk density. Soil organic (OCD, Kg/m3) and inorganic (ICD, Kg/m3) carbon density was calculated using the soil’s organic and inorganic carbon concentration multiplied by the soil bulk density. Soil total carbon density (TCD, Kg/m3) = OCD+ICD [69].
The mass ratio [66] of organic carbon and water-soluble calcium was represented as OC_WSCa, the mass ratio of organic carbon and water-soluble magnesium was represented as OC_WSMg, the mass ratio of organic carbon and water-soluble potassium was represented as OC_WSK, the mass ratio of organic carbon and water-soluble sodium was represented as OC_WSNa, the mass ratio of organic carbon and alkali hydrolyzed nitrogen was represented as OC_AN, the mass ratio of organic carbon and available phosphorus was represented as OC_AP, the mass ratio of inorganic carbon and water-soluble calcium was represented as IC_WSCa, the mass ratio of inorganic carbon and water-soluble magnesium was represented as IC_WSMg, the mass ratio of inorganic carbon and water-soluble potassium was represented as IC_WSK, the mass ratio of inorganic carbon and water-soluble sodium was represented as IC_WSNa, the mass ratio of inorganic carbon and alkali hydrolyzed nitrogen was represented as IC_ AN, the mass ratio of inorganic carbon and available phosphorus was represented as IC_AP, the mass ratio of alkali hydrolyzed nitrogen and water-soluble calcium was represented as AN_WSCa, the mass ratio of alkali hydrolyzed nitrogen and water-soluble magnesium was represented as AN_WSMg, the mass ratio of alkali hydrolyzed nitrogen and water-soluble potassium was represented as AN_WSK, the mass ratio of alkali hydrolyzed nitrogen and water-soluble sodium was represented as AN_WSNa, the mass ratio of available phosphorus and water-soluble calcium was represented as AP_WSCa, the mass ratio of available phosphorus and water-soluble magnesium was represented as AP_ WSMg, the mass ratio of available phosphorus and water-soluble potassium was represented as AP_WSK, the mass ratio of available phosphorus and water-soluble sodium was represented as AP_WSNa, the mass ratio of alkali hydrolyzed nitrogen and available phosphorus was represented as AN_AP.
Statistical Analysis
R function “aov” test and “LSD.test” were used to test the significance of differences in the soil’s organic and inorganic carbon, the ratio of soil organic and inorganic carbon, soil physicochemical properties, and stoichiometric ratio among and between addition rates of moss powder amendment in R version 4.0.5 [66]. Linear regression models were used to detect changes in soil organic and inorganic carbon, the ratio of soil organic and inorganic carbon, soil physicochemical properties, and stoichiometric ratios with increasing addition rates by performing the R package “ggplot2”. To explore the relationship between soil organic and inorganic carbon, the ratio of soil organic and inorganic carbon, and soil physicochemical properties and stoichiometric ratio, Pearson correlation analysis was applied using the “psych” and “igraph” packages in R version 3.6.1. p<0.05 suggests significance [67].
To deeply delve into the effects of various factors on soil carbon [54, 69], interpretable artificial intelligence was applied to isolate the importance of driving forces and depict how driving forces affect the model predictions of soil organic carbon, soil inorganic carbon, and the ratio of soil organic carbon and inorganic carbon through constructing an interpretable XGBoost (eXtreme Gradient Boosting) model using the “iml”, “tidymodels”, “xgboost”, and “shapviz” packages in R version 4.0.5. 43 input driving forces were standardized to have a mean of zero and a standard deviation of one [55].
The XGBoost model is an algorithm widely used in regression models due to its robustness and flexibility. The importance of driving forces was partitioned using the root mean squared error (RMSE) as the loss function and the SHapely Additive exPlanations (SHAP) technique. SHAP is a novel and powerful ex-post-interpretation framework [58] derived from Shapley values in game theory, which can robustly quantify the contributions of each driving force to artificial intelligence models’ predictions of soil organic carbon, soil inorganic carbon, and the ratio of soil organic carbon and inorganic carbon and enhance the global interpretability of the model [54] as compared to other techniques [70]. SHAP can also detect the interactions and nonlinearity in the data [55], which may be beneficial for us in identifying the critical thresholds and proposing a best-use strategy in saline-alkali soil. Moreover, SHAP integrates well with XGBoot and can effectively extract SHAP values [71]. A positive SHAP value signifies a positive effect on soil organic carbon, soil inorganic carbon, and the ratio of soil organic carbon and inorganic carbon; a negative one suggests an adverse effect [69]. The model’s accuracy was evaluated using four indicators: R2, Mean Absolute Error (MAE), Mean Square Error (MSE), and Root Mean Square Error (RMSE) [54, 55, 71, 72]. A lower MAE, MSE, and RMSE [73] and a higher R2 value indicate a better model fit [71, 74].
Supplementary material and data can be found at https://github.com/dlltargeting/organic_materials_ improve_soil.
Results and Discussion
Moss Powder Amendment Alters Soil Organic and Inorganic Carbon
Soil stores ca. twice the total carbon in the atmosphere and biosphere, and fluctuations in soil carbon directly impact the global carbon budget and atmospheric CO2 content [20, 52] and climates [52]. Previous research has suggested that adequate exogenous organic material input is a necessary condition for the massive build-up of soil organic carbon [6], since soil organic carbon is mainly imported by exogenous carbon [75], and the input of organic materials significantly elevated the net carbon sequestration [46]. Besides, soil salt inhibited the mineralization of soil organic material [25, 76], which was propitious to the accrual of soil organic carbon.
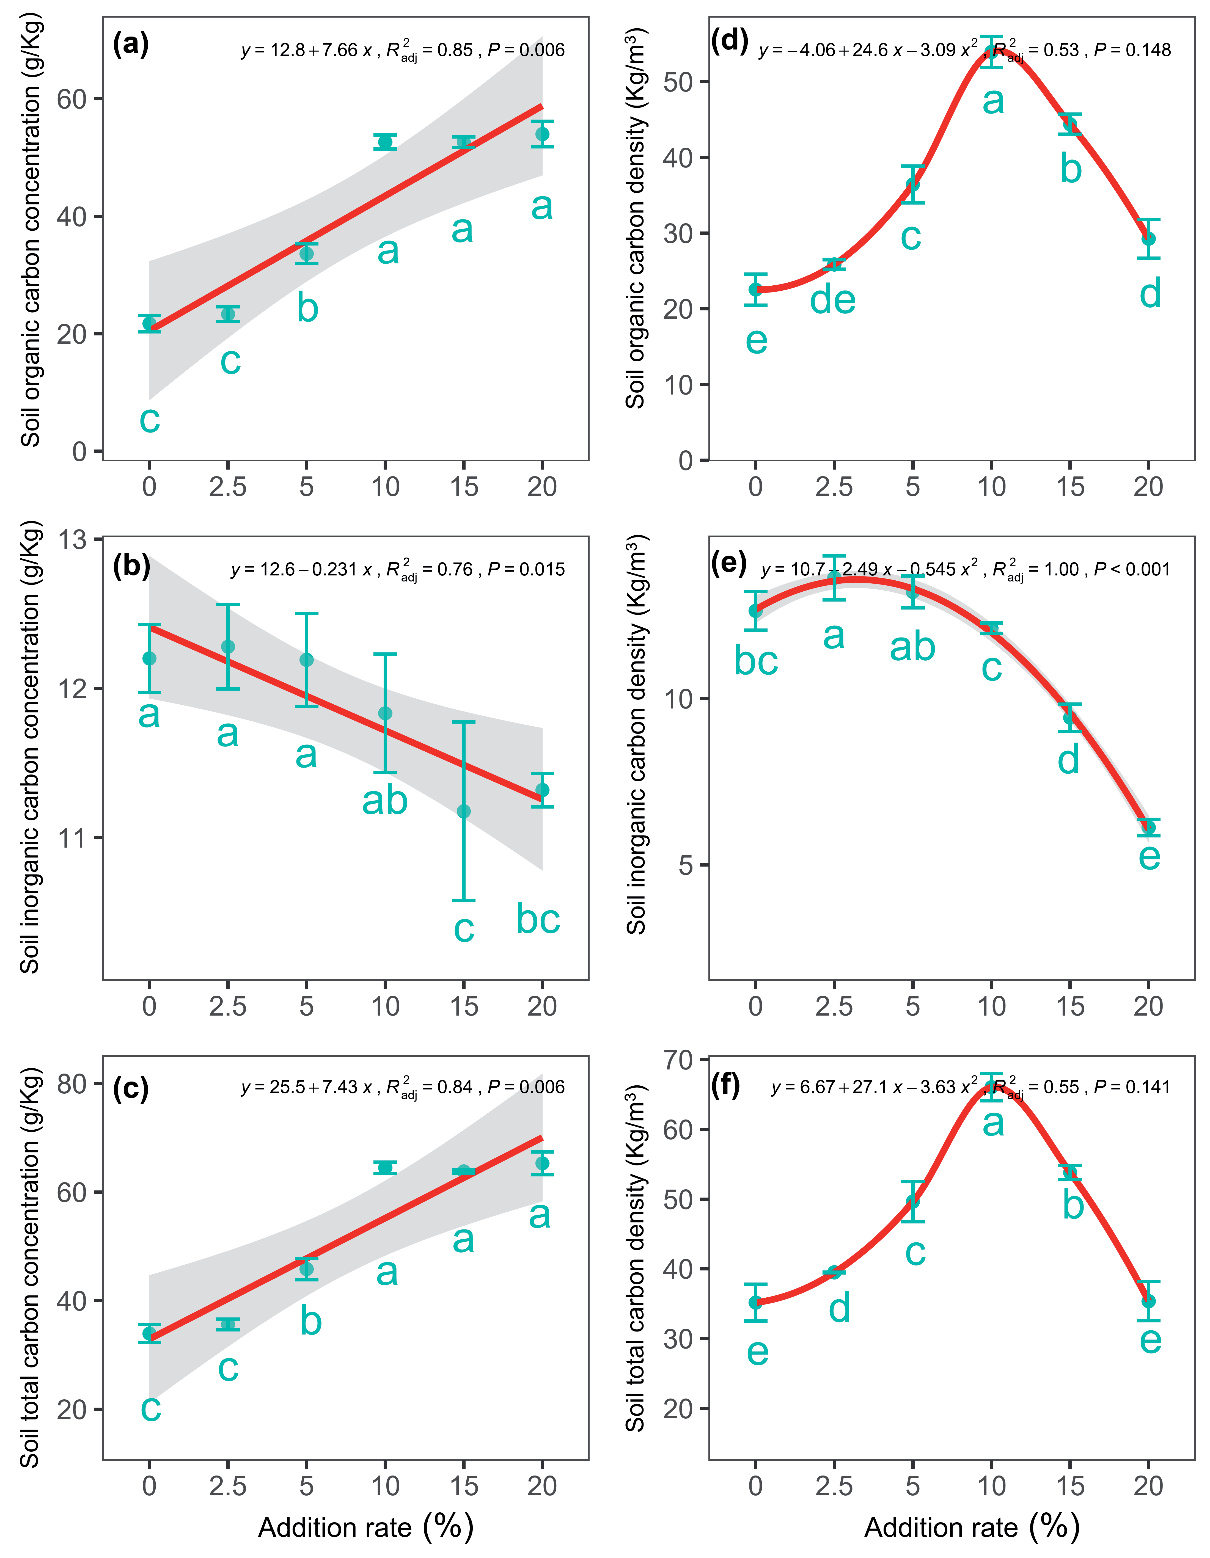
This study found that the soil organic carbon concentration (aov test p = 2.82e-12, Fig. 1a)) and total carbon concentration (aov test p = 3.63e-12, Fig. 1c)) linearly increased. The soil inorganic carbon concentration (aov test p = 7.37e-03, Fig. 1b)) linearly decreased with the increasing moss powder amendment addition rates. These findings supported our first hypothesis (H1) and previous studies’ findings [8, 9, 23, 60, 61]. The saline-alkali soils are characterized by low organic carbon [1]. In this and previous studies, organic amendments increased soil organic carbon concentration, thus improving the saline-alkali soils. Adding moss powder amendment was not entirely harmful to increasing soil inorganic carbon. Compared to the control without adding, adding 2.5% increased the mean value of soil inorganic carbon concentration (t test p = 0.7917, Fig. 1b)) and significantly improved the soil inorganic carbon density (t test p = 0.0210, Fig. 1e)).
The proper rate of moss powder amendment promoted the positive regulation of soil organic carbon on soil inorganic carbon, which facilitated the formation of soil inorganic carbon [29], consequently increasing the soil inorganic carbon [60]. However, more interestingly, the soil organic carbon density (aov test p = 1.20e-09, Fig. 1d)) and total carbon density (aov test p = 2.92e-09, Fig. 1f)) showed a convex parabolic variation with the peak values both occurring at the 10% addition rate. Soil inorganic carbon density (aov test p = 8.24e-10, Fig. 1e)) showed a convex parabolic variation with the peak value occurring at the 2.5% addition rate. These findings supported our first hypothesis (H1). These findings also revealed a threshold effect where abrupt changes occurred and supported our second hypothesis (H2) that there is an optimal rate to increase the organic and inorganic carbon content and density of saline-alkali soil.
The proper rate of moss powder in saline-alkaline soil could effectively increase soil organic and inorganic carbon density and total carbon density; excessive rates had adverse effects on those of the saline-alkaline soils. On the one hand, excessive addition of moss powder amendment can dilute soil organic and inorganic carbon, leading to a decrease in their density. On the other hand, excessive addition of moss powder amendment can produce acidic substances through decomposition, enhancing the release of soil inorganic carbon into the air, thereby reducing soil inorganic carbon density. This threshold phenomenon also occurs with other organic amendments. For instance, Liang et al. [21] found that biochar decreased bulk density and increased porosity, plant-available water, and field capacity of saline-alkali soil, whereas excessive biochar had a negative impact on soil hydraulic properties. Liu et al. [61] suggested that the highest soybean height, biomass, and yield were obtained at the 5% biochar, but the benefits decreased when the biochar rate exceeded this threshold. This study recommended the 10.0% addition rate as the best moss powder amendment addition strategy. At this optimal rate, the moss powder amendment significantly increased the soil organic carbon density (t test p = 1.75e-10, Fig. 1d)) and total carbon density (t test p = 6.42e-10, Fig. 1f)) without significantly negatively impacting the soil inorganic carbon density (t test p = 0.1864, Fig. 1e)).
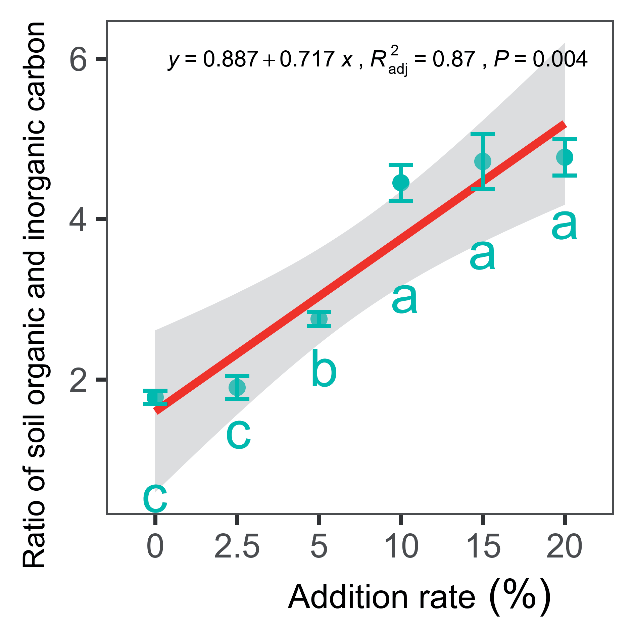
The ratio of soil organic carbon to inorganic carbon also represents the contribution of soil organic carbon to soil carbon. An increase in this ratio means that the contribution of soil organic carbon to soil carbon has been enhanced. This study showed that the ratio of soil organic to inorganic carbon (aov test p = 3.01e-10) linearly increased with the addition rates of moss powder amendment (Fig. 2), suggesting that the addition rates of moss powder amendment enhanced the contribution of soil organic carbon to soil carbon, and the increases in soil total carbon were derived from the increases in soil organic carbon. The higher accumulation of soil organic carbon was beneficial to the enhancement of the soil total carbon stock [29]; therefore, the moss powder amendment elevated the soil total carbon [11, 62] (Fig.1(c-f)).
Addition of Moss Powder Amendment Alters the Physical Properties of S oils
The physical properties of soils can be an important functional variable of soil physical context functions [67]. Its modification would affect soil microbiome [77], plant growth, and soil quality [78]. Previous research has suggested that organic material amendments notably improved the soil physical properties [15], viz. reduced soil pH [7, 10, 15, 23, 46, 49, 63, 64, 79-83]. Consistent with our thinking, some studies showed that soil pH could be reduced by acidic organic matters or acid-producing matters, viz. organic acids [10], fermenting straw [79], acidic biochar [7], nitro-compound fertilizer [80], humic acid fertilizer [26, 31], and desulfurization gypsum [84]. However, other studies have found that many types of biochar increased soil pH [62, 85].
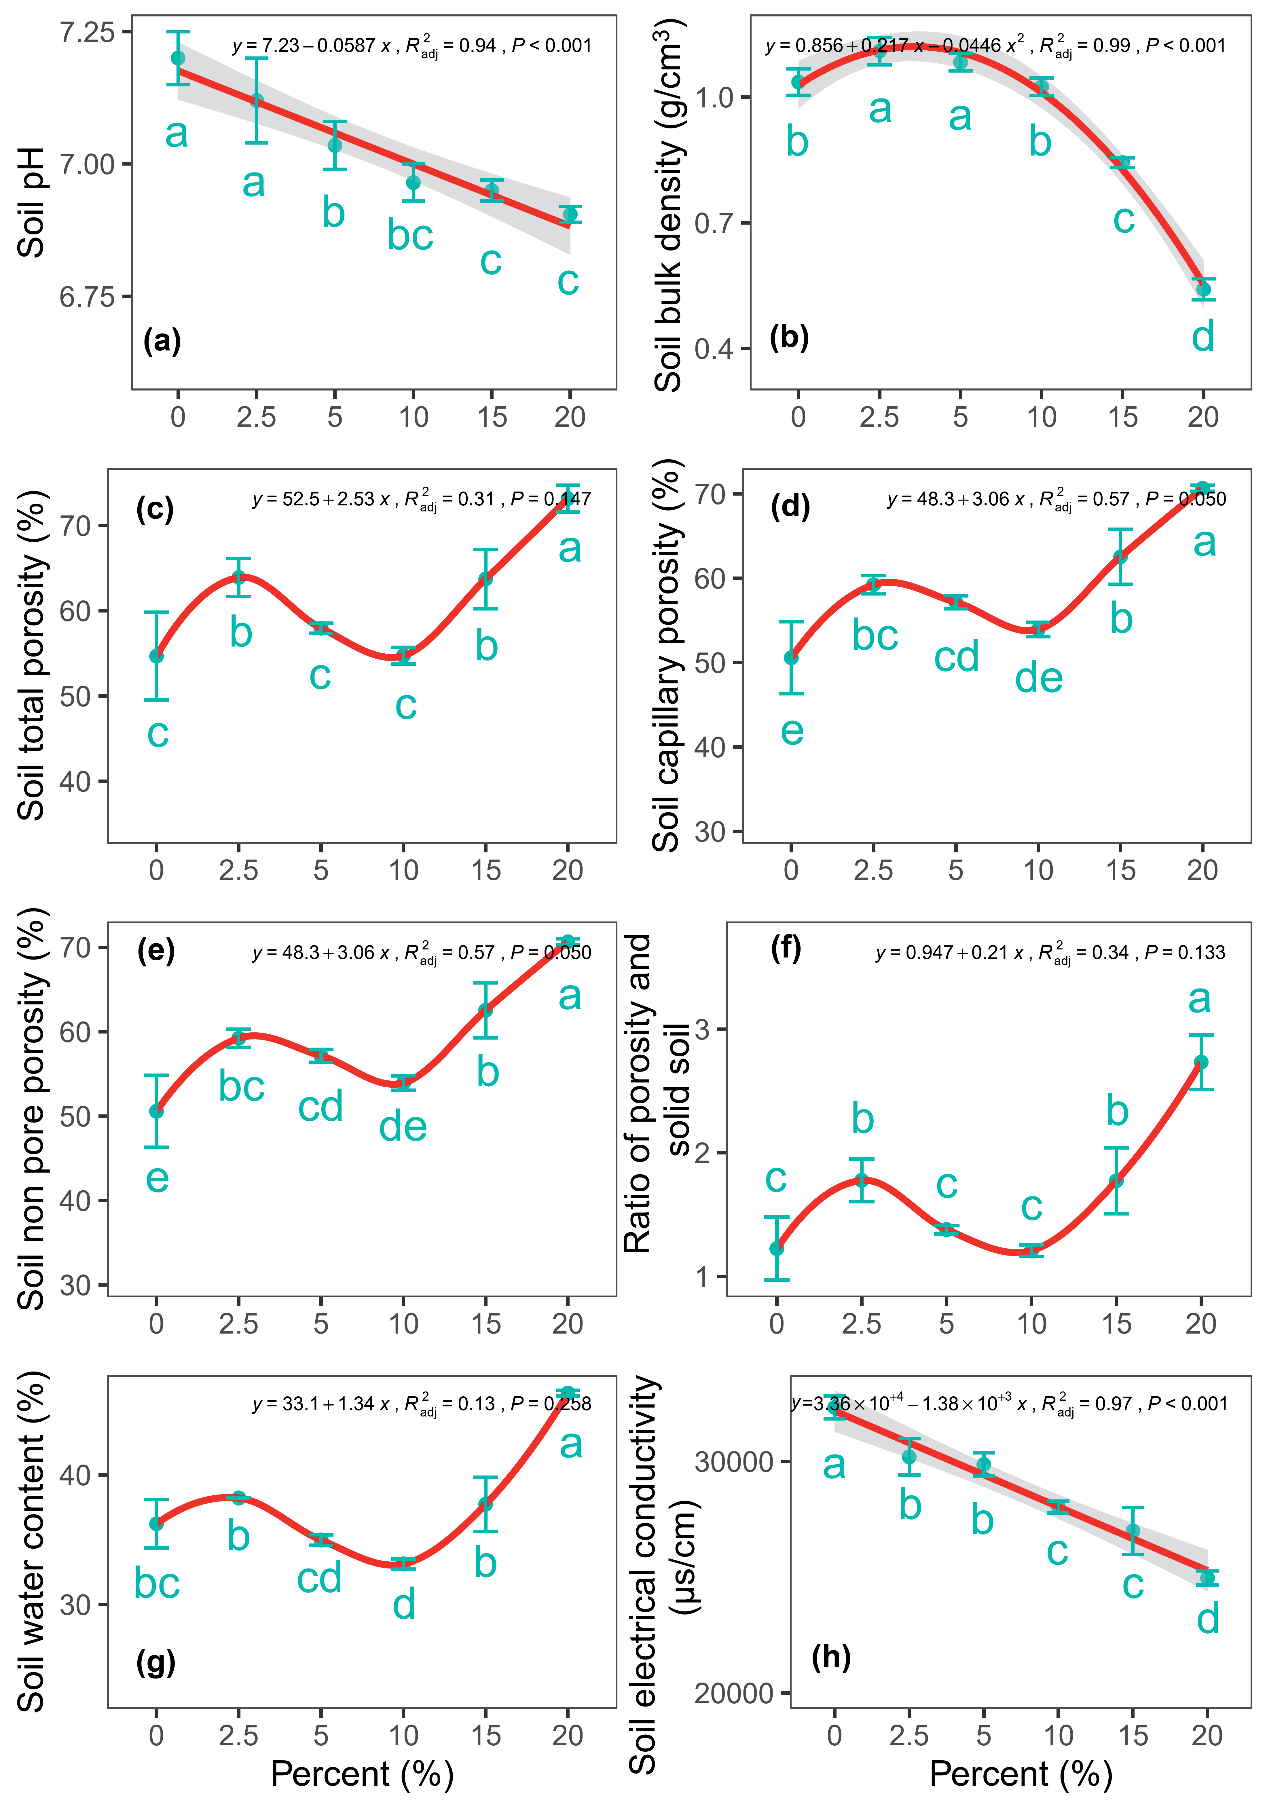
Our study demonstrated that the soil pH (aov test p = 3.48e-05, Fig. 3a)) linearly decreased with the increasing moss powder amendment addition rates. Moss decomposition can produce acid, thereby reducing soil pH. In line with previous findings that organic material reduced soil electrical conductivity [4, 6, 30, 82], this study showed that the soil electrical conductivity (aov test p = 8.69e-08, Fig. 3h)) linearly decreased with the increasing addition rates of moss powder amendment.
A lot of studies found that organic amendments increased soil porosity [3, 19, 21, 26, 28, 61, 64, 79] and soil water content [86], whereas, in our study, this scenario was only found at some addition rates (aov test p = 0.0001 – 2.13e-07, Fig. 3(c-g)). Under the optimal addition rate of 10% based on carbon density, these related soil physical properties were not significantly altered compared to the control without addition. Interestingly, the 2.5% addition rate hiked up the soil bulk density (t test p = 0.0035, Fig. 3b)) compared to the non-addition; this contradicted previous findings [3, 15, 19, 21, 28, 64]. However, the soil bulk density (aov test p = 2.01e-11, Fig. 3b)) showed the convex parabolic variation with the peak values occurring at the 2.5% addition rate. After a 2.5% addition rate, the moss powder amendment decreased the soil bulk density, supporting the above previous findings. The challenges of saline-alkaline soil are high pH [1] and electrical conductivity [25]. Our evidence showed that an appropriate rate of moss powder amendment in saline-alkaline soil could successfully revitalize soil physical properties by reducing soil pH and electrical conductivity without compromising soil bulk density, porosity, and water content.
Fig. 1.
Soil organic (a, d), inorganic (b, e), and total carbon (c, f) concentration (a-c) and density (d-f) changes with the addition rates of moss powder amendment (mean±standard deviation). Distinct letters signify significance. The red line represents linear regression. The gray shadow represents a 95% confidence interval.
Addition of Moss Powder Amendment Alters the Chemical Properties of Soils
Saline-alkaline soil is an eco-environmental issue hindering sustainable production [4, 83]. Soil chemical properties are crucial factors influencing vegetation growth and soil health [78]. Previous research has suggested that organic amendments notably boosted the soil’s chemical properties [15], viz., organic material amendments increased soil Ca2+ concentration [7, 79]. However, in our study, the addition rate of moss powder to varying degrees decreased the soil water-soluble calcium concentration (t test p = 1.66e-06 – 4.08e-05), the soil water-soluble calcium concentration (aov test p = 2.77e-05, Fig. S1a)) showed the concave parabolic variation with the lowest values both occurring at the 10% addition rate.
This Ca2+ in soil solutions could replace the superfluous Na+ in the soil colloids [35]; therefore, in this sense, soil water-soluble calcium concentration was speculated to be enhanced. On the contrary, our evidence supported that adding moss powder amendment decreased soil Na+ concentration [3, 7, 87] and soil total salt content [10, 11, 46, 64, 80, 83, 87]. Specifically, the soil water-soluble sodium concentrations (aov test p = 0.0003, Fig. S1d)) decreased with the increasing use rates of the moss powder amendment. The soil total salt concentration (aov test p = 8.69e-08, Fig. S1g)) showed the concave parabolic variation with the lowest values both occurring at the 10% addition rate. We speculate that the increase in soil colloids by the moss powder amendment in our study could absorb water-soluble sodium, but further research is needed. Since soil salinity decreased soil available phosphorus [88], the decreases in soil water-soluble sodium concentration (Pearson correlation r = -0.8449, p = 1.02e-05) and soil total salt concentration (Pearson correlation r = -0.5693, p = 0.0137) might be beneficial for increasing the availability of soil phosphorus (Fig. S1f)) which is a typically dominant limiting element [5, 20].
Furthermore, our evidence showed that soil water-soluble magnesium concentration (aov test p = 1.22e-10, Fig. S1b)), soil water-soluble potassium concentration (aov test p = 3.83e-09, Fig. S1c)), soil alkali-hydrolyzed nitrogen concentration (aov test p = 3.34e-11, Fig. S1e)), and soil available phosphorus concentration (aov test p = 2.48e-13, Fig. S1f)) increased with the increasing use rates of moss powder amendment. These supported the idea that the use of organic material elevated the soil fertility [46], viz. elevating nutrient availability [30] (concentrations of K+ and Mg2+ [4, 7, 61, 79], available nitrogen (74% and 48%), and available phosphorus [8, 11, 23, 28, 61, 63, 64, 81-83, 86, 89]). In contrast, soil water-soluble calcium density (aov test p = 3.26e-10, Fig. S1h)) decreased with the increasing moss powder amendment addition rates. Soil water-soluble potassium density (aov test p = 1.53e-07, Fig. S1j)), soil water-soluble sodium density (aov test p = 2.25e-08, Fig. S1k)), soil alkali hydrolyzed nitrogen density (aov test p = 1.76e-07, Fig. S1m)), and soil available phosphorus density (aov test p = 2.99e-06, Fig. S1n)) showed the concave parabola variation with the greatest values occurring at the 10, 5, 10, 10, and 10% addition rates, respectively. Soil water-soluble magnesium density (aov test p = 3.68e-09, Fig. S1i)) showed the concave curve variation with the greatest values occurring at the 15% addition rate. Nevertheless, the optimal addition rate of 10% based on carbon density decreased soil water-soluble calcium density (t test p = 9.33e-12, Fig. S1h)) and water-soluble sodium density (t test p = 0.0089, Fig. S1k)) but increased the soil water-soluble potassium density (t test p = 7.57e-06, Fig. S1j)), water-soluble magnesium density (t test p = 0.0047, Fig. S1i)), alkali hydrolyzed nitrogen density (t test p = 1.65e-08, Fig. S1m)), and available phosphorus density (t test p = 2.25e-05, Fig. S1n)) compared to not adding.
Soil-available nutrients and soil salt ions are supposed to exert significant roles in soil fertility [83]. High salinity and deficient nutrients are the dominant limiting factors in saline-alkaline soil [26]. However, our evidence proved that the addition of moss powder amendment improved the saline-alkaline soil health and quality by decreasing the salt concentration [87] and water-soluble calcium [30] and increasing soil available nutrients [19]. These findings highlight the practical potential of moss powder amendment for soil health management in saline-alkaline soils.
Addition of Moss Powder Amendment Affects Soil Stoichiometric Ratios
Soil stoichiometric ratios reflect soil nutrient balance [68] and strongly affect soil carbon [52]. In addition to being known for its high salinity and nutrient deficiencies [11, 19, 24, 26, 27], saline-alkali soil is also characterized by nutrient imbalance, limiting plant growth and reducing agricultural production [18].
Fig. 3.
Soil physical properties change with the addition rates of moss powder amendment (mean±standard deviation). Distinct letters signify significance. The red line represents linear regression. The gray shadow represents a 95% confidence interval.
This work showed that the ratio of soil organic carbon and water-soluble calcium (aov test p = 2.36e-12, Fig. S2a)), the ratio of soil organic carbon and water-soluble sodium (aov test p = 2.73e-11, Fig. S2d)), the ratio of soil inorganic carbon and water-soluble sodium (aov test p = 0.015, Fig. S3d)), the ratio of soil alkali hydrolyzed nitrogen and water-soluble calcium (aov test p = 5.35e-10, Fig. S4a)), the ratio of soil alkali hydrolyzed nitrogen and water-soluble potassium (aov test p = 9.86e-07, Fig. S4b)), the ratio of soil alkali hydrolyzed nitrogen and water-soluble sodium (aov test p = 3.85e-10, Fig. S4c)), the ratio of soil available phosphorus and water-soluble calcium (aov test p = 1.59e-10, Fig.S4d)), and the ratio of soil available phosphorus and water-soluble sodium (aov test p = 1.76e-10, Fig. S4f)) linearly increased with the addition rate of moss powder amendment with the greatest values occurring at the 10%, 20%, 20%, 20%, 20%, 20%, 20%, and 20% addition rates, respectively. However, the ratio of soil inorganic carbon and water-soluble magnesium (aov test p = 2.63e-10, Fig. S3b)), the ratio of soil inorganic carbon and water-soluble potassium (aov test p = 7.47e-09, Fig. S3c)), the ratio of soil inorganic carbon and alkali-hydrolyzed nitrogen (aov test p = 1.77e-10, Fig. S3e)), and the ratio of soil inorganic carbon and available phosphorus (aov test p = 2.60e-09, Fig. S3f)) linearly decreased with the greatest values occurring at the 5, 0, 0, and 0% addition rates. The ratio of soil-available phosphorus and water-soluble potassium (aov test p = 1.36e-05, Fig. S4e)) showed the concave parabola variation with the greatest values occurring at the 15% addition rate, respectively. Nonetheless, the ratio of soil organic carbon and alkali-hydrolyzed nitrogen (aov test p = 4.89e-05, Fig. S2e)), the ratio of soil organic carbon and available phosphorus (aov test p = 5.02e-10, Fig. S2f)), and the ratio of soil inorganic carbon and water-soluble calcium (aov test p = 0.0028, Fig. S3a)) showed the convex parabolic variation with the greatest values occurring at the 10% addition rate. The ratio of soil organic carbon and water-soluble magnesium (aov test p = 2.41e-08, Fig. S2b)), the ratio of soil organic carbon and water-soluble potassium (aov test p = 2.82e-09, Fig. S2c)), the ratio of soil alkali hydrolyzed nitrogen and water-soluble magnesium (aov test p = 1.81e-06, Fig. S4b)), the ratio of soil available phosphorus and water-soluble magnesium (aov test p = 1.77e-09, Fig. S4d)), and the ratio of soil-alkali hydrolyzed nitrogen and available phosphorus (aov test p = 1.24e-06, Fig. S4f)) showed curve variation changes with the greatest values occurring at the 10, 10, 10, 5, and 10% addition rates.
Previous studies have suggested that organic material addition increases the ratio of soil carbon to nitrogen [62, 81, 89]. Our study showed more complex and in-depth results.
Relationships of Soil Organic Carbon and Inorganic Carbon with Soil Physical and Chemical Properties and Soil Stoichiometric Ratios
Pearson correlation analysis showed significant correlation relationships between soil organic carbon concentration (p = 5.40e-18 - 0.0345), density (p = 4.12e-09 - 0.0454), inorganic carbon concentration (p = 3.30e-06 - 0.0370), density (p = 6.91e-15 - 0.0077), and the ratio of soil organic and inorganic carbon (p = 2.47e-14 - 0.0204) with soil physicochemical properties and soil stoichiometric ratios (Fig. 4(a-g), Table. S1). We grouped the underlying mechanisms into several pathways that may be functioning simultaneously, by which the moss powder amendment alters soil organic and inorganic carbon and the ratio of soil organic and inorganic carbon via significantly positive and negative effects of soil physicochemical [56], stoichiometric ratio properties [52] (Supplementary description), and increases in microbial activity.
Soil pH plays a key role in soil organic carbon decomposition [83]. The significantly negative relationship between soil pH and soil organic carbon concentration (Pearson correlation r = -0.8764, p = 1.84e-06) suggested that the moss powder amendment-induced decline in soil pH (Fig. 3a)) was beneficial for increasing soil organic carbon. Previous studies found that soil salinity repressed microbial activity [25], but organic materials reduced salinity [25] and increased microbial activity [23]. In this study, the significantly negative relationships between water-soluble sodium concentration (Pearson correlation r = -0.7802, p = 0.0001) and total salt concentration (Pearson correlation r = -0.7742, p = 0.0002) and soil organic carbon concentration suggested that the moss powder amendment-induced declines in soil water-soluble sodium concentration (Fig. S1d)) and total salt concentration (Fig.S1g)) were beneficial for the increase of soil organic carbon. This might be because the decrease in soil salinity increases microbial activity, which is beneficial for accumulating microbial-derived organic carbon [46]. However, further research is needed to confirm this.
It is worth noting that the moss powder amendment-induced alterations in the soil stoichiometric ratio significantly modified the soil’s organic and inorganic carbon and the ratio of organic and inorganic carbon. Specifically, the ratio of soil alkali-hydrolyzed nitrogen and water-soluble potassium (Pearson correlation r = 0.8654, p = 3.53e-06), the ratio of soil alkali-hydrolyzed nitrogen and water-soluble calcium (Pearson correlation r = 0.9549, p = 7.41e-10), and the ratio of soil-available phosphorus and water-soluble calcium (Pearson correlation r = 0.8593, p = 4.92e-06) significantly positively affected soil organic carbon concentration (Fig. 4a)), the ratio of soil alkali-hydrolyzed nitrogen and water-soluble magnesium (Pearson correlation r = 0.5732, p = 0.0129) significantly positively affected soil organic carbon density (Fig. 4b)), the ratio of soil alkali hydrolyzed nitrogen and water-soluble calcium (Pearson correlation r = 0.9539, p = 8.9e-10), ratio of soil alkali-hydrolyzed nitrogen and water-soluble potassium (Pearson correlation r = 0.8653, p = 3.55e-06), ratio of soil available phosphorus and water-soluble calcium (Pearson correlation r = 0.8562, p = 5.8e-06) significantly positively affected soil total carbon concentration (Fig. 4e)), the ratio of soil alkali hydrolyzed nitrogen and water-soluble magnesium (Pearson correlation r = 0.6501, p = 0.0035) significantly positively affected soil total carbon density (Fig. 4f)), supporting our previous findings [52]. The ratio of soil organic carbon and available phosphorus (Pearson correlation r = 0.8647, p = 3.65e-06), ratio of soil organic carbon and water-soluble potassium (Pearson correlation r = 0.9574, p = 4.78e-10), ratio of soil organic carbon and alkali hydrolyzed nitrogen (Pearson correlation r = 0.7018, p = 0.0012), ratio of soil alkali hydrolyzed nitrogen and available phosphorus (Pearson correlation r = 0.8257, p = 2.44e-05), ratio of soil available phosphorus and water-soluble sodium (Pearson correlation r = 0.8077, p = 5.03e-05), ratio of soil alkali hydrolyzed nitrogen and water-soluble calcium (Pearson correlation r = 0.9536, p = 9.29e-10), ratio of soil inorganic carbon and water-soluble sodium (Pearson correlation r = 0.5487, p = 0.0184), ratio of soil alkali hydrolyzed nitrogen and water-soluble sodium (Pearson correlation r = -0.9269, p = 3.26e-08), ratio of soil available phosphorus and water-soluble calcium (Pearson correlation r = 0.8658 p = 3.45e-06), ratio of soil alkali hydrolyzed nitrogen and water-soluble potassium (Pearson correlation r = 0.8605, p = 4.61e-06), ratio of soil organic carbon and water-soluble calcium (Pearson correlation r = 0.9870, p = 3.96e-14), ratio of soil organic carbon and water-soluble sodium (Pearson correlation r = 0.9877, p = 2.47e-14) significantly positively impacted the ratio of organic and inorganic carbon, whereas, the ratio of soil inorganic carbon and water-soluble potassium (Pearson correlation r = -0.9661, p = 7.87e-11), ratio of soil available phosphorus and water-soluble magnesium (Pearson correlation r = -0.5562, p = 0.0165), ratio of soil inorganic carbon and water-soluble magnesium (Pearson correlation r = -0.8411, p = 1.23e-05), ratio of soil inorganic carbon and available phosphorus (Pearson correlation r = -0.9149, p = 1.06e-07), ratio of soil inorganic carbon and alkali hydrolyzed nitrogen (Pearson correlation r = -0.9684, p = 4.51e-11) significantly negatively impacted the ratio of soil organic and inorganic carbon (Fig. 4g)). These results suggested that soil stoichiometric ratios might impact the contribution of soil organic carbon to soil carbon.
Besides, our evidence revealed that soil organic carbon (Fig. 4(a-b)), total carbon (Fig. 4(e-f)), and the ratio of soil organic and inorganic carbon (Fig. 4g)) had more frequent positive relationships than negative relationships with the soil’s physiochemical properties and soil stoichiometric ratios; however, soil inorganic carbon had the opposite situation (Fig. 4(c-d)).
Interpretable Artificial Intelligence Identifies Critical Drivers and Thresholds
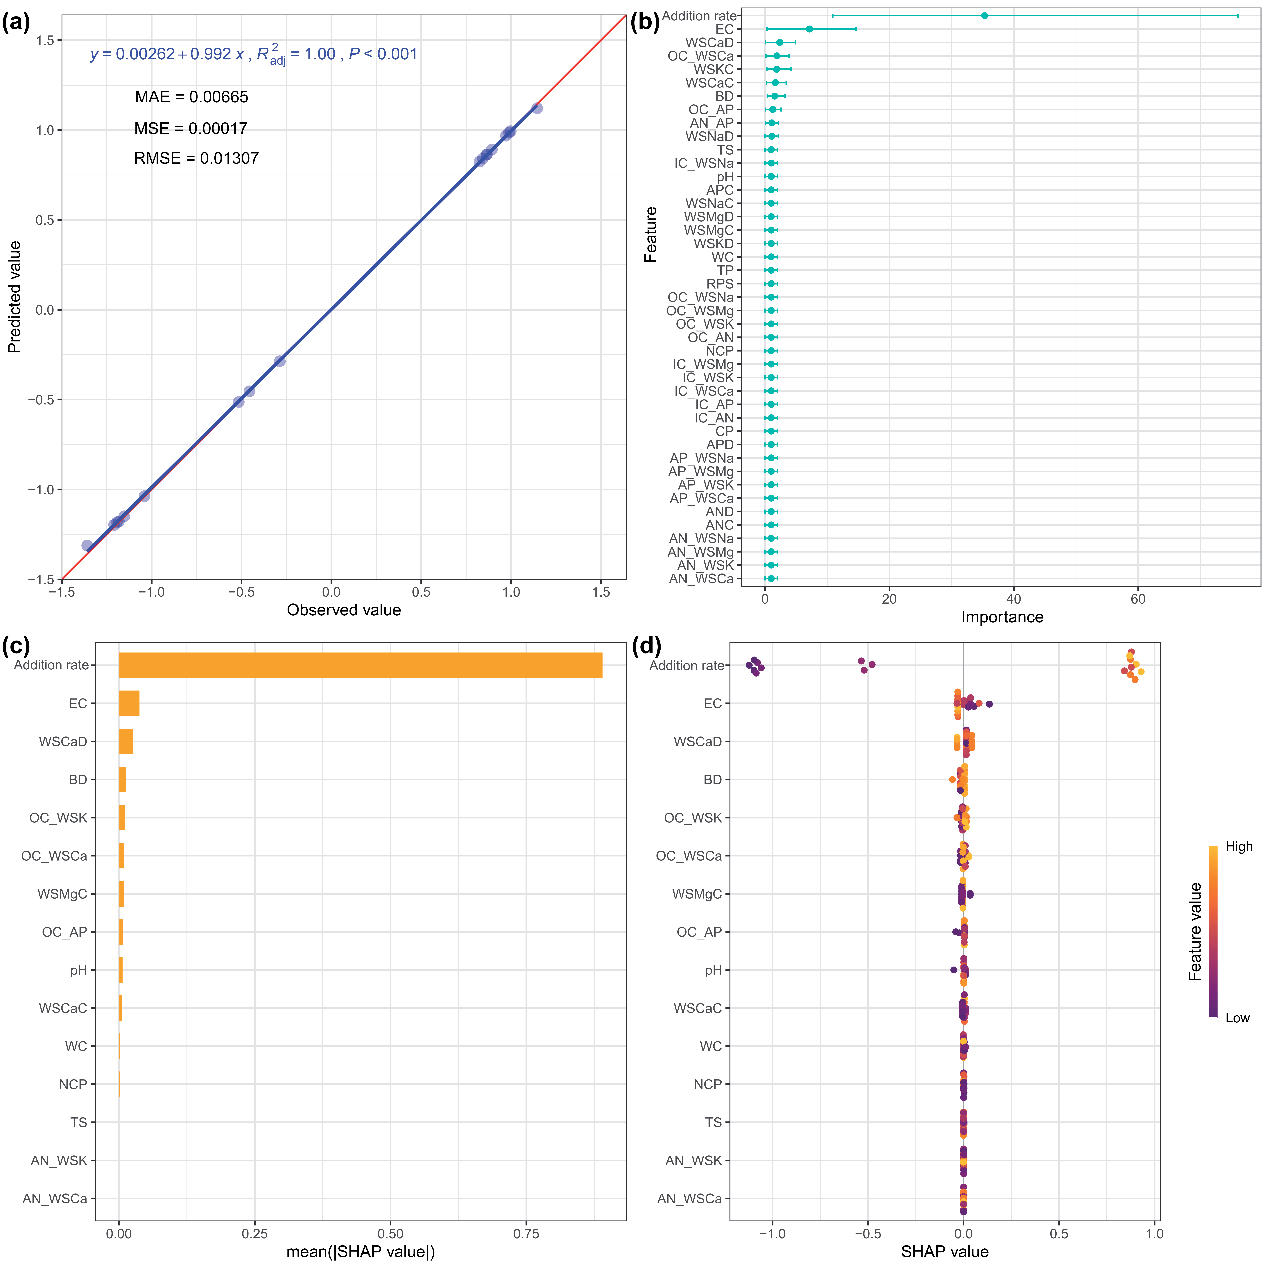
Admittedly, traditional statistics (e.g., aov/t test, linear regression, and Pearson correlation analysis) made some important new discoveries. Nevertheless, Pearson correlation analysis revealed too many relationships of soil organic carbon, inorganic carbon, and the ratio of soil organic carbon to inorganic carbon with soil physical and chemical properties and soil stoichiometric ratios, but not the most critical driver. However, interpretable artificial intelligence could help us identify the critical drivers. Although the importance of driving forces differs between the loss of root mean squared error (RMSE, Fig. 5b)) and the SHAP value (Fig. 5c)-d)), both methods indicated that the addition rate, soil electrical conductivity, and soil water-soluble calcium density were the three most significant factors influencing soil organic carbon concentration, and the addition rate was the top driving force promoting (Fig. 4a), Table S1) soil organic carbon concentration (Fig. 5(b-d)). However, the soil alkali-hydrolyzed nitrogen density and soil non-capillary porosity were the two most significant driving forces influencing soil organic carbon density, and the soil alkali-hydrolyzed nitrogen density rather than the addition rate (Fig. 4b)) was the top driving force promoting soil organic carbon density (Fig. S5(b-d)). The soil electrical conductivity was the top driving force promoting (Fig. 4c)) soil inorganic carbon concentration (Fig. S6(b-d)).
The addition rate, soil electrical conductivity, soil bulk density, and soil water content were the four most significant driving forces influencing soil inorganic carbon density, and the addition rate was the top driving force negatively impacting (Fig. 4d)) soil inorganic carbon density (Fig. S7(b-d)). The addition rate and soil electrical conductivity were among the four most significant factors influencing soil total carbon concentration, and the addition rate was the top driving force promoting (Fig. 4e)) soil total carbon concentration (Fig. S8(b-d)). Although the top driving force differs between the loss of root mean squared error (RMSE, Fig. S9b)) and the SHAP (Fig. S9(c-d)), both methods indicated that the mass ratio of organic carbon and alkali-hydrolyzed nitrogen, soil water-soluble potassium density, and soil total porosity were the three most significant factors influencing soil total carbon density (Fig. S9(b-d)). Although the order of driving forces differs between the loss of root mean squared error (RMSE, Fig. S10b)) and the SHAP (Fig. S10(c-d)), both methods indicated that the addition rate, soil electrical conductivity, soil total salt concentration, soil water-soluble calcium concentration, and soil water-soluble calcium density were the five most significant factors influencing the ratio of soil organic carbon and inorganic carbon. The addition rate was the top driving force promoting (Fig. 2, Fig. 4g)) the ratio of soil organic carbon and inorganic carbon (Fig. S10(b-d)). Therefore, traditional statistics cannot compete with interpretable artificial intelligence in isolating the importance of driving forces, especially in the context of the increasing popularity of artificial intelligence in agricultural biogeochemical studies [72].
It is worth noting that the artificial intelligence model had a usual disadvantage: A lack of interpretability; therefore, the artificial intelligence model was considered a “black box” and hardly provided knowledge about agricultural management [72] in the past. However, interpretable artificial intelligence aims to provide a range of methods and techniques that enable the decision-making processes of complicated models to be understood and interpreted, emphasizing transparency and understanding of the models and helping to improve their practical applicability.
In this study, the interpretable XGBoost models integrated with the SHAP value technique addressed the interpretability of a complicated model with 43 input driving forces. They improved the understanding concerning the importance of driving forces and depicted how driving forces affect the model predictions of soil organic carbon, soil inorganic carbon, and the ratio of soil organic carbon and inorganic carbon, thereby overcoming the aforementioned drawbacks [72]. For instance, the SHAP values in Fig. S11 quantified the influence of the addition rate on the soil organic carbon concentration and density. A positive SHAP value signifies a positive effect on soil organic carbon concentration; a negative one suggests an adverse effect [69]. It is obvious that the positive influence of the addition rate on soil organic carbon concentration and density reached a plateau (Fig. S11(a-b)) and maximum (Fig. S12a)) at an addition rate of 10%, respectively. However, traditional statistics (e.g., aov/t test and linear regression) informed us that soil organic carbon concentration and density increased to the peak value at the addition rates of 20% and 10%, respectively. These traditional statistics are not conducive to us making decisions on proposing optimal rates. Analogously, at the addition rate of 10%, the SHAP values showed that the negative influence of the addition rate on soil inorganic carbon concentration reached a minimum (Fig. S13a)), and the positive influence of the addition rate on soil inorganic carbon density started to decline (Fig. S14a)). However, traditional statistics (e.g., aov/t test and linear regression) indicated that soil inorganic carbon concentration and density increased to the peak value at the addition rates of 0% and 2.5%, respectively. The SHAP values showed the positive influence of the addition rate on soil total carbon concentration reached a plateau (Fig. S15a)), the negative influence of the addition rate on soil total carbon density reached a minimum (Fig. S16a)), and the positive influence of the addition rate on the ratio of soil organic carbon and inorganic carbon reached a plateau (Fig. S17a)). However, traditional statistics (e.g., aov/t test and linear regression) indicated that the soil total carbon concentration, density, and the ratio of soil organic carbon to inorganic carbon increased to the peak values at the addition rates of 20, 10, and 20%, respectively. In short, the inconsistent results of aov/t test and linear regression exist between the concentration and density of soil organic, inorganic, and total carbon, as well as between the density of soil organic and inorganic carbon. This inconsistency cannot directly tell us the critical threshold or the optimal addition rate (Fig. S18)). In contrast, the SHAP values quantitatively explained the effects of driving forces and the change in these effects with driving forces. The model produced consistent results for optimal rates, which are conducive to decision-making for optimal rates (Fig. S18)). This interpretable artificial intelligence model thus turned the “black box” into the “white box” [90]. Furthermore, SHAP dependence plots display the effect of two driving forces on the SHAP values, suggesting that there were interaction effects of driving forces on soil organic carbon, soil inorganic carbon, and the ratio of soil organic carbon and inorganic carbon (Fig. S11-S17), which was the information that traditional statistics (e.g., aov/t test and linear regression) could not provide. Collectively, the 10% addition rate (e.g., 48 t/hectare) was recommended to increase soil carbon in saline-alkali soil. Besides, the interpretable artificial intelligence was a good artificial intelligence “white box”, contributing to interpreting soil carbon dynamics.
Fig. 4.
Pearson correlation analysis shows the significant (p<0.05) relationships between soil organic and inorganic carbon with soil physical and chemical properties and soil stoichiometric ratios. The insignificant (p>0.05) relationship was not displayed. OCC, soil organic carbon concentration; OCD, soil organic carbon density; ICC, soil inorganic carbon concentration; ICD, soil inorganic carbon density; TCC, soil total carbon concentration; TCD, soil total carbon density; OCIC, ratio of soil organic and inorganic carbon; BD, soil bulk density; TP, soil total porosity; CP, soil capillary porosity; NCP, soil non-capillary porosity; RPS, ratio of soil porosity and solid soil; WC, soil water content; EC, soil electrical conductivity; TS, soil total salt content; WSCaC, soil water-soluble calcium concentration; WSMgC, soil water-soluble magnesium concentration; WSKC, soil water-soluble potassium concentration; WSNaC, soil water-soluble sodium concentration; ANC, soil alkali hydrolyzed nitrogen concentration; APC, soil available phosphorus concentration; WSCaD, soil water-soluble calcium density; WSMgD, soil water-soluble magnesium density; WSKD, soil water-soluble potassium density; WSNaD, soil water-soluble sodium density; AND, soil alkali hydrolyzed nitrogen density; APD, soil available phosphorus density. Soil stoichiometric ratios, i.e., OC_WSCa, were the mass ratios of soil organic carbon and water-soluble calcium.
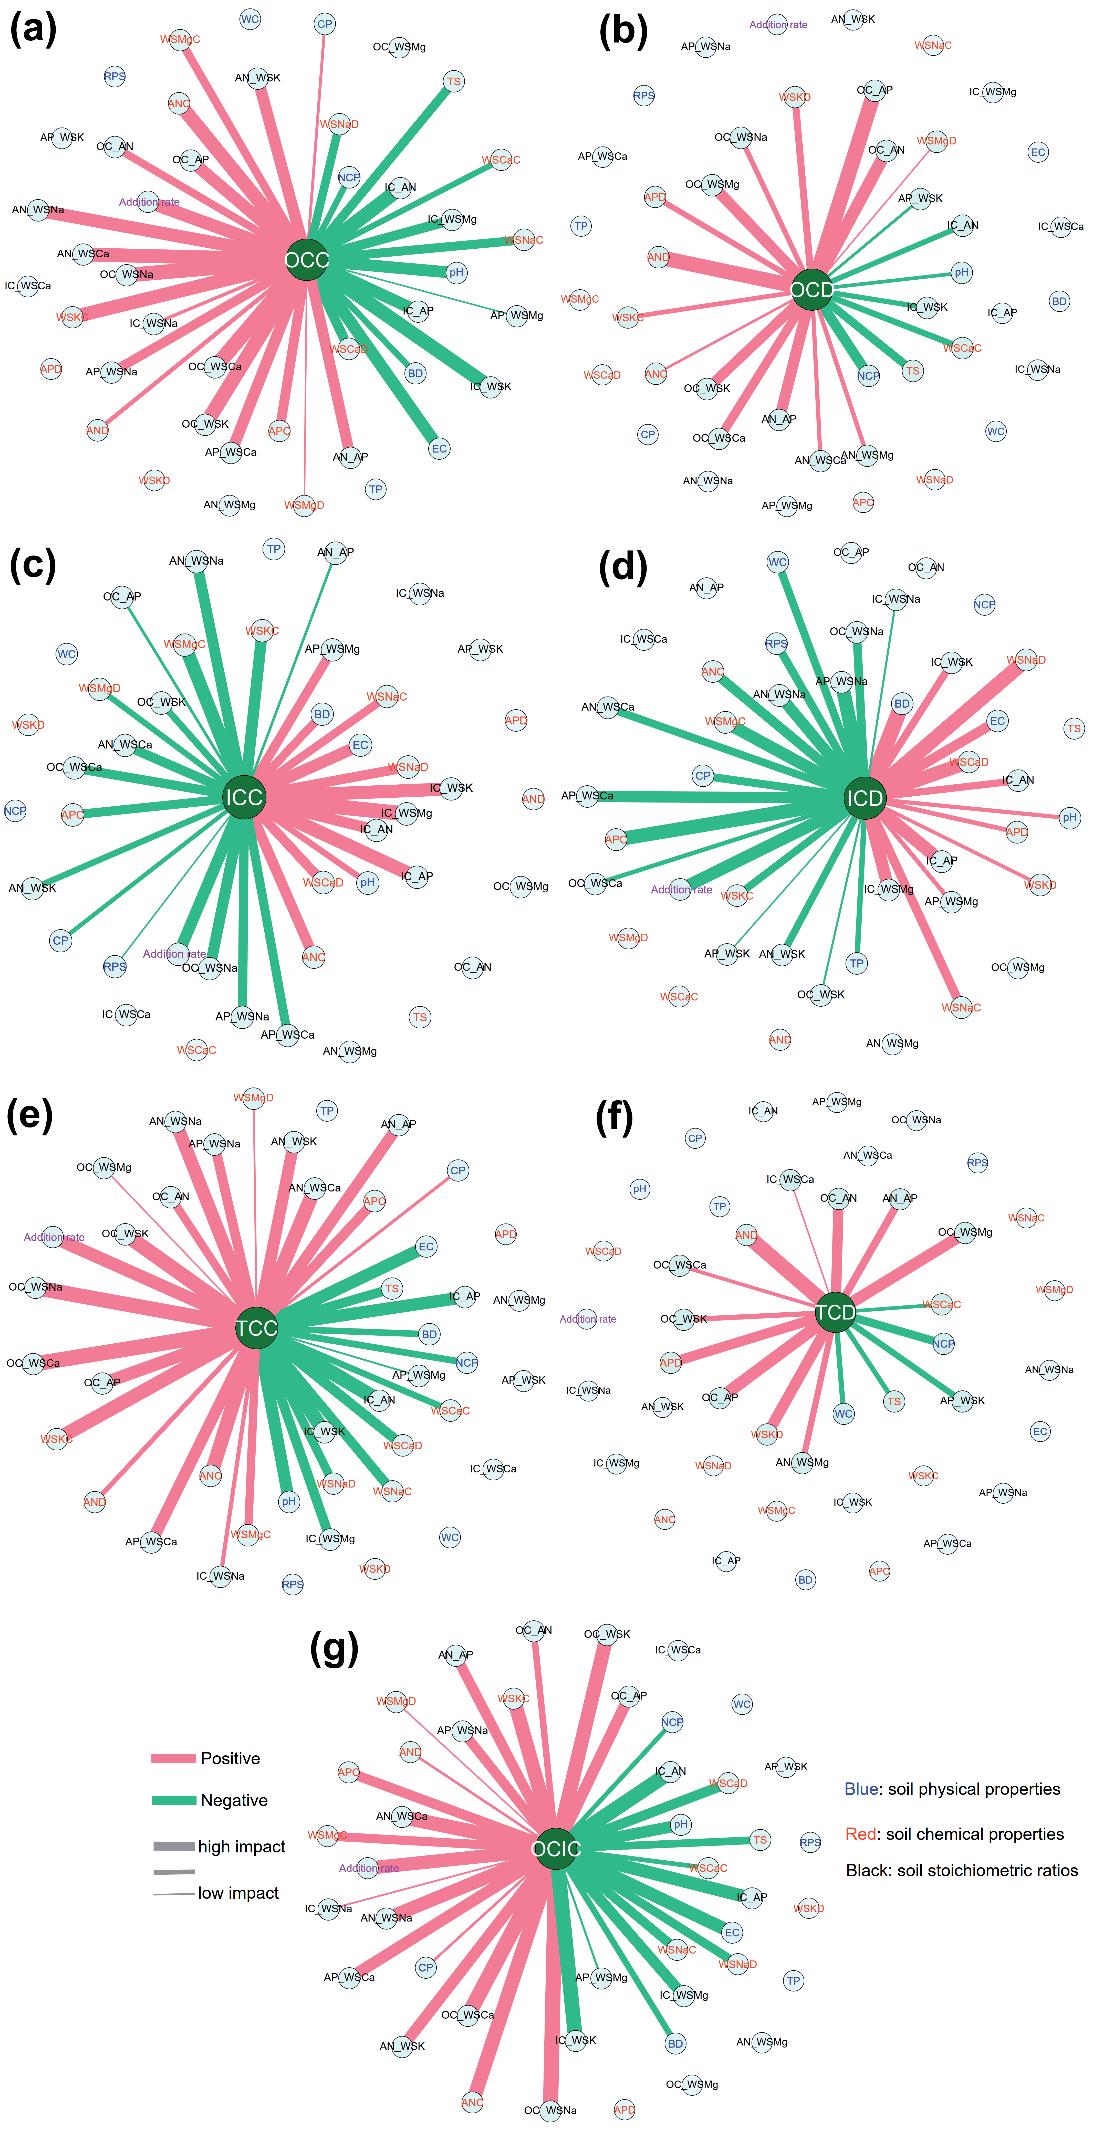
Fig. 5.
The results of the interpretable XGBoost model for soil organic carbon concentration. a) The final regression fitting results for the interpretable XGBoost model. b) The importance of driving forces (features) based on the loss of root mean squared error (RMSE) was shown by the value of the ±95% confidence interval. c) The mean absolute SHAP values (i.e., mean |SHAP values|) quantifying the importance of driving forces. d) The beeswarm plot of the SHAP value explains the global importance of the driving forces for soil organic carbon concentration; each dot corresponds to an individual sample in the study [90]. The dot’s position on the x-axis shows the impact of driving forces on the interpretable XGBoost model’s prediction for that sample. When multiple dots land at the same x position, they pile up to show density [90]. The low Mean Absolute Error (MAE), Mean Square Error (MSE), and Root Mean Square Error (RMSE) and the good fit (R2) of the observed value and predicted value suggested the predictive power of interpretable XGBoost models for soil organic carbon concentration.
The successful application of interpretable artificial intelligence in this study and previous studies [90] has also emphasized the undeniable prospects of interpretable artificial intelligence in improving soil amendment strategies.
Technically, the 10% recommended rate increased soil organic carbon by 139%, which is higher than the global average level (86%) reported by a recent meta-analysis of organic material addition [46]. Our evidence suggests that with an application rate of 48 t/hectare (i.e., the 10% recommended rate), the moss powder amendment could increase soil organic and total carbon by 15.7 and 15.4 t/hectare, respectively. Economically, this carbon benefit would cost 33,000 USD/hectare at the price of moss powder amendment of 687.7 USD/t (the price information provided by Zilin Moss Planting Company in Dushan County, Guizhou Province, China). If the benefits (excluding carbon benefits), such as soil health benefits (improving soil physical properties and reducing soil salt concentration, water-soluble calcium, and increasing soil available nutrients), are also considered, this rate might be economically viable. Besides, the biochar amendment technique has already been evidenced as a potentially cost-effective and environmentally friendly technique and one of the most attractive research hotspots [85] due to biochar’s high stable carbon [2], porosity, and ability to improve soil organic carbon [1, 25], structure, fertility [85], and health [2]. Further research is needed to compare the technical and economic feasibility of moss and biochar derived from moss and other organic materials in fields to achieve global climate and food security goals.
Conclusions
Saline-alkali soil needs improvement due to its high salt, high pH, high electrical conductivity, deficient nutrients, and low organic carbon. This study showed that interpretable artificial intelligence was conducive to identifying the critical drivers and thresholds of soil carbon dynamics, highlighting the undeniable prospects of interpretable artificial intelligence in improving saline-alkali soil amendment strategies. 10% was identified as an optimal addition rate strategy of moss powder amendment; at this rate, the saline-alkali soil health and quality were improved, that is, reducing soil salt concentration, pH, and electrical conductivity without compromising soil bulk density, porosity, and water content, as well as increasing soil available nutrients, soil organic carbon density, and total carbon density without significantly negatively impacting soil inorganic carbon density. However, these findings may have limitations due to the specificity of the saline-alkali soils and the lab scale. Future work is suggested to compare the moss and biochar derived from moss and other organic materials in different saline-alkali fields and to verify the applicability of various interpretable artificial intelligence techniques for soil health management.

