

Introduction
Due to the promotion of agricultural policies, economic growth, and scientific and technological progress, China’s agriculture and animal husbandry industry has entered into a high-speed development stage. At the same time, it also generates some problems, mainly greenhouse gas emissions in the production process of agriculture and animal husbandry [1]. According to the data, in the world, the emission of greenhouse gases such as carbon dioxide produced by agriculture and animal husbandry is about 10% to 12% [2]. In China, carbon emissions of greenhouse gases generated by agriculture and animal husbandry account for about 16% to 17% of China’s total carbon emissions [3]. The Chinese government requires agriculture and animal husbandry to be green, low-carbon, and recycling production. At the same time, China proactively develop international cooperation to play the role of promoter, contributor, and leader in the process of ecological civilization in the world [4]. How will the trend of carbon emissions from agriculture and animal husbandry change as China’s agriculture and animal husbandry develops its agricultural and animal husbandry economy? It is necessary to research the prediction of carbon emissions from China’s agriculture and animal husbandry.
As a basic industry, agriculture and animal husbandry carbon emissions are mainly generated directly or indirectly through planting, breeding, and processing. Agricultural and animal husbandry production processes, such as crop planting, fertilizer use, mechanized operation, and farmland irrigation, all lead to carbon emissions [5]. Meanwhile, livestock farming also generates carbon emissions [6]. Carbon emissions from agriculture and animal husbandry include carbon emissions produced by plantation and livestock farming [7]. The mixed farming and animal husbandry belt plays a unique role in China’s geographic region where planting and animal husbandry coexist, and the region practices a mixed management model of half-farming and half-pastoralism, switching with the seasons. The comprehensive land utilization rate of the area reaches 82%, with grassland accounting for 43% and farmland occupying 29%. Grassland and farmland are listed together as the core land use patterns in the mixed belt [8]. The land use choices here are deeply influenced by variable environmental factors, presenting a rich diversity of land use types. In such a background, studying the prediction of carbon emissions from agriculture and animal husbandry is of great practical significance.
Scholars’ research on carbon emissions from agriculture and animal husbandry mainly focuses on the following aspects:
First, carbon sources and measurement of carbon emissions from agriculture and animal husbandry: for example, it was found that carbon emissions from agriculture and animal husbandry mainly come from livestock and poultry, rice cultivation, and agricultural energy fields [9]. It was found that agricultural materials, rice cultivation, soil N2O, livestock and poultry cultivation, and straw burning are the five sources of carbon emissions from agriculture and animal husbandry [10]. It conducted research on the pig farming industry and calculated the total greenhouse gas emissions throughout its lifecycle [11]. It chose agricultural land use, paddy fields, crop production, livestock manure storage, and livestock enteric fermentation as five carbon sources to measure carbon emissions in the agro-pastoral ecology of Taiwan’s Straits Economic Zone from 2010 to 2017 [12]. It used the Jilin Province of China’s 1998-2018 agricultural and animal husbandry carbon emission statistics and thought deeply about the sources of carbon emissions. It showed results that agricultural resource inputs were the main source of carbon emissions from cultivation, and livestock production was the main source of carbon emissions from animal husbandry [13]. It measured and analyzed the spatial and temporal distribution characteristics of agricultural and animal husbandry carbon emissions in Jiangsu Province from the three sources of carbon, such as agricultural land use, rice cultivation, and livestock breeding [14]. It measured the carbon emissions from the agricultural and animal husbandry ecology of carbon emissions from agriculture and animal husbandry in Jiangxi Province from 2000 to 2019 and analyzed their temporal characteristics [15]. It calculated the greenhouse gas emissions from feed production for broiler chickens, laying hens, and pigs in Thailand [16].
Second, the influencing factors of carbon emissions from agriculture and animal husbandry: for example, it was found that the economic development of agriculture and animal husbandry, labor force, urbanization rate, rural per capita consumption expenditure, and total power of agricultural machinery are the influencing factors of carbon emissions from agriculture and animal husbandry [17]. It was found that the five factors leading to an increase in greenhouse gas emissions from animal husbandry are livestock production efficiency, agricultural industry structure, per capita agricultural production income, urbanization, and total population [18]. It studied the main factors and differences in carbon emissions from agriculture and animal husbandry between the north and south of China. The results showed that factors such as optimization of the structure of the agricultural industry can inhibit the growth of carbon emissions from agriculture and animal husbandry. In contrast, the level of development of the agricultural economy promotes an increase in carbon emissions from agriculture and animal husbandry [19]. It was found in their research on regional animal husbandry in China that economic growth and population have a positive contribution to carbon emissions from animal husbandry, while technological progress, changes in agricultural structure, and changes in national industrial structure have a negative contribution [20]. It was found that the five influencing drivers of carbon emissions from the agriculture and animal husbandry industries were technological progress, livestock structural adjustment, agricultural structural adjustment, living affluence, and population growth [21]. It conducted a study on the agriculture and animal husbandry industry in Fujian Province, China. The influencing factors are research and development intensity, the proportion of the agricultural labor force, the value added in agriculture, the structure of the agricultural industry, the disposable income per capita of the rural residents, and the per capita area of arable land, etc. [22]. It was found that the economic growth, crop production index, and livestock production index positively affect the increase in carbon emissions from agriculture and livestock, while energy consumption and population negatively affect the increase in carbon emissions from agriculture and livestock [23]. It was found that crop production, livestock production, population growth, rainfall, and temperature positively affect CO2 emissions in Pakistan, while energy use negatively affects CO2 emissions [24].
Third, the reduction path of carbon emissions from agriculture and animal husbandry: for example, it is measured by improving technologies and practices to increase livestock productivity while optimizing the use of land and water resources, reorienting grazing systems to provide environmental services for water, biodiversity, carbon sequestration, and resource conservation; reducing GHG emissions from livestock production; and formulating effective management strategies for the efficient and sustainable use of manure in livestock production [25]. It conducted research on animal husbandry in Inner Mongolia, China, and proposed carbon reduction measures providing theoretical support for promoting the industrial transformation and upgrading of animal husbandry [26]. It studied the greenhouse gas emissions from agriculture and animal husbandry in France from 2010-2014, and the results showed that only a deep change in the structure of the agricultural and livestock food system could double the GHG emissions from the agricultural and livestock sector [27]. It conducted research on the aquaculture industry in Zhejiang Province, China, and found that adjusting the breeding and dietary structure can reduce carbon emissions [28]. Through their study, the suggestion was given that countries need to improve agricultural production methods according to their level of development, minimize the positive correlation between vegetation and livestock production, adopt more environmentally friendly agricultural technologies, and support international environmental policies [29]. It proposed agricultural strategies, livestock management strategies, and aquaculture methods to reduce carbon emissions in agriculture and animal husbandry [30]. It proposed reducing carbon emissions from China’s animal husbandry industry based on three factors: environmental efficiency, production efficiency, and economic share [31]. It examined various ways to reduce emissions from agriculture and livestock, including sustainable agricultural practices, improved livestock management, and precision agriculture [32]. It explored the interactions between economic-environmental-social factors, technological progress, and sustainable development goals, as well as economic-environmental-social factors of energy efficiency for sustainable development in growing economies, the role of climate policy uncertainty and carbon emissions, and the effect of economic-social-governance factors on the national loading capacity coefficient [33-40].
Fourth, the prediction of carbon emissions from agriculture and animal husbandry: for example, a time-series model is used to predict the carbon emissions from agriculture in order to give Malaysia a better understanding of the agricultural emissions situation and to take immediate measures, and the results showed that the prediction of Malaysia until 2040 showed an upward trend [41]. It used panel data from 31 provinces in China from 2008-2020. As a research object, they used a factor decomposition model to analyze the influencing factors of carbon emissions from animal husbandry from four aspects, namely, environmental technology, economic structure, economic scale, and population scale, and set different scenarios to predict the carbon emissions from China’s animal husbandry industry in 2021-2030 [42]. They used the emission factor method to assess the carbon emissions from agriculture in mainland China from 1993-2021. The results showed that farm operations, as well as livestock manure management, are the main agricultural carbon emission drivers [43]. It used LSTM and GRU to predict the emission trends of manure management to provide alternative policies for GHG emission reduction in Indonesia [44]. It used the guidelines provided by the Intergovernmental Panel on Climate Change (IPCC) in 2006 and developed a particle swarm optimization (PSO) model to calculate and predict six methane emissions in Malaysia [45]. It developed an agricultural carbon emission prediction model based on the RBF (Radial Basis Function) kernel ε-SVR (Support Vector Regression) to predict agricultural carbon emissions and their trends under different scenarios in Henan Province for the period 2021-2025 [46].
From the literature on the influencing factors of agriculture and animal husbandry, it is found that there are numerous influencing factors affecting the carbon emissions of agriculture and animal husbandry, including both the influencing factors of planting and animal husbandry, and the scholars have different indicators of the factors among themselves, which brings difficulties in selecting the indicators for predicting the carbon emissions of agriculture and animal husbandry. Livestock is both an important source of greenhouse gas emissions and a carbon sink through a number of measures. For example, ruminants produce greenhouse gases such as methane during digestion, while land-use changes in livestock production also affect carbon emissions. However, by improving feeding management and promoting the use of renewable energy, the livestock sector can reduce greenhouse gas emissions and contribute to combating climate change. Livestock farming requires a large amount of land for grazing and fodder cultivation. Sustainable animal husbandry requires rational planning of land use and avoidance of overgrazing and indiscriminate cultivation of grasslands in order to protect land resources and prevent soil erosion and land degradation. Livestock production processes, such as animal watering, feed processing, and barn cleaning, require the consumption of large amounts of water resources. At the same time, farm wastewater discharges can pollute water bodies if left untreated. Therefore, sustainability requires the livestock industry to improve water use efficiency, reduce wastewater discharges, and protect the water resources environment. The energy consumption of the livestock industry mainly includes feed production, transport, heating, and cooling of animal houses. Adopting renewable energy and improving energy use efficiency can reduce the impact of animal husbandry on the environment and achieve sustainable energy use.
For the research of carbon emission prediction in agriculture and animal husbandry, the research problems involved are as follows:
First, what are the characteristic indicators of carbon emissions in agriculture and animal husbandry? How are the characteristic indicators screened? Scholars use different characteristic indicators; which should we take as the standard? What method do we use to select them ourselves? The first problem we want to study is how to screen the indicators of influencing factors for predicting carbon emissions in agriculture and animal husbandry.
Secondly, what are the methods for predicting carbon emissions from agriculture and animal husbandry? Previous scholars’ research methods include factor decomposition, the emission factor method, the particle swarm optimization (PSO) model, etc. Can we use other methods for predicting carbon emissions from agriculture and animal husbandry? This is the second question we want to study.
Thirdly, can the models be improved if we introduce machine learning regression-based prediction algorithms into the field of carbon emission prediction in agriculture and animal husbandry? Is it possible to construct a combination model to make the prediction more in line with the requirements of carbon emission prediction in agriculture and animal husbandry? This is the third question we want to study.
Material and Methods
The thesis examines carbon emissions from agriculture and animal husbandry in two parts: first, the carbon emissions caused by planting, and second, the carbon emissions from animal husbandry. Accordingly, the formula for measuring carbon emissions from agriculture and animal husbandry is constructed as follows:
Where E is the total amount of carbon emissions from agriculture and animal husbandry, Ti is the amount of each carbon emission source in the plantation industry; δi is the carbon emission coefficient of each carbon emission source in the plantation industry. Among them, CH4 is the emission of methane, N2O is the emission of nitrous oxide; according to the principle of the heating effect, the conversion factor from methane and nitrous oxide to carbon dioxide is 6.818,2 and 81.272,7, respectively.
Cultivation mainly includes the following carbon sources: pesticides, fertilizers, agricultural films, diesel fuel, tilling, agricultural irrigation, and rice cultivation. Livestock husbandry mainly includes the following carbon sources: cattle, horses, donkeys, mules, camels, sheep, and pigs. The carbon emission factors of different carbon sources are shown in Table 1.
Table 1.
Agricultural and livestock carbon emission factors and reference sources.
One of the paper’s innovations is that the scientific screening of feature indicators can be carried out by calculating the weight value. Among them, the weight value calculation by the TF-IDF algorithm needs to take out the text of the scholars’ articles, use jieba segmentation to slice the words, and then use the TF-IDF (Word Frequency-Inverse Document Frequency) algorithm to get the weight value of the words.
The selected feature indicators are planting productivity, agricultural industrial structure, urbanization level, rural per capita income, population in rural areas, agricultural mechanization level, financial efforts to support agriculture, livestock labor productivity, livestock industrial structure, and large livestock stock. These characteristic indicators can be grouped into three main categories: population size (i.e., the population in rural areas), level of economic development (i.e., plantation productivity, agricultural industry structure, urbanization level, rural per capita income, financial support for agriculture, livestock labor productivity, livestock industry structure, and large livestock stock), and level of scientific and technological progress (i.e., level of agricultural mechanization), which are respectively represented by the letters Z, J, U, N, R, T, C, I, A, S, D, and other symbols. The influencing factors in the characteristic index system and the meaning of their symbols are shown in Table 2.
So far, the paper has completed the construction of the characteristic index system of the influencing factors of agricultural and animal husbandry carbon emissions. In the subsequent empirical stage, these 10 influencing factors can be used as the characteristic indexes of agricultural and animal husbandry carbon emissions prediction and input into the machine learning combinatorial model, which can be used to predict the future carbon emissions of the agricultural and animal husbandry industry in the region.
The Regional Agricultural and Livestock Carbon Emission Forecasting Model (RACEM) is designed to clearly foresee the future carbon emissions and their evolution in the region. The model is committed to providing a quantitative basis and strategic guidance for the sustainable and environmentally friendly growth of the region’s plantation and animal husbandry industries. The influencing factors of carbon emissions in this region are complex and diverse, and the interactions among the characteristic indicators are difficult to grasp accurately. Determining the degree of influence of the independent variables on the dependent variables is also challenging.
This thesis chooses the RF (Random Forest) algorithm in machine learning as the main prediction algorithm in the combined model because RF is an integrated learning algorithm in the class of rags, which is able to deal with very high dimensional data and can effectively run on large datasets; the algorithm introduces stochasticity, which is not easy to be overfitted; the algorithm has a very good resistance to noise, and has little requirement for the normality of the data, even though the for the missing value problem can also obtain good results; the number of hyperparameters of the algorithm is not very large, the training speed is fast, the prediction accuracy is high, and it is widely used in the actual prediction, so the chapter selects the RF algorithm as the main prediction algorithm in the combination model of the regional agricultural and animal husbandry carbon emission prediction.
The dissertation chooses the FA algorithm (factor analysis algorithm) as the feature engineering dimensionality reduction algorithm. The reason is that the FA algorithm can remove the redundant information and extract the most important features to improve the accuracy and generalization ability of the model; the algorithm can deal with multivariate problems and can find the potential influence factors under high-dimensional variables; and the algorithm has a strong adaptive ability, so issues can be dealt with even if there is missing data. Therefore, it is chosen for this chapter. The FA algorithm is the feature engineering dimensionality reduction algorithm in the regional agricultural and animal husbandry carbon emission combination model.
Table 2.
Indicators of agricultural and livestock characteristics and the meaning of symbols.
The thesis chooses the ACO algorithm (Ant Colony Optimization Algorithm) as the optimization algorithm. The reason is to find the optimal hyperparameters for the prediction algorithm RF in the combination model because the ACO algorithm is a bionic algorithm, which has a strong ability to search globally and can be searched in a distributed manner; the ACO algorithm is an essentially parallel algorithm, in which each ant is independent of each other, which increases the reliability of the algorithm; it is a self-organized algorithm, which does not require a high initial route; it has fewer parameters and is easy to set up and implement. As a self-organizing algorithm with low requirements for the initial route, the algorithm has fewer parameters, simple settings, and is easy to program and implement, so the chapter chooses ACO as the hyperparameter optimization algorithm in the regional agricultural and animal husbandry carbon emission portfolio model.
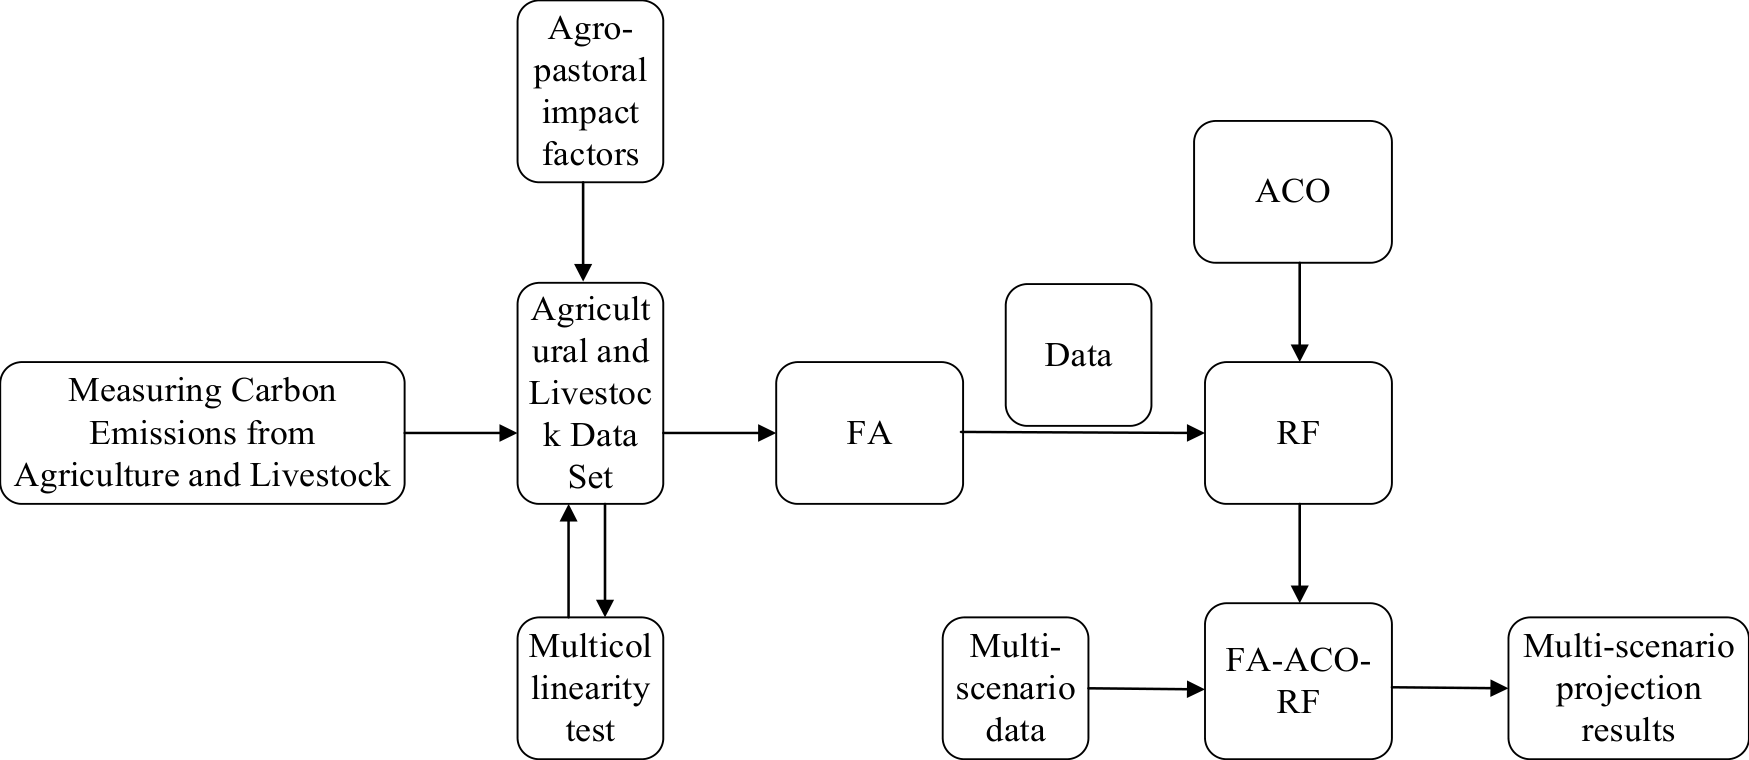
The thesis intends to construct a ternary form machine learning combination model of feature engineering-optimization, an algorithm-machine learning algorithm, where three algorithms, i.e., the FA algorithm, the ACO algorithm, and the RF algorithm, are combined to form the FA-ACO-RF combination model, as shown in Fig. 1.
The prediction process of carbon emissions from agriculture and animal husbandry is as follows: Firstly, the screened influencing factors of agriculture and animal husbandry are used as the feature indicators of the machine learning model. Then, according to the statistical yearbook of the specific region, the historical carbon emissions data will be measured, and the data of each feature indicator will be obtained and calculated as a data set. Then, the machine learning combined model in the form of a feature engineering-optimization algorithm-machine learning algorithm is used to train and validate the carbon emission of the specific agriculture and animal husbandry industry, obtain the optimal parameters of the machine learning combined model, and then predict the carbon emission of the specific future agriculture and animal husbandry industry in the context of baseline, low-carbon, high-carbon, semi-low-carbon, and semi-high-carbon in order to give support to the green, healthy development of this agriculture and animal husbandry industry and to provide the best solution to the problem of carbon emissions.
In the empirical study of carbon emission prediction in agriculture and animal husbandry, the Sichuan Province of China is a province intersected by the Sichuan Basin and grassland on the east side of the Tibetan Plateau, which has both plantation and animal husbandry, and the thesis chooses Sichuan Province for the empirical study of carbon emission prediction in agriculture and animal husbandry.
To evaluate the model performance, Mean Square Error (MSE), Mean Absolute Error (MAE), Root Mean Square Error (RMSE), and Decidability Coefficient R2 are used as the evaluation function of the combined prediction model, and the smaller value indicates that the prediction accuracy is the smaller the value, the higher the prediction accuracy.
The data related to carbon emissions from agriculture and animal husbandry, as well as the data related to the indicator system used in the thesis, are based on the Sichuan Statistical Yearbook and the China Rural Statistical Yearbook from 2000 to 2021. The carbon emission sources in the carbon emissions from agriculture and animal husbandry explored in Table 1 are considered, which are mainly rice cultivation, chemical fertilizers, pesticides, agricultural films, agricultural diesel fuel, plowing, irrigation, cows, horses, donkeys, mules, camels, sheep, swine, and so on. The carbon emission coefficients of each carbon source were calculated using Table 1 reference data. Thus, the stacked histogram of the components of carbon emissions from agriculture and animal husbandry in Sichuan Province each year was obtained, as shown in Fig. 2.
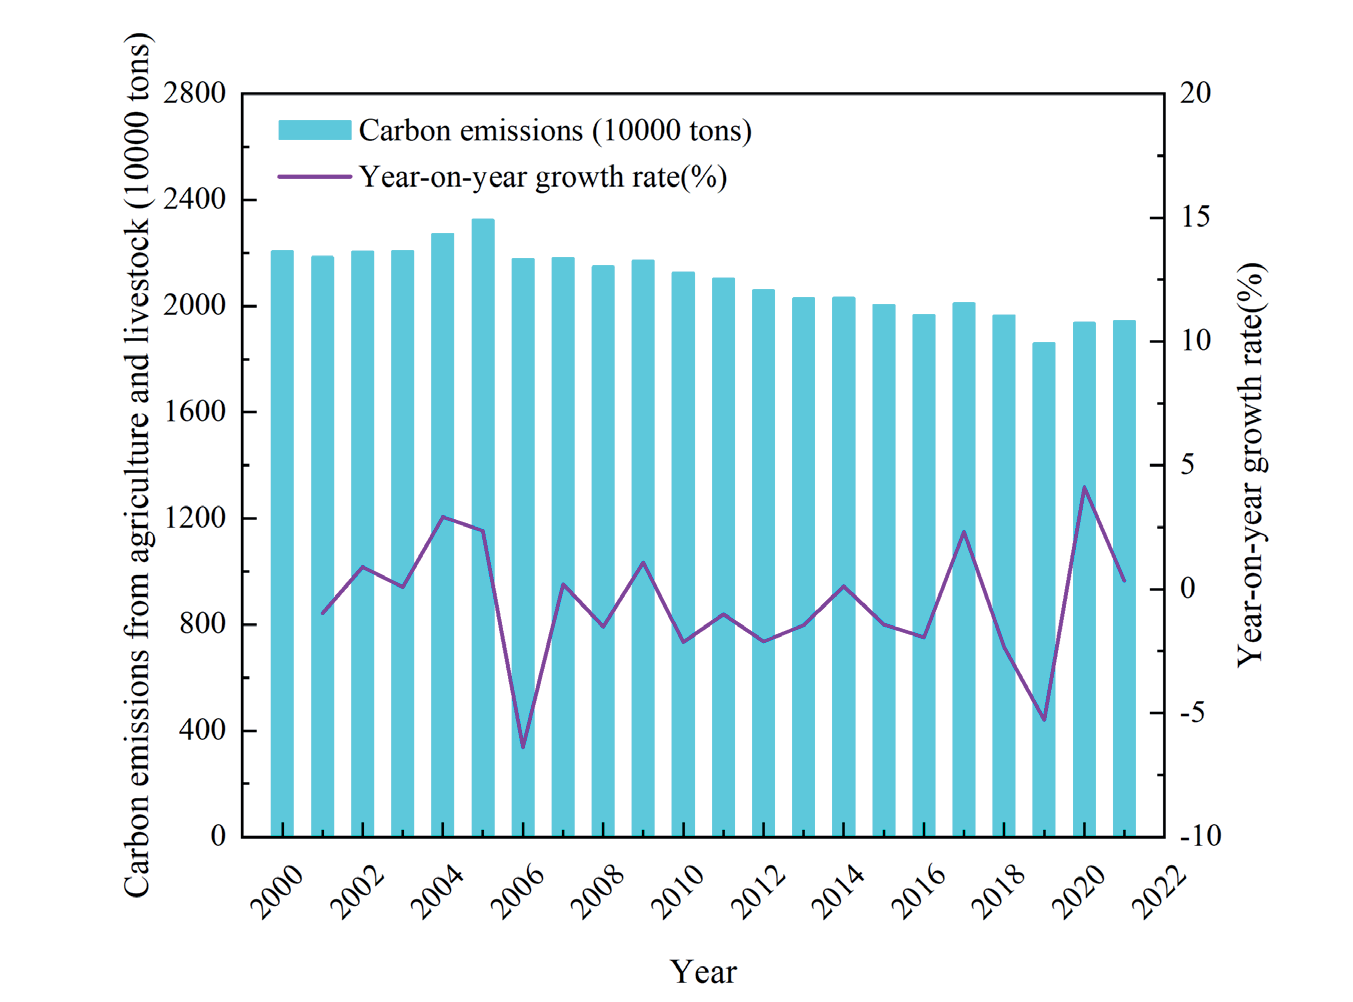
The data on the mixed carbon emissions from vegetation and pasture in Sichuan Province were explored and analyzed to obtain the mixed carbon emissions from vegetation and pasture and the growth rate each year, and the bar charts are shown in Fig. 3.
Fig. 2.
Stacked histograms of components of carbon emissions from agriculture and animal husbandry in Sichuan Province by year.
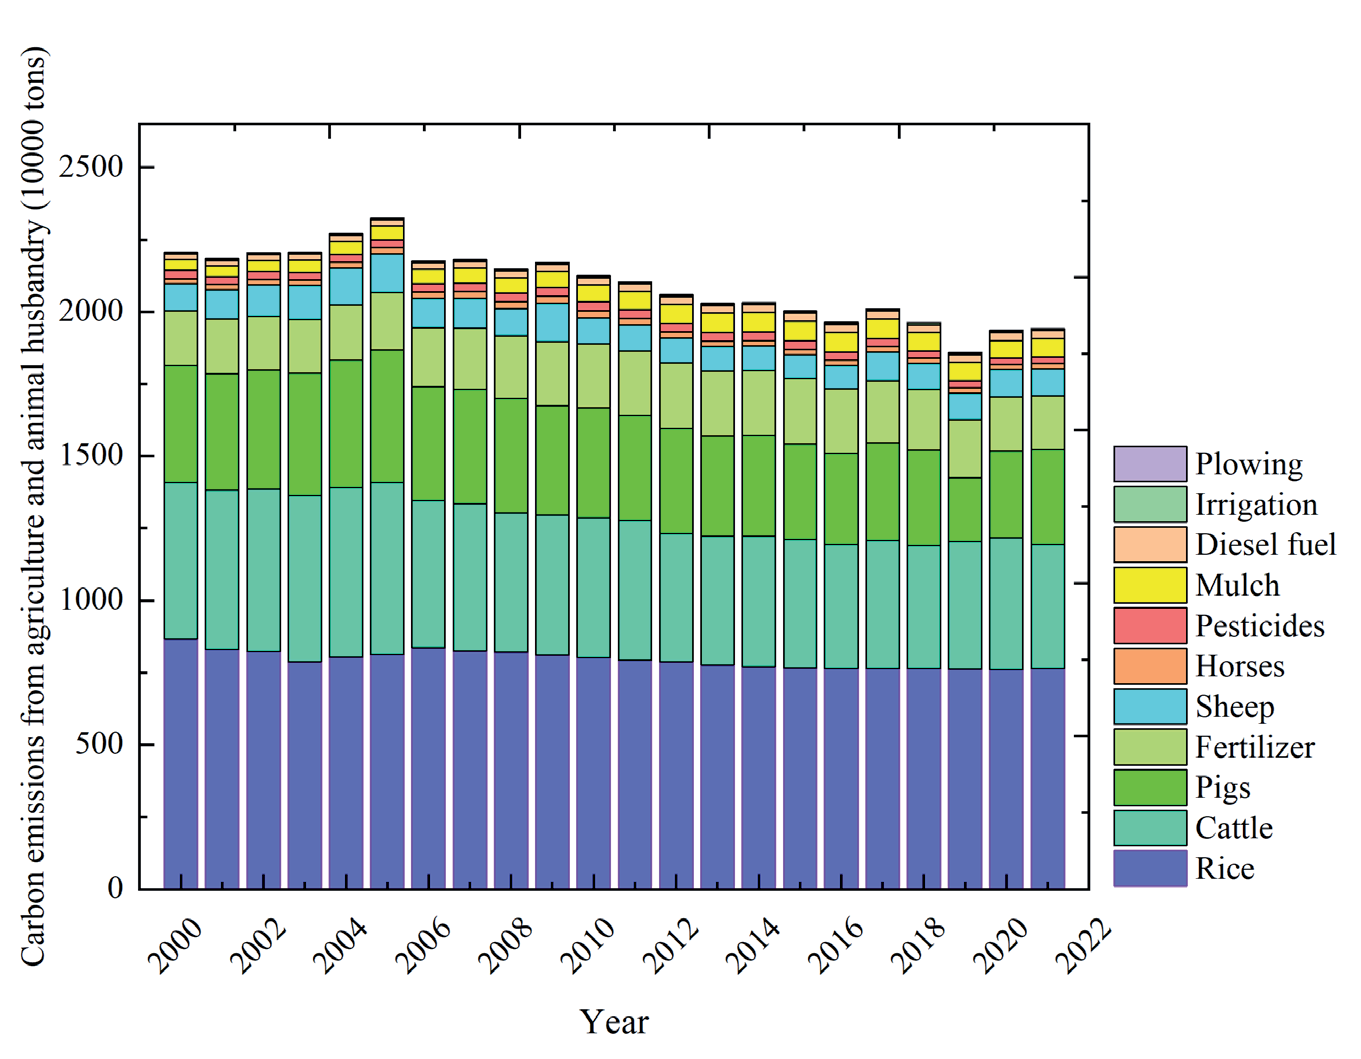
Fig. 3.
Histograms of carbon emissions and growth rates of plant-grazing mixes in Sichuan Province by year.
The intensity and growth rate of carbon emissions from plant and pasture mixtures each year are shown in the bar chart in Fig. 4; here, carbon emission intensity means the number of tons of carbon emissions produced by each increase of 10,000 yuan of gross national product (GDP).
In the following, according to the determined indicators of influencing factors of plantation and animal husbandry mixed carbon emissions, also based on the Sichuan Statistical Yearbook and China Rural Statistical Yearbook, data on influencing factors of agriculture and animal husbandry were obtained, i.e., productivity of the plantation industry, structure of the agricultural industry, level of urbanization, per capita income of rural areas, population of rural areas, level of mechanization of agriculture, financial strength of support to agriculture, labor productivity in animal husbandry, structure of animal husbandry industry and stock of large livestock, and other characteristic indicators. The radar chart of the characteristic indicators is shown in Fig. 5.
After getting the data on the characteristic indicators, the multicollinearity judgment should be carried out. The variance inflation factor VIFi reflects whether there is multicollinearity among the independent variables, so VIFi can measure the severity of multicollinearity. If VIFi≥10, it indicates the existence of multicollinearity between independent variables. Table 3 shows the VIF test results of the Sichuan Province plant and animal husbandry mixed carbon emission index system. It can be seen that most of the indexes’ VIF values are greater than 10, where inf means infinity, which indicates the existence of serious multicollinearity between the indexes.
Due to serious multicollinearity among the indicators, this thesis reduces the 10-dimensional feature indicator system of the original data using the factor analysis (FA) feature dimensionality reduction algorithm. It obtains the new data after dimensionality reduction, which has a 6-dimensional feature indicator.
Results and Discussion
The downscaled feature metrics are combined with the carbon emission labels as the new data and cut into training and validation sets. The constructed FA-ACO-RF is applied for training and validation.
After training and validation, the optimal hyperparameters of this combined model are obtained, as shown in Fig. 6.
The combined model’s prediction accuracy under the optimal hyperparameters for the mixed carbon emissions from vegetation and grazing in Sichuan Province was 99.19%, and the fitting effect between the predicted values and the actual values is shown in Fig. 7.
In order to verify the performance of the combined FA-ACO-RF model, experiments with more models are added, other contrasting models are brought in for comparison, and predictive fitting is performed with the same data. The paper introduces the mainstream algorithms of machine learning and deep learning, including Adaptive Boosting Algorithm (Adaboost), Extreme Random Tree Regression (ETR), Gradient Boosted Decision Tree (GBDT), K Nearest Neighbors Algorithm (KNN), Support Vector Machines Regression (SVR), Decision Tree Regression (DTR), Multi-layer Perceptual Machine (MLP), Long and Short Term Memory Model (LSTM), Recurrent Neural Networks (RNN), Linear Models (LR), Random Forest Algorithm (RF), and so on. Also, Partial Least Squares (PLS) and Principal Component Analysis (PCA) algorithms are used as the benchmark dimensionality reduction algorithms, and the Grid Search (GS) algorithm is used as the benchmark optimization algorithm, respectively. Twenty-two sets of experiments are conducted to compare with the FA-ACO-RF model proposed in the paper.
Fig. 4.
Histograms of carbon emission intensity and growth rate of mixed vegetation and pasture in Sichuan Province by year.
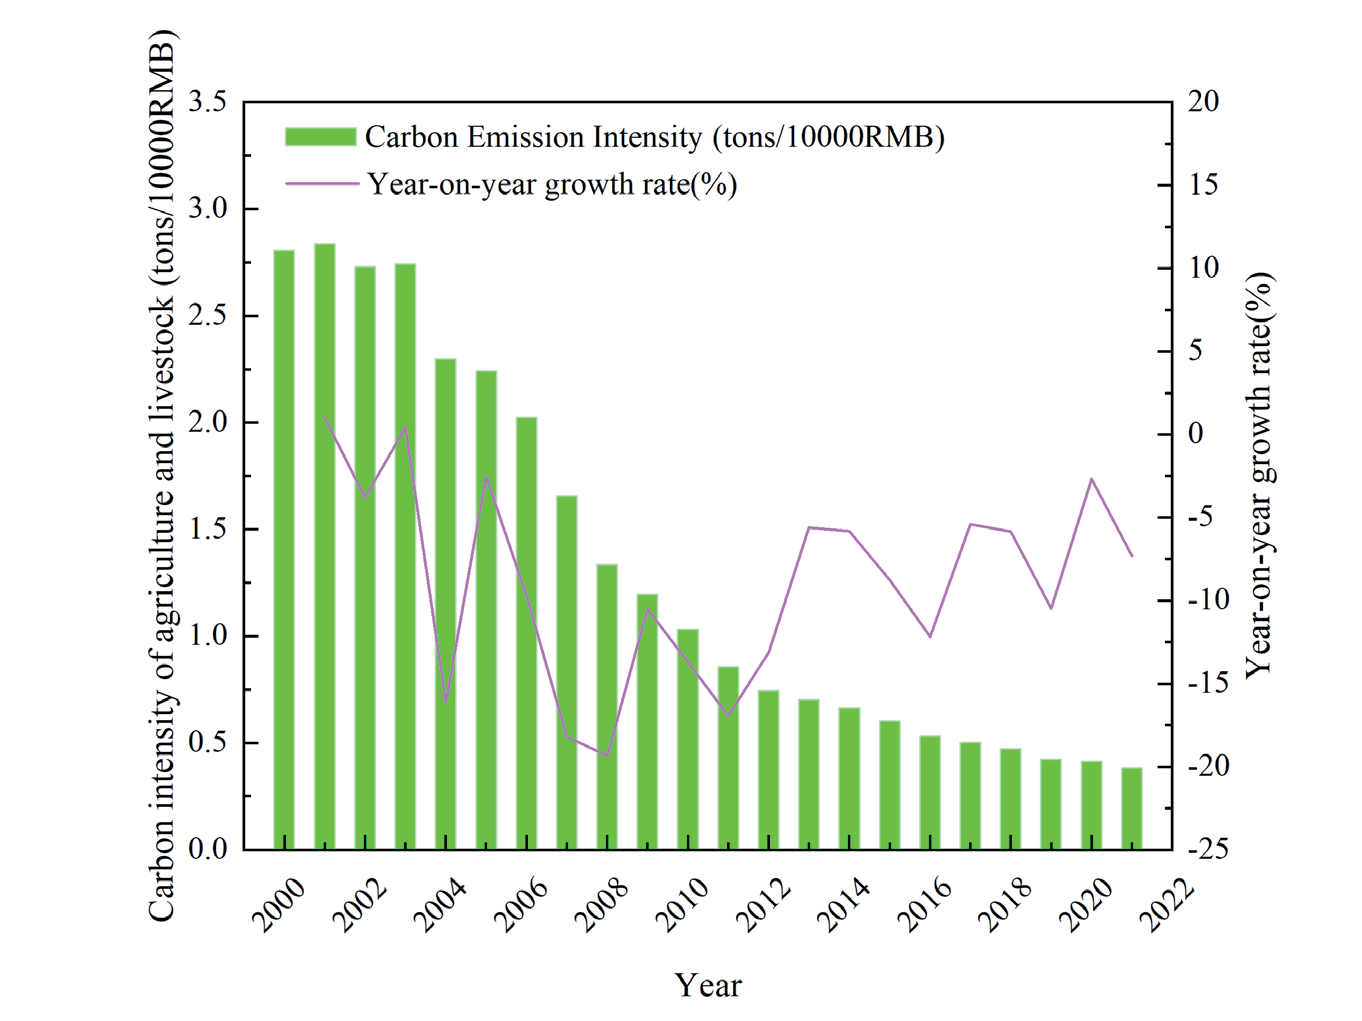
Fig. 5.
Radar diagram of the characteristic indicators of carbon emissions from mixed vegetation and pasture in Sichuan Province.
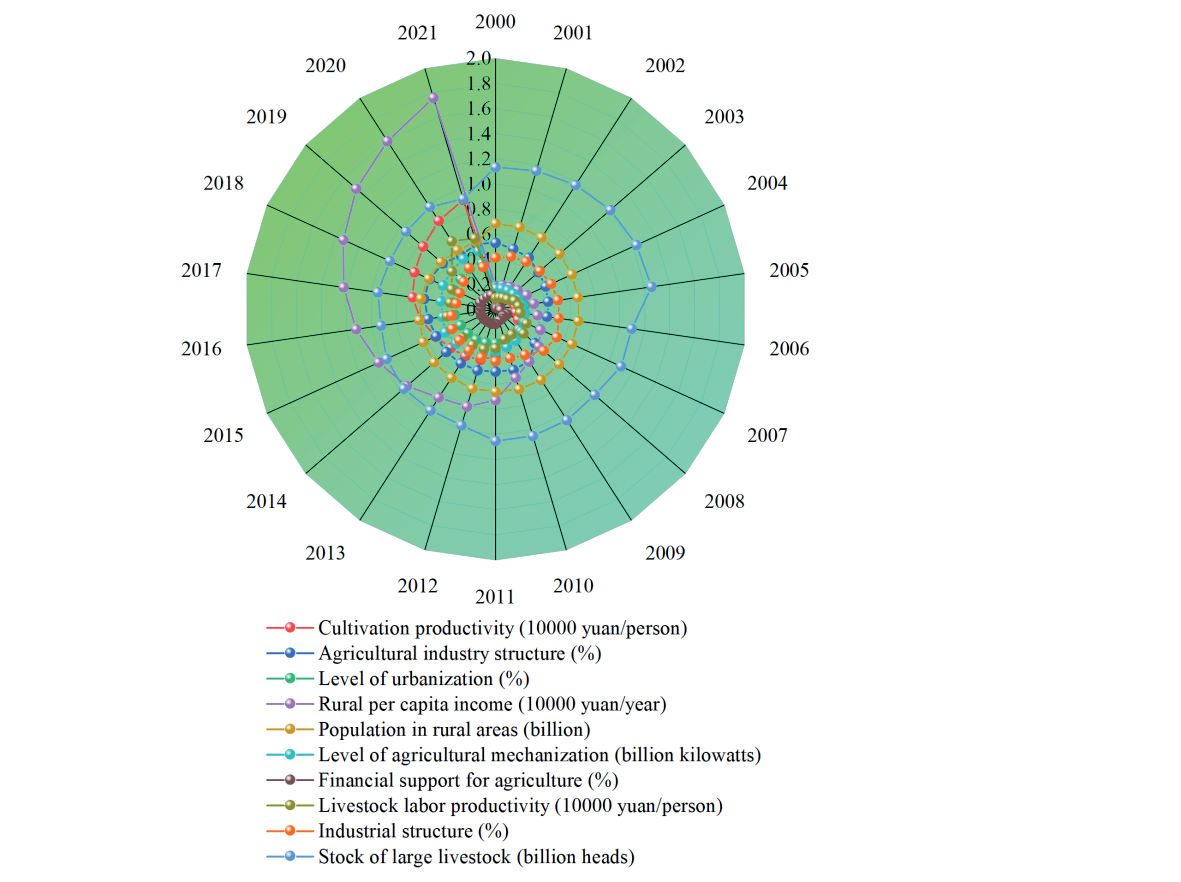
Table 3.
Variance expansion factors among the indicators characterizing carbon emissions from mixed vegetation and pasture in Sichuan Province.

Fig. 7.
Fitting effect between the predicted and actual values of carbon emissions from vegetation and pasture mixes in Sichuan Province.
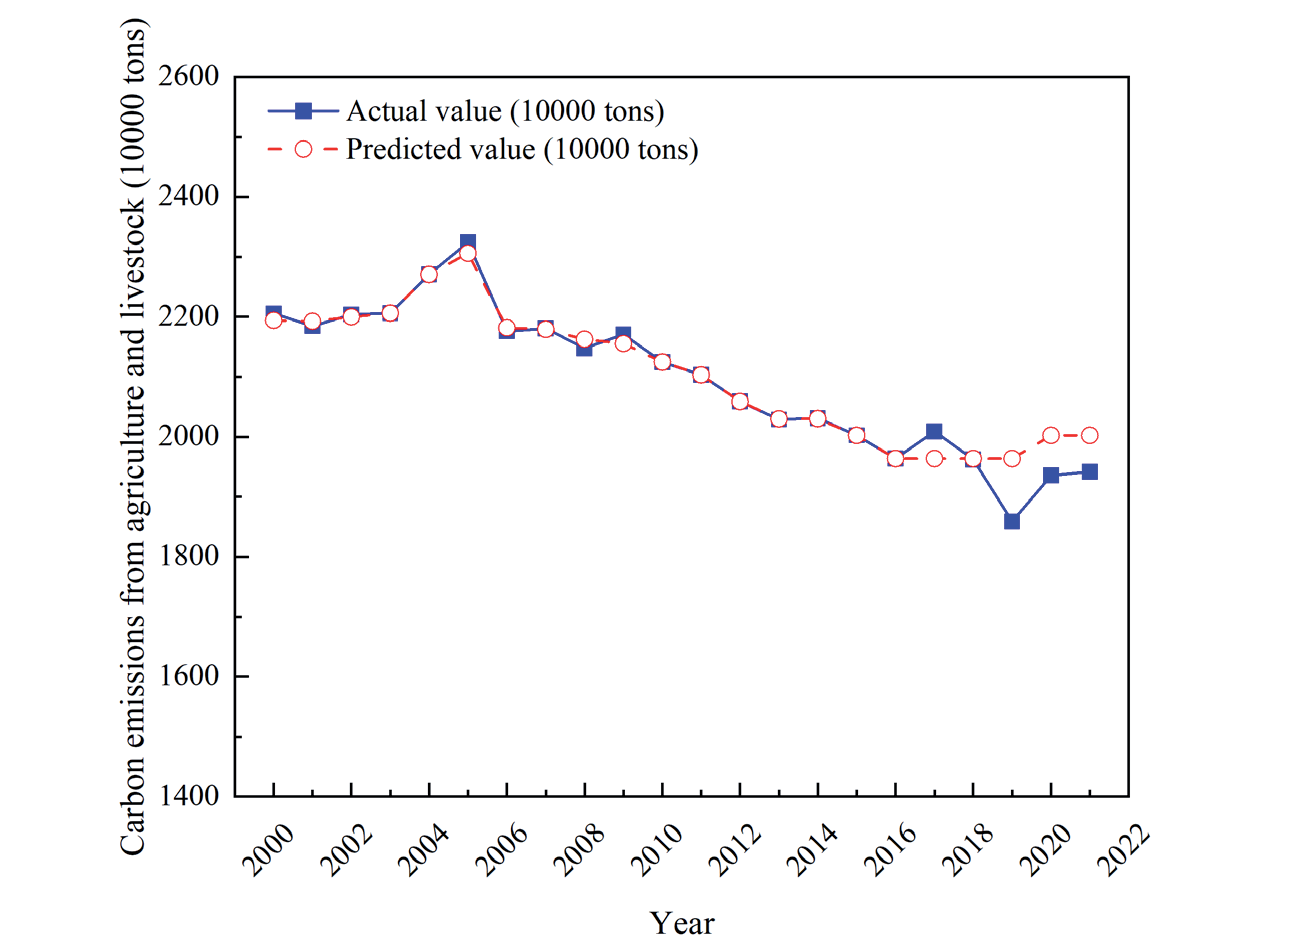
Table 4.
Comparison results of various models for predicting carbon emissions from mixed vegetation and grazing in Sichuan Province.
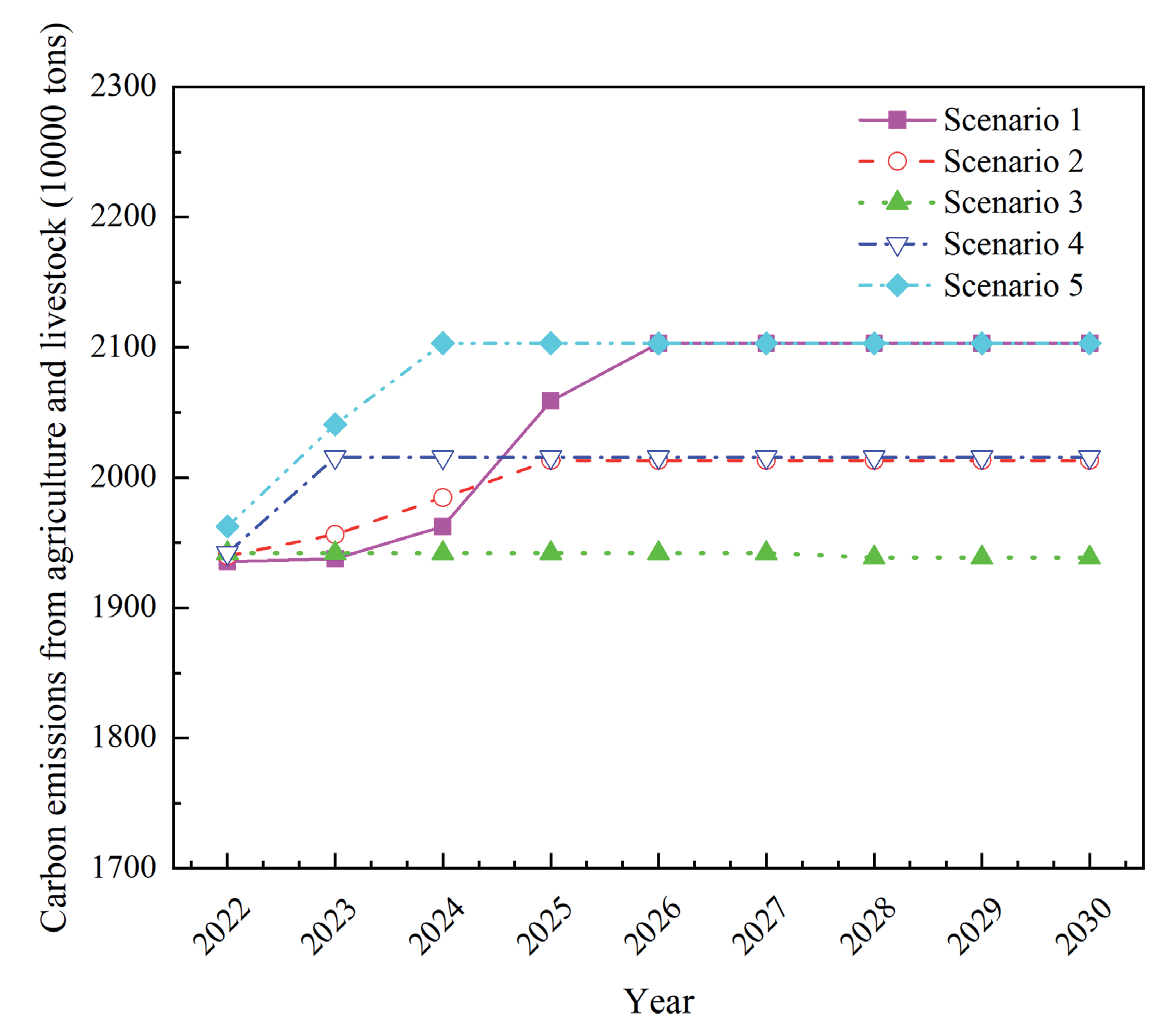
Fig. 8.
Projected carbon emissions from mixed vegetation and grazing in Sichuan Province under five scenarios.
The performance evaluation metrics of each model still use Mean Square Error (MSE), Mean Absolute Error (MAE), Root Mean Square Error (RMSE), and Decidability Coefficient R2 as the evaluation metrics for the comparison between models. The experimental results are shown in Table 4, which indicates that the FA-ACO-RF model proposed in the paper is effective and has excellent model performance.
Scenario Analysis (SA) is an important method commonly used to predict the course of possible events and explore the uncertain future. The paper applies the scenario analysis to predict the carbon emissions of Sichuan Province in 2022-2030 under mixed vegetation and pasture, with the following five scenarios: high carbon (H), baseline (A), low carbon (L), semi-high carbon (S), and semi-low carbon (B), and the indicator system generates five groups of characteristic indicator values in 2022-2030 according to the growth rates of these five scenarios and then puts the five groups of characteristic indicator values into the FA-ACO-RF model to predict the mixed carbon emissions of vegetation and grazing in Sichuan Province from 2022 to 2030 under multiple scenarios.
Under the five scenarios set, the FA-ACO-RF model was used to predict the mixed carbon emissions from vegetation and pasture in Sichuan Province. The results of the five predictions from 2022 to 2030 are shown in Fig. 8.
According to the projected results of the five scenarios set, the plantation and livestock mixed carbon emissions in Sichuan Province in 2030 are expected to fluctuate between 19,387,500 tons and 2015,595,900 tons.
In order to maintain Sichuan’s mixed carbon emissions from planting and animal husbandry at a low level in the future, it should try to develop according to scenarios such as Scenario 2, Scenario 3, and Scenario 4, i.e., develop the planting and animal husbandry while maintaining the baseline or semi-high-carbon indicators of planting productivity, agricultural industrial structure, agricultural machinery power, and labor productivity in animal husbandry, to effectively control the level of mixed carbon emissions from planting and animal husbandry in Sichuan and to promote the green and healthy development of agriculture in Sichuan.
This thesis focuses on the control of carbon emissions while developing plantation and animal husbandry in Sichuan Province, China. It provides the scenario with pathways according to which this should be done, which is important for China to formulate local environmental protection policies while developing plantation and animal husbandry and hopefully is of reference significance for developing plantation and animal husbandry in other parts of the world. Other scholars abroad have also made future recommendations and implementation of policy impacts for specific countries or industries in the context of uncertainty (climate policy, war, climate change, currency, etc.), which is also of reference significance [52, 53].
Conclusions
This chapter focuses on the prediction of regional mixed carbon emissions from plantations and livestock and starts from the following aspects:
Firstly, from the determination of characteristic indexes, the thesis is based on the characteristic indexes of the plantation industry and animal husbandry, and the characteristic indexes for the prediction of mixed plantation and animal husbandry carbon emissions are obtained by combining them, which is theoretically enriched and supplemented by the scientific screening method of characteristic indexes for regional mixed plantation and animal husbandry carbon emissions.
Secondly, from the construction of the prediction model, a triad form of the combined prediction model is given, specifically in the form of a feature engineering-optimization algorithm-machine learning algorithm, which can take into account the multiple covariances of the data of the feature indexes, the demand for the prediction of the plant and pasture mixed carbon emissions. The demand for optimization of the parameter values of the prediction model, and so on. The proposed combined prediction model can theoretically deepen and expand the prediction method of plant and pasture mixed carbon emissions.
Thirdly, the empirical research is conducted on the prediction of carbon emissions from mixed vegetation and pasture in specific regions. The provinces and regions in the north and the south are selected as representatives for the research, including Liaoning Province in the north and Sichuan Province in the south, which are typical provinces of mixed vegetation and pasture and are both very representative. The empirical results show that the accuracy of the scientific screening method of the regional mixed vegetation and pasture carbon emission characteristic indicators proposed in this chapter and the FA-ACO-RF combined prediction model proposed in this chapter, after the empirical demonstration of Liaoning and Sichuan Provinces, respectively, reached 99.00% and 99.19%, which indicates that the method proposed in the thesis is effective.
In conclusion, this chapter focuses on the prediction of carbon emissions from regional plantation and animal husbandry and research in theory and application, expecting that the methods given in the dissertation can inspire those regions that hope to develop the plantation and animal husbandry economy and at the same time hope to control carbon emissions from plantation and animal husbandry and give scientific guidance to the management decision of regional plantation and animal husbandry on future development planning and then promote the sustainable development of the local plantation and animal husbandry industry. In this way, the sustainable development of local plantations and animal husbandry will be promoted.
This thesis does not carry out a more in-depth study on determining the influence factor indicators of plantation and animal husbandry, such as the method of determining the influence factor based on the weight value given in this paper. This paper is based on previous research, and in the future, we can try to obtain the influence factor indicators and their weight values without relying on previous research, relying on the natural language processing technology only by extracting keywords or sentiment analysis.

