

Introduction
The Yangtze River Economic Belt spans 11 provinces in China, covering approximately 21% of the country’s land area. In the first half of 2023, it contributed 46.8% to China’s GDP and is a key region supporting economic development and ecological civilization construction [1]. Its uniqueness lies not only in its east-west orientation, connecting north-south and linking rivers to seas geographically, but also in its economic contributions to manufacturing, waterway transportation, and trade circulation, among others [2]. Additionally, it is an important ecosystem for China and even the world, making significant contributions to global biodiversity. By 2021, 97.1% of the water sections in the Yangtze River Basin met high-quality standards, and the water quality of the mainstream and major tributaries had reached excellent levels. Uncoordinated ecological protection, however, continues to be a barrier to the green and superior development of businesses in the basin, even in the face of these advancements. The Yangtze River Belt’s distinct geographic location and riverbank configuration make the preservation and use of environmental resources crucial elements of green development research, with substantial research value [3].
Studying the Yangtze River Economic Belt provides substantive research value for understanding how large-scale ecologically related areas balance economic development with ecological management. For other countries and regions facing similar challenges, such as industrialization, urbanization, environmental degradation, etc., The Yangtze River Economic Belt can offer valuable theoretical and practical references.
This region combines ecological protection with economic development, demonstrating how policies like environmental information disclosure can be used to overcome issues like pollution and excessive resource use while still promoting economic growth. Furthermore, using corporate environmental disclosure as a governance tool offers a potential reference model for addressing information asymmetry behaviors hindering the effective implementation of environmental policies. This approach not only helps align corporate behavior with national environmental goals but also provides a transparent mechanism allowing stakeholders, including public investors, to participate in supervising and encouraging green practices.
In this context, the development experience of the Yangtze River Economic Belt can inspire other countries or regions to adopt similar strategies, especially those countries or regions seeking to transition towards a greener, low-carbon economy while facing pressure for industrial growth. By learning from the practices of the Yangtze River Economic Belt in combining environmental regulation, corporate responsibility, and market incentives, other regions can effectively address the tension between development and protection.
Because the basin’s businesses are the main producers of pollution, they are essential to the execution of environmental governance policies, which are necessary to promote sustainable, high-quality, and low-carbon growth along the Yangtze River Economic Belt [4]. Environmental information disclosure is considered a crucial measure for promoting ecological and economic development. When it comes to solving new problems, traditional formal environmental regulation approaches frequently fall short. This is mainly because they are unable to deal with the problem of knowledge asymmetry, which can cause environmental policy implementation to be distorted. Corporate environmental information disclosure provides a way to address these governance issues in this particular situation.
In China’s green development plan, China has strengthened its commitment to the sustainable development of the ecological environment, and the government’s requirements for enterprise environmental information disclosure are increasing. Since the beginning of the 21st century, China has entered a stage of comprehensive environmental governance, with the government issuing relevant policy documents from various aspects to carry out environmental work. In particular, in China’s “14th Five-Year Plan” (2021-2025), a more comprehensive green development strategy was introduced, emphasizing the importance of achieving carbon peak and carbon neutrality goals. Table 1 shows some relevant environmental policies in China since the early 21st century. From a regulatory perspective on enterprises, Chinese government requirements for environmental information disclosure by enterprises have also increased, along with China’s emphasis on environmental issues. In 2003, the Ministry of Environmental Protection issued an “Announcement on Enterprise Environmental Information Disclosure”, which was China’s first policy related to environmental information disclosure, requiring heavily polluting companies to disclose relevant pollution information. The 2007 “Measures on Environmental Information Disclosure (Trial)” first introduced the requirement to enhance corporate environmental information disclosure [5]. Subsequently, the 2021 “Measures on the Lawful Disclosure of Environmental Information by Enterprises” mandated that corporations proactively disclose their compliance with relevant laws and pollution control efforts. This is essential for reinforcing corporate environmental responsibility, fostering market protection mechanisms, encouraging public participation, and building a framework for green and high-quality development [6]. In 2024, the Ministry of Finance issued the “Guidelines for Sustainable Corporate Disclosure - Basic Guidelines (Draft for Solicitation Opinions)”, marking the beginning of the construction of China’s sustainable disclosure system. Table 2 shows some policy and legal documents related to enterprise environmental information disclosure in China.
The concept of sustainable development, recognized globally as a core guiding principle for socio-economic development, has gained widespread acceptance [7]. Green innovation, a critical component of sustainable development, involves the creation or significant improvement of products, processes, organizational structures, and institutional arrangements by enterprises. This innovation not only creates value for businesses but also reduces their environmental impact. Green innovation is a vital reaction to environmental rules imposed by the government and a vital means by which businesses can attain sustainable development.
Table 1.
Policies related to environmental improvement in China.
Table 2.
Policies related to enterprise environmental information disclosure in China.
According to independent net effect studies on corporate environmental data release and green innovation, significant advancements have been made in the field of green development. Previous studies on the sharing of environmental information have mostly concentrated on management reasons for disclosure [8, 9], the content composition of such disclosures [10, 11], and how the quality of environmental information disclosure enhances corporate value and economic performance [12-14]. Concurrently, studies on corporate green innovation have concentrated on strategic choices [15], external institutional influences [16, 17], and environmental performance evaluations [18]. These studies have not only enriched the theoretical framework of sustainable development but also provided valuable guidance for corporate practices.
Nevertheless, the processes via which corporate environmental information disclosure affects green innovation have not been thoroughly studied in any of the previous studies. The majority of research ignores the connection between corporate environmental performance and green innovation, treating them as separate variables affecting corporate environmental performance. Moreover, systematic analyses of corporate behavior and green innovation mechanisms in key environmental governance regions remain insufficient. There is currently a dearth of studies on green innovation at the micro-enterprise level, with most studies on green innovation in the Yangtze River Belt concentrating on how effective it is at the provincial and municipal levels. How does corporate environmental information disclosure influence green innovation? How does this influence manifest under varying external pressures? Are there differential impacts among enterprises? It is imperative that these questions be addressed in order to encourage Yangtze River Economic Belt businesses to engage in high-quality green development.
In order to quantitatively assess the influence of corporate environmental information disclosure on green innovation, this study uses a sample of publicly traded companies from the provinces along the Yangtze River Economic Belt from 2008 to 2022. It concentrates on the moderating effect of financing constraints. The following are this paper’s possible marginal contributions: First, in terms of empirical research contributions, this study focuses on the Yangtze River Economic Belt, a key region for China’s green development initiative. While previous studies mainly concentrated on broader national or provincial backgrounds, this study offers a detailed micro-level analysis of crucial environmental governance areas within the region. Exploring companies along different sections of the Yangtze River in detail allows for a deeper understanding of how geographical and resource conditions influence the impact of environmental disclosure on green innovation. Second, in terms of theoretical contributions to research, previous studies focused either on environmental disclosure or green innovation when it comes to green sustainable development. However, this article provides new insights into the intrinsic relationship between the two and demonstrates how financing constraints as external pressures for corporate development can amplify this promotion effect. This study not only expands the theoretical framework on corporate green behavior in existing literature but also enriches our understanding of how external pressures, such as financing constraints, shape corporate environmental behavior. Additionally, this study can provide theoretical references for regions or countries facing similar challenges with coordinating ecological environments and economic development. Furthermore, regarding constructing an indicator system for corporate environmental information disclosure, existing research lacks precise, comprehensive consideration by incorporating qualitative indicators related to enterprise information disclosure as part of measurement indicators. This article combines qualitative and quantitative information related to environmental information disclosure from Chinese companies to construct an indicator system that enhances evaluation criteria. Lastly, in terms of policy implications contribution, through investigating heterogeneity in company responses to environmental disclosure requirements and threshold effects from financing constraints, differentiated policy recommendations are proposed based on sample characteristics. Particularly focusing on unique classifications according to watershed resource dependency among enterprises and analyzing how practices differ between watershed-dependent and non-watershed-dependent companies regarding their impact on green innovation through their environmental disclosure practices. This heterogeneity analysis emphasizes policy impacts differently across various types of enterprises, providing actionable insights for policymakers seeking optimized environmental regulations while adding new dimensions to existing literature.
Theoretical Examination and Formulation of Hypotheses
Corporate Environmental Information Disclosure and Corporate Green Innovation
As primary participants in economic activities, companies’ environmental behaviors have garnered increasing attention from various sectors of society [19]. Environmental information disclosure is becoming a crucial part of public business information due to the development and strengthening of institutional frameworks for environmental governance. In essence, corporate environmental information disclosure involves making public the company’s practices related to environmental protection, resource utilization, and pollution emissions to the public, investors, government, and other stakeholders [20]. This information not only includes internal governance details, such as environmental policies, management systems, and environmental protection investments but also addresses the actual environmental impacts of the company’s operations and the measures taken in response [21]. Through environmental information disclosure, companies can demonstrate their environmental responsibility and sustainability, thereby strengthening trust with various societal stakeholders.
The academic community still needs to provide a precise definition for the term “Corporate Green Innovation”. Initially proposed by scholars Braun and others, it broadly refers to technologies that reduce energy consumption, decrease environmental pollution, and enhance production efficiency [22]. It can also refer to the incorporation of environmental principles into various aspects of a company’s operations, including product development, production processes, and marketing strategies, through the adoption of new technologies and methods aimed at reducing resource consumption, minimizing environmental pollution, and improving the environmental performance of products [23]. Green innovation is not only a necessary response to the pressures of environmental regulations [24, 25] and a means to mitigate external risks [26], but also a vital route for companies to accomplish modernization and transformation [27] and enhance competitiveness [28]. As consumer demand for environmentally friendly products increases [29] and global green supply chains are established [30], green innovation has gradually become a crucial component of corporate core competitiveness.
From the perspective of stakeholder theory, which encompasses both the internal and external environments of a company, companies should take into account and satisfy the varied demands and expectations of different stakeholders. Disclosure of environmental information serves as a conduit for informing stakeholders about a company’s environmental performance and commitments. It not only enhances the transparency of the information conveyed but also builds greater trust and confidence among stakeholders. Consequently, this fosters a climate both inside and outside the organization that is conducive to green innovation [31]. The trust brought to enterprises by this information will drive them to actively meet the expectations of stakeholders, motivating them to adopt green innovative practices in production, processes, and management to better address environmental risks. On the one hand, disclosing information can increase constraints on enterprises from stakeholders, helping to avoid adverse selection and moral risks [32]. On the other hand, it also ensures that stakeholders represented by investors can access effective environmental information and exercise their supervisory rights, guaranteeing a certain level of investment in green technology by enterprises and promoting green innovation.
From the perspective of resource-based theory, based on the enterprise itself, its competitive advantage in development comes from its unique and difficult-to-imitate resources and capabilities. Green innovation capability, as a limited and valuable strategic resource, can bring sustainable competitive advantages to enterprises and bring green innovation anxiety to the same industry [33]. Environmental information disclosure, as a mechanism for displaying resources and transmitting signals, helps enterprises demonstrate their unique resources and capabilities in green innovation to the outside world, thereby attracting potential partners, investors, and consumers, further promoting the accumulation and optimal allocation of green innovation resources [34]. Among investors, financial institutions, and other decision-makers, companies with improved information disclosure are more likely to obtain financing, policy support, and other collaborative resources. These all provide necessary conditions for green innovation in companies. High-quality environmental information disclosure reflects the maturity of companies in management and informatization, making it easier for them to obtain external resources to support green innovation. The disclosure of environmental information is not only a manifestation of corporate social responsibility but also an accumulation of advantages in resource competition [35].
From the viewpoint of the external environment, the influence of legal frameworks, social conventions, and regulations on company behavior is emphasized by institutional theory. Environmental information disclosure is viewed as an institutionalized practice through which companies comply with environmental regulations and respond to societal expectations. Under institutional pressure, companies often boost their spending on environmentally friendly technologies to maintain legitimacy and avoid potential regulatory penalties, thereby meeting increasingly stringent environmental standards and social responsibility requirements [36]. Porter’s hypothesis also suggests that appropriate environmental regulations can promote technological innovation in enterprises and reduce production costs through more research and development of new products and processes, thereby increasing profitability and competitiveness [37]. Under the increasing emphasis on environmental issues in China and heightened regulatory pressures on key ecological areas such as the Yangtze River Economic Belt, enterprises are inclined to invest more in green technologies to gain legitimacy and competitive advantage. Through innovation, they aim to lower compliance costs. Institutional pressures prompt strategic adjustments, driving firms to pursue green innovation to align with new regulatory standards and avoid penalties or reputational damage. Consequently, environmental information disclosure, which is an outcome of institutional pressure, serves as a driver for green innovation in enterprises.
In summary, the facilitative relationship between these two factors is supported by multiple theoretical frameworks. These theories not only reveal the intrinsic connections and interaction mechanisms between them but also provide valuable insights and guidance on how companies can drive green innovation through environmental information disclosure. In light of this, the following study hypothesis is put forth:
H1: The degree of environmental information disclosure by corporations and corporate green innovation are positively correlated.
Moderating Role of Financing Constraints
Financial restrictions play a vital part as a critical variable when examining the connection between business green innovation and disclosure of environmental data. Financing constraints refer to the obstacles or limitations encountered by firms in raising external funds. These constraints can arise from a variety of factors, including information asymmetry, company size and credit status, market and economic conditions, internal capital shortages, high financing costs, and risk aversion tendencies [38]. Financing constraints not only limit a firm’s ability to access funds, such as high financing costs, limited financing channels, and stringent financing conditions, but also profoundly impact its investment decisions, innovation activities, and overall competitiveness.
Theoretically, financial constraints aid in establishing the link between green innovation and corporate environmental information sharing. Firstly, firms facing severe financing constraints struggle to secure sufficient external funds for technological upgrades and project research and development, which limits their innovation capabilities. Such firms are compelled to seek ways to enhance information transparency to mitigate information asymmetry, thereby gaining trust and attracting external financing. In this context, environmental information disclosure becomes a key means of signaling green development to the external market and showcasing their efforts and achievements in environmental management [39]. By publicly disclosing more detailed environmental information, firms transform internally privatized information about environmental performance into public information, reducing the uncertainty in external stakeholders’ evaluations of the firm’s development. By doing this, they gain the confidence of outside investors and financial intermediaries, which reduces financial obstacles and enables them to support their green innovation projects financially. [40].
Secondly, financing constraints compel firms to make strategic choices under conditions of limited resources [41]. Firms facing high levels of financing constraints must carefully allocate their limited financial resources to worthwhile projects. According to institutional theory, green and sustainable development is an institutionalized behavior that aligns with policy requirements and societal expectations. Under such external institutional pressures, green innovation projects, which align with future market trends and policy requirements for sustainable and green development, often become the priority for firms. Environmental information disclosure helps companies become more competitive in the market and policy arenas by providing a platform for showcasing their green innovation capabilities and obtaining external resources [42]. The growing preference of investors and financial intermediaries for companies that follow sustainable and green development principles makes disclosure of environmental information a crucial tool for companies to get green finance, regulatory incentives, and market opportunities [43].
Therefore, financial limitations act as a beneficial moderator in the relationship between green innovation and environmental information sharing. On the one hand, high financing constraints compel firms to enhance information transparency, improve credit ratings, and attract external financing through environmental information disclosure. On the other hand, enterprises that disclose environmental information must devote a greater share of their limited resources to green innovation assistance. This allocation provides firms with additional market opportunities and competitive advantages in their industry. Thus, severe financing constraints do not merely act as a barrier to firm development; rather, under certain conditions, they become a significant external driving force for promoting green innovation. In light of this, the following study hypothesis is put forth:
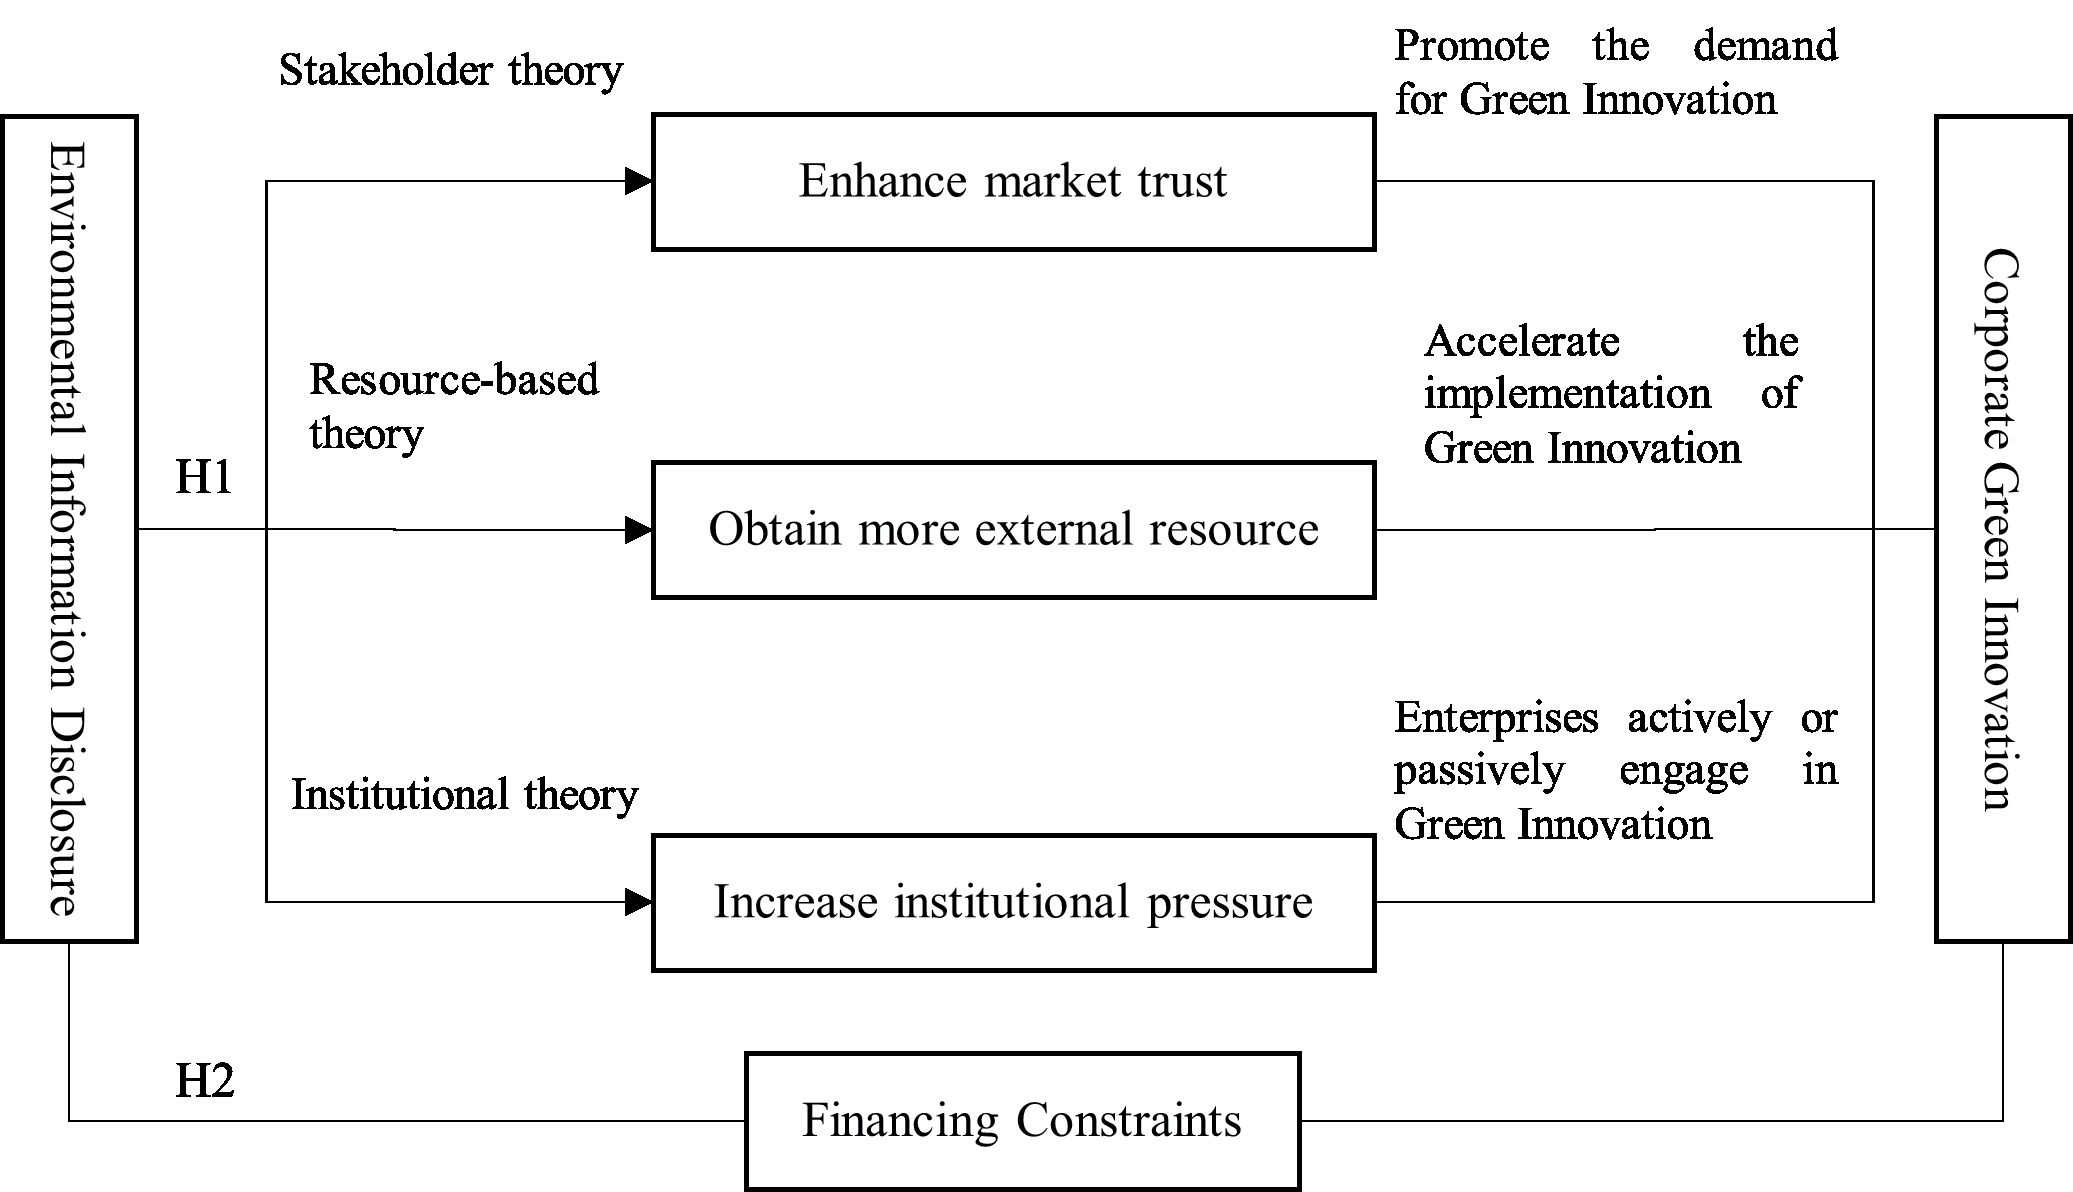
H2: Financial limitations positively moderate the association between green innovation and environmental information sharing. The impact of environmental information disclosure on green innovation is greater when there are significant financial limitations.
Fig. 1 shows the theoretical analysis framework of this article.
Materials and Methods
Sample Selection and Data Sources
The sample for this study consists of listed companies from the Shanghai and Shenzhen stock exchanges that are located in the 11 provinces that make up the Yangtze River Economic Belt between 2008 and 2022. The financial and environmental disclosure statistics of corporations are obtained from CNINFO’s published annual reports and the CSMAR database. Green innovation indicators are obtained from the green patent database of CNRDS. The absolute value of the SA index serves as a moderating element that measures financing constraints. The initial data undergo the following processing steps: (1) Exclude ST, *ST, financial companies, and firms with only one year of data. (2) Remove data with missing variables for certain years. (3) Apply a 1% winsorization to continuous variables. The final dataset consists of 20,087 firm-year observations, which are processed and analyzed using Stata 17.
Variable Definition
Dependent Variable
Corporate green innovation is the study’s dependent variable. Corporate innovation activities can be categorized based on their motivations into substantive innovation and strategic innovation. Utility model patents, reflecting an enterprise’s strategic direction in innovation, represent the “quantity” aspect of innovation activities. In contrast, invention patents, characterized by greater proprietary rights, represent the “quality” aspect of innovation activities. Following the approach of previous scholars [44, 45], the number of green patents is used as a measure for the dependent variable. This is specifically computed as the logarithm of the total number of patent applications for green inventions plus patent applications for green utility models plus one, denoted as LnGreen. The CNRDS database on corporate green patent applications provided the green patent data used in this investigation.
Explanatory Variable
The explanatory variable in this study is corporation environmental information disclosure. The mainstream method for measuring corporate environmental information disclosure in current research is content analysis. Utilizing previously conducted research to create indicators for the disclosure of company environmental information [46] and considering the specific context of China, corporate environmental information disclosure is evaluated based on seven dimensions, including environmental management disclosure, environmental performance, and governance disclosure. The specific dimensions, descriptions, and scoring guidelines are detailed in Table 3. The final score for corporate environmental information disclosure (Eid) is obtained by summing the scores for each dimension and taking the logarithm of the sum plus one.
Moderating and Threshold Variables
The moderating variable is the corporate financing constraint. Commonly used indicators to measure financing constraints include the SA index [47], the KZ index, and the WW index [48]. This study employs the SA index to assess the degree of financing constraints faced by firms. The calculation formula for the SA index is: SA=-0.737×Size+0.043×Size2-0.04×Age. Since the result of the SA index calculation can be negative, the SA index’s absolute value is used in this investigation. A larger absolute value indicates a higher degree of financing constraint experienced by the firm [49]. Compared to other financing constraint indices, the reason for choosing the SA index as a measure of financing constraints is that the calculation of the SA index involves firm size and firm age without involving variables with endogeneity characteristics. It has strong exogeneity, which can reduce the endogeneity and subjective selectivity generated during the calculation of financing constraints, ensuring maximum reliability and accuracy of results. The SA index is relatively robust.
Model Building
To test the main hypothesis H1, this study constructs Model (1). Furthermore, Model (2) is built in order to confirm the moderating influence of financial limitations as suggested in hypothesis H2. The constructed models are illustrated as follows in (1) and (2).
(2)
Table 3.
Scoring table of corporate environmental information disclosure indicator dimensions.
In the models, LnGreeni,t is the dependent variable, representing the amount of green innovation of firm i in year t; Eidi,t is the explanatory variable, representing the environmental information disclosure index of firm i in year t; SAi,t represents the financing constraint index of firm i in year t; Controlsi,t denotes a set of control variables for firm i in year t; ∑Yeari,t captures time fixed effects; ∑Indi,t captures industry fixed effects; ∑Provincei,t captures provincial fixed effects; εi,t represents the random error term.
Results and Discussion
Descriptive Statistics and Correlation Analysis
The descriptive statistics for the primary variables are shown in Table 5. The mean value of corporate green innovation (LnGreen) is 0.481. The sample data for corporate green innovation has a standard deviation of 0.842, a maximum value of 5.591, and a lowest value of 0. The Yangtze River Economic Belt provinces’ listed manufacturing enterprises exhibit relatively little variety in corporate green innovation, as indicated by the standard deviation of less than 1.
Table 4.
Descriptive table of main variables.
Table 5.
Descriptive statistics.
The business environmental information disclosure index (Eid) has a median value of 2.197 and a mean value of 2.267. 3.970 is the largest value, and 0 is the minimum. More than half of the firms appear to have environmental information disclosure scores below average, as indicated by the fact that the mean is higher than the median.
The correlation coefficients and significance levels between the primary variables are displayed in Table 6. Preliminary evidence supporting the primary hypothesis (H1) indicates that disclosure of environmental information has a favorable impact on business green innovation. Table 6 also includes the results of the collinearity diagnostics, with an average Variance Inflation Factor (VIF) value of 1.23. Since all VIF values are well below 10, there is no significant multicollinearity issue, allowing for valid regression analysis.
Regression Analysis
To test the main hypothesis H1 regarding the relationship between corporate environmental information disclosure and corporate green innovation, as well as the moderating effect of financing constraints as proposed in hypothesis H2, regression analyses were conducted on the models. Tables 7 and 8 present the findings.
The results of Columns (2), (3), and (4) in Table 7 are regression results without fixed year, industry, and province effects. Column (5) shows the results with fixed year, industry, and province effects. After controlling for these effects, the coefficient between Eid and LnGreen is 0.018 and significant at the 10% level. Even after adding various control variables, the coefficient of Eid remains significant, indicating an improvement in model fit as control variables are gradually added. The results consistently show a significant positive correlation between corporate environmental information disclosure and green innovation activities; the more comprehensive the environmental information disclosure is, the more green innovation activities a company engages in, consistent with the main hypothesis H1. This positive relationship may be due to increased transparency from disclosing environmental information and strengthening trust with stakeholders, which helps companies obtain external resources and policy support to enhance motivation for green innovation activities. Control variables show that firm size has a significantly positive effect on green innovation across all regression results. This aligns with resource-based theory, which suggests that larger companies often have stronger capabilities for resource integration to invest in high-cost, long-term green innovation projects. Additionally, large-scale companies tend to engage in green innovation for reputation maintenance purposes.
Table 8 shows the results of the regulatory effect regression. Columns (1) to (3) show the regression results without controlling for year, industry, and provincial effects, while Column (4) shows the results with fixed year, industry, and provincial effects. From Column (4) of Table 8, it can be seen that the coefficient of interaction between corporate environmental disclosure and regulatory variables on financing constraints is 0.132 and significantly positive. This finding suggests that finance-related restrictions have a beneficial moderating effect on how environmental information sharing affects green innovation. Specifically, when firms face higher financing pressures, disclosure of environmental information has a greater impact on green innovation. Conversely, when financing constraints are less severe, the facilitating effect is less pronounced. That is to say, in financially constrained companies, environmental disclosure behavior can better stimulate a company’s green motivation. According to resource dependence theory, when companies face financing constraints and operate in an external environment that values green development, they are more inclined to obtain support from external green investors through environmental disclosure to alleviate resource scarcity pressure and achieve green innovation. H2 is confirmed.
Table 6.
Correlation analysis and covariance test.
Table 7.
Baseline regression results.
Robustness Analysis
Alternative Explanatory Variable Model Estimation
To ensure that the empirical findings are legitimate and address potential issues related to omitted variables and measurement errors, this study follows the approach used by other scholars in constructing environmental information disclosure measures [32]. Specifically, we expanded the evaluation to include seven aspects: environmental management, environmental regulation and certification, and environmental performance and governance, covering a total of 27 indicators. The overall scores were averaged to derive a revised environmental information disclosure metric (Eid_). This revised measure was then used to re-run the regressions in Models (1) and (2) to re-evaluate the main hypotheses. From the regression results, it can be seen that the hypothesis remains consistent, and the results are robust.
Table 8.
Moderating effect.
Alternative Dependent Variable Model Estimation
In order to overcome issues with missing variables and measurement inaccuracies and to ensure robustness and rigor, this study adopts an alternative measure for corporate green innovation. Following the approach used by other scholars in understanding green innovation, we selected the number of granted green patents as a substitute variable for green innovation (LnGreen_Grant). This measure is calculated by using the logarithm of the total amount of granted green invention patents and granted green utility model patents plus one[53]. The alternative dependent variable, the number of granted green patents (LnGreen_Grant), was then substituted into the regression models to re-test the main hypotheses. The results of the test are shown in Columns (3) and (4) of Table 9, which are significant and consistent with the hypothesis, indicating the robustness of the conclusion.
Alternative Moderating Variable Model Estimation
To minimize potential estimation bias due to variations in the choice of moderating variables, this study employs alternative measures for the moderating variable to examine result robustness. While the SA index is widely adopted as a measure of financial constraints, some researchers prefer alternative indices to enhance the generality and robustness of findings. For example, scholars have employed the FC index, based on interest coverage [54], while others argue that the WW index accurately captures core financial constraint concepts [55]. Consequently, this study uses the FC and WW indices as alternative proxies in robustness tests. Results, presented in Columns (5) and (6) of Table 9, indicate that the moderating effects align with the initial hypothesis, confirming robustness.
PSM Test
To overcome the problems caused by sample selection bias, this study uses the PSM method for robustness testing. Drawing on the practice of Tian [56], virtual variables are constructed based on the mean performance of environmental information disclosure in the same industry and year. If a company’s environmental information disclosure performance in a given year is higher than the industry average for that year, it is assigned a value of 1; otherwise, it is assigned a value of 0. Then, all control variables are used as covariates for 1:1 nearest-neighbor matching. The results of regression analysis after sample matching are shown in Columns (7) and (8) of Table 9. After controlling for sample selection bias, the coefficient for environmental information disclosure is significantly positive at the 1% level. This indicates that the conclusion that environmental information disclosure improves corporate green innovation remains robust.
Instrumental Variable Approach
The potential endogeneity problem arising from the reverse causal link between green innovation and the sharing of environmental information is addressed in this study through the use of an instrumental variable approach. Specifically, the annual industry average of the endogenous variable is used as an instrument. The average value (mEid) is utilized as the instrument. The instrumental variable has a strong correlation with the enterprise’s own environmental information disclosure because the annual industry mean can reflect the overall disclosure level of the industry in which the enterprise is located and because peer competition and industry norms frequently influence the disclosure behavior of the enterprise. Furthermore, the annual-industry mean satisfies the exogeneity requirement that the instrumental variable be independent of the error term because it is derived from the behavioral data of other businesses in the industry. This means that individual businesses’ decisions regarding green innovation are unaffected. Reverse causation can be minimized, and the risk of businesses’ green innovations impacting their disclosure of environmental information in the opposite direction can be efficiently avoided by using annual industry averages.
Table 10 displays the findings. At the 1% level, there is a considerable correlation between environmental information disclosure and green innovation. Additionally, the validity of the selected instrument is supported by the tests. These statistical tests confirm the appropriateness of the chosen instrument.
Further Analysis
Heterogeneity Analysis
The operational, institutional, and industrial environments in which a firm operates can have an effect on how well corporations disclose their environmental information. Based on basin heterogeneity, this study divides the sample companies into upstream, midstream, and downstream parts, referring to Chen’s description of the Yangtze River Basin’s resource features [57]. The western, central, and eastern portions of China are covered by the Yangtze River Economic Belt, which means that these areas have distinct resource and environmental conditions. Additionally, following the industry classification based on water resource disclosure by Zhou, considering that the resource dependence along the river basin is largely related to water resources, the sample companies are divided into basin resource-dependent and non-basin resource-dependent industries [58]. Industries like agriculture, forestry, animal husbandry, and fishery (A), mining (B), manufacturing (C), electricity, heat, gas, and water production and supply (D), and water conservation, environmental, and public facilities management (N) are classified as basin resource-dependent industries. The remaining industries are classified as non-basin resource-dependent industries. Furthermore, the institutional environment where the company operates is also crucial. Based on the heterogeneity of ownership, the businesses in the sample are separated into state-owned and non-state-owned businesses. Table 11 displays the findings of the heterogeneity study.
The heterogeneity analysis’s findings show that there are notable regional variations in the moderating influence of funding limitations and the effect of publicly available corporate environmental data on green innovation. Specifically, there is little correlation between corporate environmental information disclosure and green innovation in the upper sections of the Yangtze River. The moderating impact of financial limitations is noteworthy, with the interaction term coefficient of 0.154 being significant at the 5% level. This is primarily because the upper reaches have scarce resource endowments, and their infrastructure and industrial structure are relatively underdeveloped. Under such external conditions, companies face greater survival pressures, leading to a focus on short-term economic benefits rather than long-term green development. In the upper reaches, which are the resource origin of the Yangtze River Basin, environmental policies are stricter, and corporate environmental information disclosure is often driven more by compliance rather than proactive innovation considerations. As a result, in the upper-reach sample, there is no discernible impact of environmental information sharing on green innovation. However, due to the underdeveloped financial markets in the upper reaches, companies facing financing difficulties are compelled to enhance environmental information disclosure to attract funds or reduce financing costs. In this case, the relationship between environmental information disclosure and green innovation is positively moderated by financial limitations.
Table 9.
Robustness test.
In the middle reaches, the economic foundation is relatively balanced, and the financial market is more mature. Here, the effect of corporate environmental information disclosure on green innovation is significant, with a coefficient of 0.059 at the 5% level, and the moderating effect of financing constraints is also significant, with an interaction term coefficient of 0.129 at the 10% level.
Financing restrictions have little influence in the lower reaches despite the fact that at the 10% level, environmental information disclosure significantly influences green innovation. This could be due to the fact that firms in less developed economies have higher financing capacities and that there is less of a moderating influence from finance limitations on the association between green innovation and information sharing. These differences reflect the varying impacts of economic development levels, financing environments, and market demands on corporate green innovation and environmental information disclosure across different regions.
When analyzing the heterogeneity of river basin resource-dependent industries, it was found that there are significant differences in the relationship between environmental information disclosure and green innovation. Green innovation and environmental information disclosure have no discernible association for sectors that depend on resources found in river basins. This is because companies in these industries emphasize short-term economic gains above long-term green innovation because they are directly linked to water-based river basin resources, which are relatively easy to access. For these companies, environmental information disclosure, while enhancing their environmental image, is often more about responding to external compliance pressures rather than stemming from intrinsic motivation.
However, the moderating effect of financing constraints in these industries is significant at the 1% level. When financing pressure is high, companies, in their need to secure funds, emphasize displaying a good environmental and green image to attract investment and improve financing conditions. In this case, financing constraints become an important external moderating factor that boosts the connection between innovative green practices and environmental data disclosure.
In contrast, environmental information disclosure significantly promotes green innovation in non-resource-dependent companies, as demonstrated by a coefficient of 0.062, which is significant at the 1% level. Due to the more developed financing environment in these industries, the moderating effect of financing constraints is not significant. This indicates that, in different industry contexts, the impact mechanisms of environmental information disclosure and financing constraints on green innovation vary, reflecting differences in industry resource dependence, financing environments, and market demands.
When analyzing the heterogeneity based on the nature of property rights, the results reveal different performances between state-owned and non-state-owned enterprises. For state-owned enterprises, environmental information disclosure significantly promotes green innovation, with a coefficient of 0.061, which is significant at the 1% level. This is because state-owned enterprises bear substantial social responsibilities and policy implementation tasks, resulting in higher transparency and standardization in their environmental information disclosure, effectively showcasing their efforts and achievements in green development. However, due to their typically stronger financing capabilities and government support, the moderating effect of financing constraints is not significant for these enterprises.
Table 10.
Instrumental variables test.
Table 11.
Heterogeneity analysis results.
In contrast, non-state-owned enterprises operating in a more freely competitive market environment face more intense market competition. The primary regression results are less significant than expected, which may be related to the insufficient standardization of information disclosure and a greater emphasis on short-term market returns. Nonetheless, non-state-owned enterprises often encounter significant pressures in financing, and financing constraints have a direct impact on their development. Through environmental information disclosure, these enterprises can alleviate information asymmetry, improve credit ratings, and attract investors and external funds, thereby effectively mitigating financing constraints.
This disparity illustrates how state-owned and non-state-owned businesses differ in terms of their capacity for funding, policy dependence, and market competition. It emphasizes the crucial role that the nature of property rights plays in exploring the connection between green innovation, financial limitations, and the sharing of environmental information.
Threshold Regression
The results from the baseline regression indicate that the extent of enhancing corporate green innovation is significantly impacted linearly by corporate environmental information transparency. To explore the moderating conditions of environmental information disclosure on green innovation, a threshold effect test was conducted on the moderating variable, financing constraints. The threshold Model that is shown below was built:
(3)
In the Model, I(·) represents the indicator function, which takes a value of 0 when the expression in parentheses is false and 1 when it is true. The threshold model divides the sample into two regimes based on whether the threshold variable, financing constraints SAi,t , exceeds the threshold value γ. These two regimes can be represented by different slopes ϕ1 and ϕ2, while the other variables remain the same as in Model (1).
The threshold effect is tested using the bootstrap method with 1000 resamples to statistically check for the presence of a threshold effect and determine the number of thresholds. According to the results in Table 12, financing constraints pass the 1% significance test and exhibit a single threshold. Table 12 also presents the estimated threshold values, with the threshold estimate corresponding to the value of γ where the likelihood ratio statistic (LR) approaches zero.
Table 12.
Threshold effect test results.
Table 13.
Threshold effect regression results.
Table 13 also displays the threshold regression results after determining the threshold value. Table 13 demonstrates that the regression coefficient is 0.018 for moderate degrees of funding limitations (SA < 3.8515) and rises to 0.080 for severe financing constraints (SA > 3.8515). Both coefficients are significant at the 5% level. This indicates that as the level of financing constraints increases, the impact of corporate environmental information disclosure on promoting corporate green innovation becomes stronger.
When financing constraints are relatively mild, firms can rely on internal funds and short-term financing to support green innovation. However, as the pressure from financing constraints intensifies, firms become more eager to secure external funding. To address the challenges posed by financing constraints, companies need to actively attract and gain the trust of investors, and environmental information disclosure can serve as a critical tool to overcome information barriers and attract green investors. Thus, the increasing importance of environmental information disclosure in alleviating internal and external pressures highlights its enhanced role in promoting green innovation as financing constraints become more severe.
Conclusions
This study, based on a sample of enterprises in the Yangtze River Economic Belt from 2008 to 2022, investigates the relationship between corporate environmental information disclosure and corporate green innovation. It also examines the moderating effect of financing constraints and further explores heterogeneity and threshold effects. The main conclusions of the study are as follows.
Improving the quality of corporate environmental information disclosure can promote the development of corporate green innovation, with businesses situated in the middle and lower parts of the Yangtze River experiencing a greater impact from this, enterprises in non-river basin resource-dependent industries, and state-owned enterprises.
Financial constraints drive companies to disclose environmental information, which in turn promotes corporate green innovation. This moderating effect is more pronounced among enterprises in the upper reaches of the Yangtze River, in river basin resource-dependent industries, and among non-state-owned enterprises.
When the pressure of financing constraints intensifies to a certain extent, this pressure compels companies to actively improve the standard of environmental disclosure in order to promote corporate green innovation.
Recommendations
The government, businesses, and the general public should consider the following suggestions from this study, which are based on the research findings and analysis mentioned above.
At the government level, it is crucial for the government to act as both a leader and supporter by strengthening the normative framework for environmental information disclosure through legislation. As part of this, a thorough legal framework must be established to guarantee the accuracy and legitimacy of corporate environmental data. To support the green, low-carbon, and high-quality development of the Yangtze River Economic Belt, the government should also set up special funds and tax incentives to reward companies that actively share environmental data and promote eco-friendly innovation, thereby stimulating their intrinsic motivation. Additionally, the government needs to enhance interdepartmental collaboration to optimize the allocation of financial resources, guide social capital towards green innovation projects, and offer customized financing solutions, especially for small and medium-sized enterprises, to lower financing thresholds and costs and help them overcome the challenges of green transformation.
At the corporate level, companies should adopt the concept of green and low-carbon development in the Yangtze River Economic Belt and proactively embrace green transformation. Environmental information disclosure should be seen as a crucial means to enhance brand image and market competitiveness. Companies should build comprehensive environmental management systems to guarantee the quality and timeliness of environmental data and use digital tools to improve disclosure efficiency. In terms of financing, companies should actively explore innovative financing models, such as green bonds and green asset securitization, to broaden financing channels and reduce financing costs. They should also increase efforts in green technology research and application and establish collaborative mechanisms between industry, academia, and research institutions to lead green development through technological innovation. Additionally, companies need to strengthen internal training to enhance employees’ environmental awareness and green innovation capabilities, fostering a strong atmosphere of collective participation in green innovation.
At the societal level, the public should actively engage in and oversee corporate environmental information disclosure and green innovation activities. Through advanced streaming channels, the public can access comprehensive information about companies’ environmental practices and lean towards those that emphasize environmental protection and green innovation in their consumption choices. In terms of supervision, the public should be vocal and report and expose instances of non-transparent environmental information disclosure or inadequate green innovation by companies, creating substantial social pressure to drive continuous improvement and enhancement. Additionally, the public can contribute to raising overall environmental awareness and promoting green consumption concepts through education and outreach, collectively fostering a societal atmosphere that supports green and high-quality development.

