

Introduction
China’s 14th Five-Year Plan, spanning over 30,000 words and covering 15 themes, includes a dedicated section on green development in the new era. [1] In this plan, General Secretary Xi Jinping emphasizes the importance of nature conservation in modern China, reiterating the term “green” thirteen times, as nature is fundamental to human survival and development. China’s development plans remain centered on harmonious coexistence between humans and nature, integrating the Chinese concept that "green water and green mountains are invaluable assets”. This report suggests four strategies for green and low-carbon development: accelerate towards a greener development model; reduce environmental pollution; enhance ecosystem diversity; and promote carbon peak and neutrality. In summary, the 14th Five-Year Plan incorporates green development principles into China's future modernization [2].
Feng et al. [3], as well as various scholars, have studied green development and its influencing factors in China and globally. Sun et al. [4] analyzed China’s green development’s spatial and temporal variations. Zhou et al. [5] studied the efficiency of green development and its influencing factors in Chinese cities. Ma and Zhu [6] examined how the digital economy influences sustainable green development. Concurrently, scholars have examined the operationalization of green development within Chinese enterprises. Han and Wu [7] suggested prioritizing cooperative ecological and environmental interests and encouraged enterprises to adopt green management practices. Lyu et al. [8] examined the implications of green finance policies on corporate green development. Chen [9] scrutinized government policies guiding large enterprises towards green practices and fostering corporate social responsibility. Changing times have resulted in the evolution of corporate social responsibility (CSR) into corporate ESG: Environmental, Social, and Corporate Governance. ESG investing, introduced in 2006 by the United Nations Principles for Responsible Investment, emphasizes non-financial evaluations, namely environmental, social, and governance aspects. Enterprises are motivated to pursue social value alongside corporate interests, reflecting the direction of green development in the new era. Leading global technology enterprises have high ESG disclosure rates. Over 90% of Silicon Valley’s top 150 listed technology companies provided ESG disclosures in 2021 (Loneraan SV150). Also, ESG disclosure varies in quantity and quality depending on company size. Compared with Europe and the United States, Chinese companies are still in the early stages of ESG. Presently, there is insufficient standardization on ESG disclosures, with improvements in data comparability and reliability needed.
Scholars have shown that ESG influences corporate performance. Qiu and Yin [10] uncovered that companies with strong ESG performance enjoy the benefits of lower financing costs, with the quality of information disclosure being a determining factor. Wang and Yang [11] demonstrated that strong ESG performance can boost corporate visibility and lower financing costs, ultimately increasing corporate value. Xi and Wang [12] revealed a connection between ESG disclosures and stock prices, suggesting that adequate ESG disclosure reduces the risk of stock price collapse by mitigating information asymmetry and investor concerns. This study highlights the relationship between ESG disclosure, market transparency, and volatility. Bai et al. [13] used panel regression and panel logit models to investigate the effect of ESG performance on Chinese A-performance, which deters corporate financialization. Wang et al. [14] also conducted a study on ESG and financial performance using both the GMM method and hierarchical regression analysis. They found a non-linear U-shaped relationship between corporate ESG and financial performance, with this relationship further strengthened by corporate competitive strategy. He et al. [15] investigated ESG performance and corporate risk-taking, while Wang et al. [16] examined how ESG performance affects stock liquidity. Lian et al. [17] studied the influence of corporate ESG performance on bond credit spreads, and Chang et al. [18] studied the impact of ESG performance and digital finance on China’s corporate finance efficiency. Zheng et al. [19] examined whether corporate ESG performance can create value using new evidence from Chinese mergers and acquisitions. Cheng et al. [20] tested the relationship between ESG scores and firm value. Bilyay-Erdogan et al. [21] found that companies with higher ESG performance will likely pay higher dividends. Previous studies on ESG performance have focused on the impact of ESG on firm value, financialization, financing costs, risk-taking, and finance efficiency. However, these studies have primarily examined the relationship between ESG performance and corporate operations through reducing market information asymmetry, particularly regarding ESG disclosure.
Since Fazzari’s [22] definition of corporate financing constraints in 1988, many scholars have conducted corresponding studies on corporate financing constraints. Hadlock and Pierce [23] introduced the KZ index for firm size and age and proposed the SA index to measure the degree of corporate financing constraints. Building on this study, Ju et al. [24] explored the connections between financing constraints, working capital, and firms’ innovation activities. Xu and Zhang [25] studied the implications of the rule of law environment and corporate financing constraints on research and development investment. Findings show that corporate research and development investment exhibits a positive relationship with the rule of law environment and a negative relationship with corporate financing constraints, but this negative relationship could be mitigated by improving the rule of law environment. Tan and Xia [26] studied the effect of financing constraints on stock prices. Wei et al. [27] studied the relationship between the financial ecological environment and corporate financing constraints, with results indicating the benefits of a good ecological environment in lowering corporate financing constraints. Yao and Yang [28] summarized the transmission chain of “digital finance-financing constraint-firm innovation” at the theoretical and practical levels. Khan [29] found that pre-pandemic financing constraints affected how SMEs navigated the COVID-19-induced economic crisis. Chen and Yoon [30] discovered that financial technology reduces financing constraints and lowers debt-financing costs. Lu et al. [31] found that small and medium-sized enterprises’ financing constraints are negatively associated with the proportion of local bank branches and the degree of digital financial inclusion. Lin and Ma [32] found that digital finance positively influences green technology innovation by reducing financing constraints. Wu and Huang [33] found that financial constraints have a robust negative effect on new energy firms’ financial performance, while Ding et al. [34] suggested that financially constrained firms exhibit a higher innovation level in cities with advanced fintech services. Zhang [35] showed that the corporate financial environment is a determinant of corporate greenwashing behavior. Xu and Kim [36] argued that financial constraints increase firms’ toxic emissions as firms actively trade off abatement costs against potential legal liabilities. Deng and Zhao [37] shed light on the debt financing costs of finance-constrained companies as positively related to firm value. The research on corporate financing constraints is rich, but the literature on the relationship between corporate ESG performance and financing constraints remains relatively sparse. Furthermore, examining whether corporate ESG performance can mitigate corporate financing constraints and understanding its underlying mechanisms is theoretically significant.
This paper departs from the studies mentioned above by beginning with the connotations and backgrounds of green development in the new era, categorizing ESG performance, and then empirically studying its relationship with financing constraints, followed by relevant recommendations. Specifically, the contributions of this paper are three-fold: first, it enriches current theoretical understanding of ESG’s implications on corporate operations and enriches empirical research on corporate financing constraints; second, the study finds that financialization masks the effects of ESG performance via financing constraints and corporate management shareholding and concentration play an intermediary role in facilitating ESG on financing constraints; third, the study reveals that the effects of ESG performance on financing constraints are more evident for non-state-owned enterprises, enterprises with a higher proportion of independent directors and enterprises with lower financial leverage.
Methods
Sample Selection and Data Sources
This paper obtains data from the 2011-2021 Chinese A-share main board and growth enterprise board companies as research samples and excludes the special treatment and particular transfer category data. An unbalanced panel containing 3,281 firms over 11 years is constructed. The financial data used in this paper is from the China Stock Market and Accounting Research Database.
Definition of Variables
Main Explanatory Variables: Corporate ESG Performance
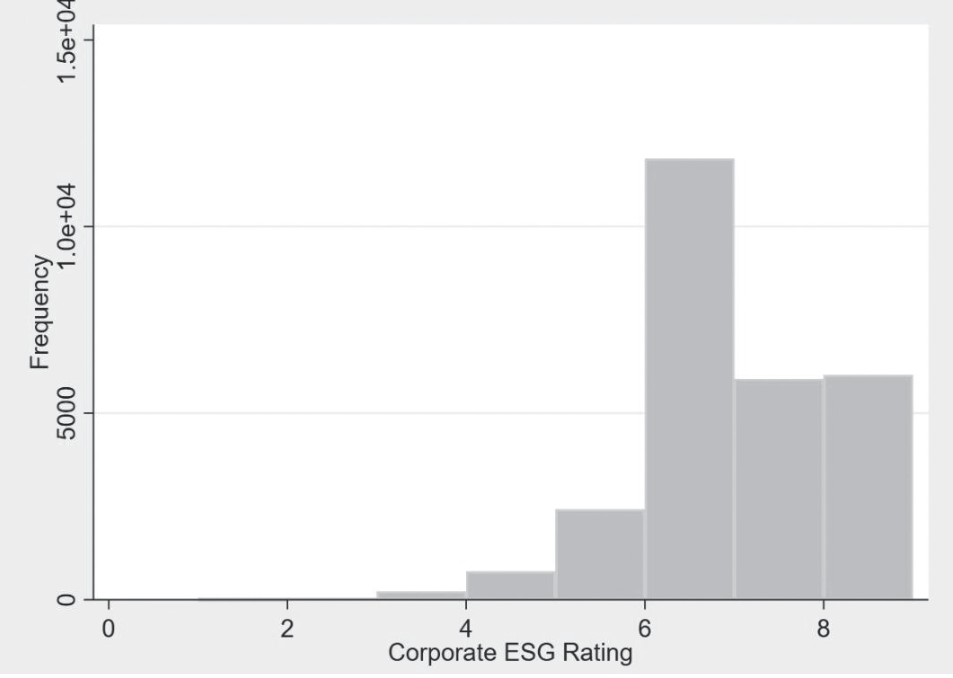
This paper uses the ESG index from the CSI ESG evaluation system to measure corporate ESG performance. The index is divided into nine levels. This paper uses a nine-point scale to assign scores to ESG performance, i.e., the ESG performance score is 1-9, with higher scores representing better ESG performance. Fig. 1 shows the ESG performance scores of the sample companies, with most companies scoring at least 7.
Explained Variable: Corporate Financing Constraints
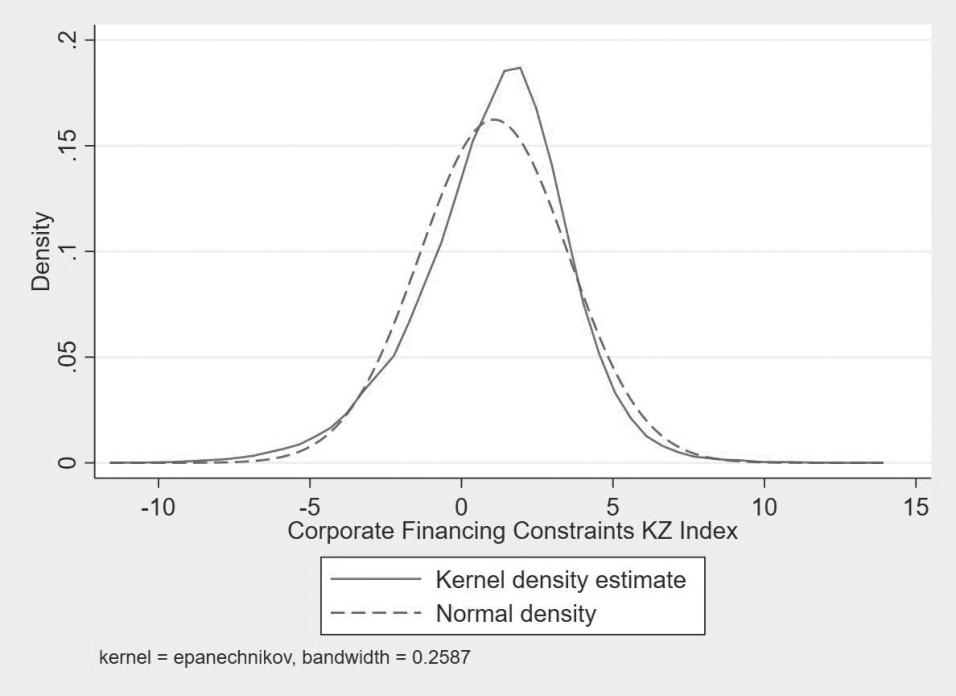
Following Hadlock and Pierce [23], Ju et al. [24], and Xu and Zhang [25], the KZ index is chosen to measure the degree of corporate financing constraints. The greater the KZ index, the more serious the financing constraint faced. Fig. 2 shows that the majority of firms in the sample have a financing constraint index between -5 and 5.
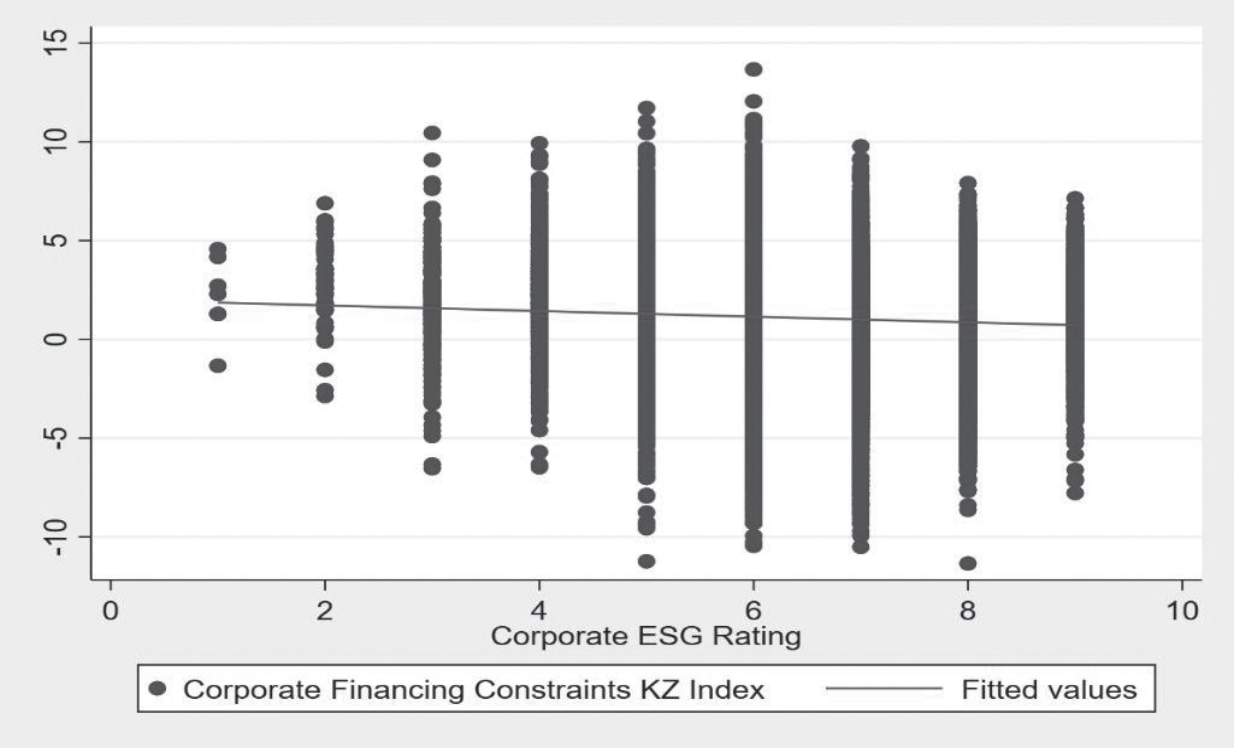
Regarding ESG performance, this paper plots the scatter plot between corporate financing constraints KZ and corporate ESG performance through Stata and draws the nearest “regression line” to these sample points on the plot (see Fig. 3). Through the scatter plot and linear fit, we see that the KZ index is negatively related to corporate ESG performance, which will be verified later by our empirical analysis.
Control Variables
Referencing Xie et al. [38], this paper controls for the influence on financing constraints through the following factors: regional level (i.e., industrial structure and economic development) and the firm level (i.e., size, financial leverage, fixed asset ratio, profitability, growth, equity concentration, fair value, equity nature, dual position, and the proportion of independent directors). Table 1 shows the detailed definitions of the relevant variables.
Model Design
To verify the effects of corporate ESG performance on financing constraints and their underlying mechanisms, this paper adopts multiple linear regression methods and t-tests. After conducting the Hausman test, this paper establishes a fixed-effects basic empirical model as follows:
Table 1.
Definition of relevant variables.
where i, j, and t represent individual, region, and year, respectively. Controli,j,t represent firm-level and region-level control variables. δi denotes individual fixed effects. εi,j,t is the random error term.
Results and Discussion
Descriptive Statistics
Table 2 presents the mean financing constraint (KZ) value for the sample enterprises as 1.075, with a median of 1.296. The range is substantial, from a minimum of -11.35 to a maximum of 13.66, highlighting the sizable variation in financing constraints among the sample companies. This accentuates the paper’s significant theoretical and practical contributions to understanding corporate financing constraints. The mean ESG value is 6.519, with a median of 6. This range is broad-based, with values ranging from 1 to 9, underscoring significant variation in ESG performance among the sample companies.
It is noteworthy that the average shareholding ratio of the first largest shareholder in the sample is 34.5%, with a median of 32.2%. In comparison, the highest shareholding ratio of the first largest shareholder reaches 90% (implying a high degree of centralization), while the lowest shareholding ratio of the first largest shareholder is only 0.3 (fragmented shareholdings). The average and median percentages of independent directors are 38% and 36.4%, respectively. The lowest percentage of independent directors is 18.8%, whereas the highest percentage is 80%, showing a significant difference in the percentage of independent directors in the sample. The average and median percentages of financial leverage in the sample are 43% and 42.3%, respectively, with the highest percentage at 99.8% (full debt operation), while the lowest financial leverage ratio is only 0.7% (essentially debt-free). Additionally, there are significant differences in Tobin's Q and fixed asset ratio among the sample enterprises, so these variables are added to the control variables in this paper. The table below shows the results of the descriptive statistics.
Correlation Coefficient Statistics
Table 3 shows a strong correlation between KZ and the main explanatory and control variables for corporate financing constraints within the sample companies. KZ is shown to be negatively correlated with ESG; the correlation between any two variables in Table 3 is statistically significant, indicating a strong correlation between basically any two variables.
Basic Regression Results
Table 4 shows the specific regression results. Column (1) shows the regression results without controlling for relevant variables and without fixing industry and region effects; Column (2) shows the regression results after adding region and firm control variables to Column (1); Column (3) fixes industry and region effects to Column (2); and Column (4) clusters the standard errors for individuals to Column (3).
Table 2.
Descriptive statistics results.
Table 3.
Correlation coefficient matrix of variables.
Table 4.
Table of basic regression results.
The regression results of the main explanatory variables affecting corporate financing constraints are all statistically significant at the 1% significant level with negative regression coefficients, showing a significant negative relationship between ESG performance and financing constraints KZ. Correspondingly, improving corporate ESG performance will ease financing constraints.
Robustness Test
Replacement of the Main Explanatory Variables
Given a significant time lag in the publication of ESG reports (usually published before May of the following year), this paper uses one-period lagged ESG and two-period lagged ESG to replace the main explanatory variables for robustness testing.
Results indicate a significant negative correlation between ESG performance and the KZ index, namely a coefficient of -0.03 at the 5% level and -0.04 at the 1% level. Our results imply that higher ESG performance is associated with lower financing constraints, irrespective of whether lagged one-period or lagged two-period ESG values are considered.
Replacement of Explained Variables: SA is Used Instead of KZ
The quantitative measurement of financing constraints begins with qualitatively classifying an enterprise’s financing constraints within a limited sample. Subsequently, the relationship between financing constraints and specific corporate-related variables is examined to construct the financing constraints index. Applying this index to a larger sample, the financing constraint index of each enterprise in the larger sample is calculated based on the relative degree of financing constraints. This index is certainly not an absolute measure of financing constraints, but it serves to reflect the relative degree of financing constraints of specific sample enterprises. Representative measurement methods include the KZ index, the WW index, and the SA index.
The KZ and WW indexes have one weakness: excessive financial variables with endogeneity, such as cash flow and leverage, and financing constraints and variables, such as cash flow and leverage. To avoid endogeneity, Hadlock C J and Pierce J R (2010) classify corporate financing constraints based on corporate financial reports by using the KZ methodology, followed by constructing the SA index using only two variables (i.e., firm size and age), which do not change much over time and are highly exogenous.
To address the endogeneity issue, this paper replaces the explained variables with SA, a more exogenous measure of financing constraints, to re-run the empirical test.
Referring to Hadlock C J, Pierce J R (2010), and Ju et al. (2013), sample firms are first qualitatively categorized into five levels of financing constraint types. The formula for calculating the SA index is estimated using the Ordered Probit Model and applied to a larger sample. In this paper, the SA index is also calculated directly using the following formula:
ln_Size is the natural logarithm of the enterprise’s total assets, and age is the enterprise’s operating year.
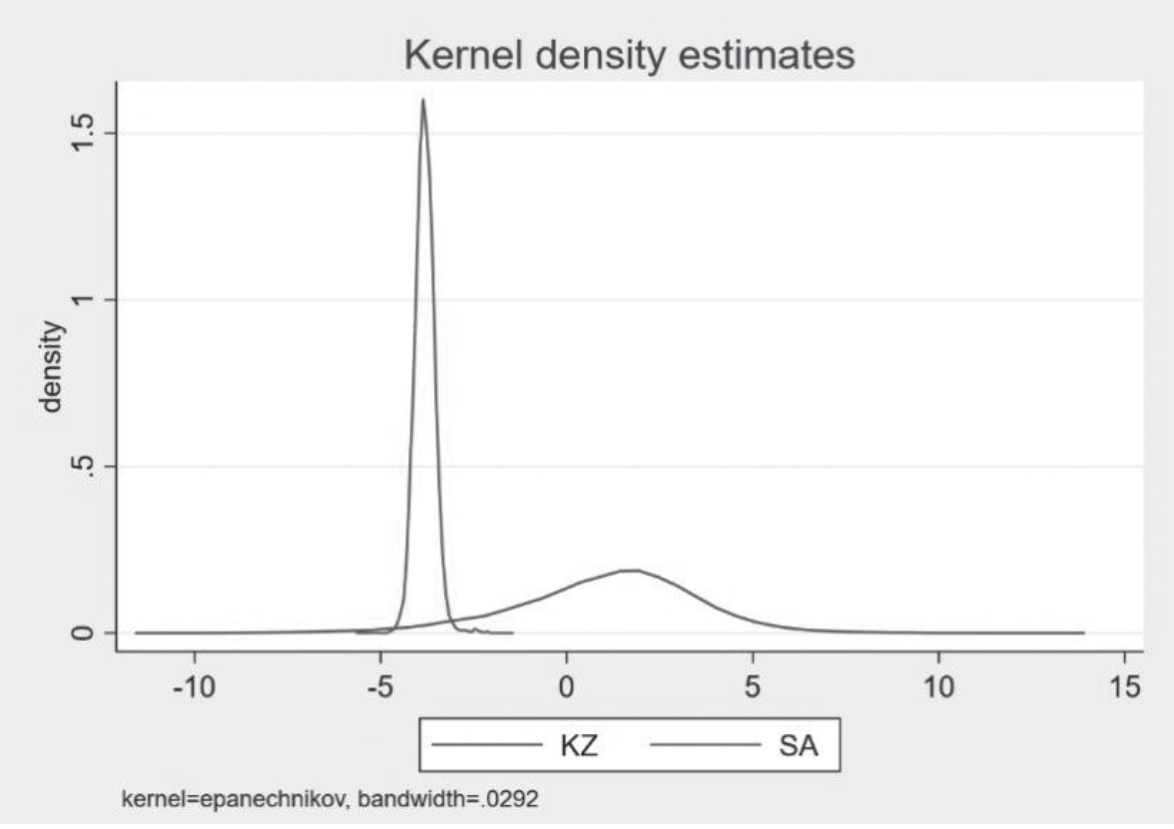
The above equation is a quadratic function with an inflexion point around 9. ln_Size The SA value affects the degree of financing constraints. When ln_Size is less than 9, the larger SA represents a more serious degree of financing constraint; When ln_Size is over 9, the smaller SA represents a less serious degree of financing constraint. After constructing the SA index, the minimum value is -5.65, and the maximum value is -1.46. The correlation coefficient between the SA index and firm size is calculated with the result as being 0.02 and significant at the 1% level, with ln_Size being between the minimum value of 14.94 and the maximum value of 28.64. Referring to Hadlock and Pierce [25] and Ju et al. [26], when the SA index of the sample firms is extensive, the smaller the absolute value, the smaller the financing constraints faced by the sample firms. Fig. 4 shows that based on the kernel density plot of the SA index and KZ index, the KZ index approximately obeys the normal distribution, mainly taking values between -5 and 5, while the SA index mainly takes values between -5 and -3. Also, all enterprises within the sample take negative values of the SA index.
After replacing the KZ index with the SA index, this paper constructs the multiple linear regression Equation (3) for robustness testing.
where i, j, and t represent the individual, region, and year, respectively. Controli,j,t represent firm-level and region-level control variables. γi denotes individual fixed effects. εi,j,t is the random error term.
The regression results from Equation (3) indicate that β_1 is 0.0089, significant at the 1% level. This finding suggests that as the SA index increases (with a smaller absolute value), the financing constraints faced by the enterprise decrease. Therefore, there is a negative relationship between the enterprise’s ESG performance and its financing constraints. The robustness test is passed.
Using a Two-Way Fixed Effects Model for the Year Area
This paper reduces the errors caused by omitted variables by fixing the year’s effect and regional effects as follows:
where i, j, and t represent individual, region, and year, respectively. Controli,j,t represent firm-level and region-level control variables. φt denotes time fixed effects.ωj denotes area fixed effects. εi,j,t is the random error term.
The regression result from Equation (4) is significant at the 1% level, θ1 with a coefficient of = -0.041. This indicates a negative relationship between ESG performance and its financing constraints. The robustness test is passed.
Discussion on Mechanisms
To study the role of corporate ESG performance in alleviating corporate financing constraints, we refer to Wen and Ye [39] and Jiang [40], respectively, to construct corporate financialization, corporate management shareholding ratio, and corporate equity concentration mediation models to test the causal relationships between corporate ESG performance and corporate financialization, corporate management shareholding ratio, and corporate equity concentration. For our testing, the Sobel test and bootstrap test are conducted to examine the mediating effects. Due to space constraints, the specific mediation regression model and results are not shown here. Interested readers can ask the authors for them.
Corporate Financialization
Liu and Xie [41] analyzed the financial data of A-share listed companies in the Shanghai and Shenzhen markets from 2010-2019 and found that financialization significantly reduces financing constraints. Referring to Peng et al.’s [42] study, corporate financialization is measured by the share of financial assets held (i.e., the sum of corporate held-to-maturity investments, trading financial assets, derivative financial assets, available-for-sale financial assets, long-term equity investments, dividends receivable, interest receivable, bought-back financial assets, loans and advances issued, and investment properties to total assets).
The mediating effect model’s regression results reveal that ESG performance may inhibit corporate financialization, consistent with Pan et al.’s [43] findings. Corporate financialization may reduce financing constraints to a certain extent, which is also consistent with the findings of Liu and Xie [41]. Therefore, corporate financialization has a masking effect on ESG performance, affecting financing constraints. To ensure result validity, the Sobel and Bootstrap tests are conducted on the mediating effect of corporate financialization.
Shareholding Ratio of Enterprise Management
Fan and Zhou [44] discovered a significant U-shaped relationship between management shareholding and financing constraints in their study of listed Chinese companies from 2012-2015. This paper extends its findings by investigating the effects of financing constraints on ESG by considering the percentage of corporate management shareholding as a mediating factor. Based on the regression results of the mediating effect model, corporate ESG performance will promote management to increase the number of corporate shareholdings. This increase can effectively reduce the company’s corporate financing constraints. To ensure the validity of the result, the Sobel test and Bootstrap test are conducted on the mediating effect of corporate management shareholding.
Concentration of Equity: TOP1
Zhang et al. [45] and Yu et al. [46] suggest that real estate firms can reduce corporate financing constraints by increasing equity concentration. This effect is more pronounced for firms with higher equity concentrations.
Regression results from the mediating effect model show that corporate ESG performance will prompt major shareholders to increase equity concentration. The concentration of equity will effectively alleviate corporate financing constraints. To ensure the validity of the results, the Sobel test and bootstrap test are conducted for the mediating effect of equity concentration.
Heterogeneity Discussion
The Nature of Equity
In seeking funding, enterprises with poor prospects may present themselves as high-quality ones. Mature financial markets rely on established rating and auditing agencies to assess corporate quality and future performance, thereby playing the role of providing reliable information to capital suppliers. However, China’s financial system has no established system for this purpose. Although China’s credit rating agencies have made initial developments, there is still a big gap between them and the global rating agencies regarding personnel, technology, and business scope. Their research reports cannot meet market expectations and demand, so their market recognition is not high. As a result, banks and external equity investors as capital suppliers have very limited corporate information sources, and there is a serious information asymmetry between the supply and demand of capital. The supply side of capital cannot distinguish between high-quality and low-quality enterprises, making it difficult to curate expectations and judgments on return on capital. These result in difficulties in enterprise financing. China’s state-owned enterprises (SOEs) have a natural advantage in this regard, as most of China’s banks and large financial institutions are also SOEs, which reduces communication barriers and information asymmetry. Concurrently, SOEs tend to have more stringent internal management and information disclosure systems, reducing the possibility of fraudulent financial reports. Chen et al. [47] found that firms with different equity properties encounter different financing constraints when facing market competition.
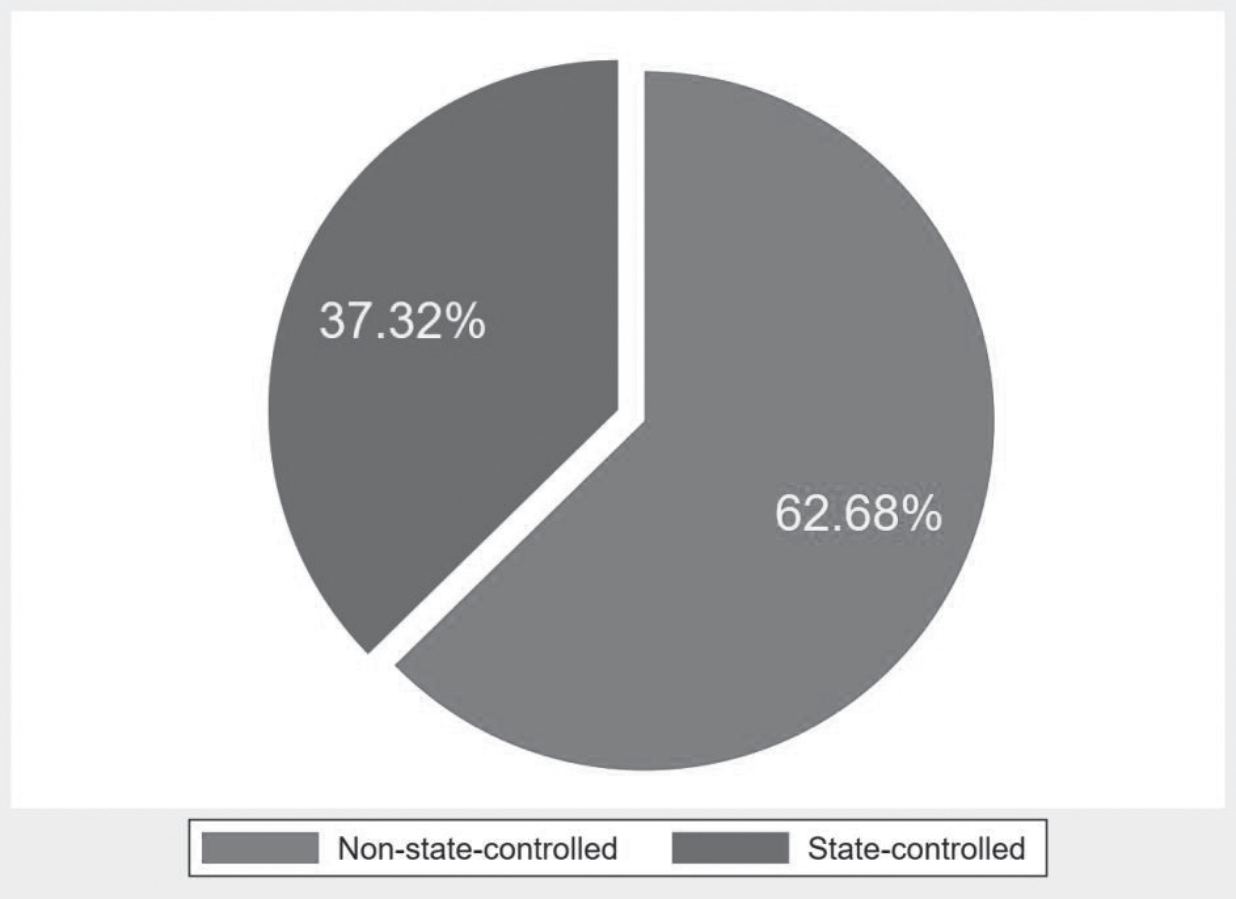
Considering the significant variations in corporate financing capabilities based on firms’ equity properties, this paper classifies sample firms accordingly for regression analysis. Table 5 and Fig. 5 illustrates the sample’s proportions of state-owned enterprises (SOEs) and non-state-owned enterprises (non-SOEs).
The regression coefficient of ESG performance of the non-SOE group is smaller than that of the SOE group, showing that ESG performance exerts more influence on the non-SOEs’ financing constraints. The results of Fisher's combination test at the 1% level for the non-SOE group are significant, while the results for the SOE group are insignificant. The results of the group regression comparison are significant at the 5% level, while the regression coefficient of ESG performance of the non-SOE group is smaller than that of the SOE group, indicating that the impact of corporate ESG performance on the financing constraints of non-SOEs is more significant. Therefore, non-SOEs can achieve a better reduction in financing constraints by improving ESG performance.
Table 5.
Description of equity nature grouping.
The Proportion of Independent Directors
Xu [48] found that independent directors influence corporate financing by mitigating agency problems and information risk, so there are differences in the performance of different independent director ratios on corporate financing outcomes. To further analyze the relationship between ESG performance and firms’ financing constraints with different independent director ratios, this paper divides the sample firms into two groups according to the median independent director ratio of 36.4% in the sample set. The regressions are divided into two groups, table 6 shows the relevant descriptive statistics after grouping the firms in the sample. The regression coefficient of ESG performance in the low independent director group is larger than in the high independent director group, indicating that ESG performance significantly impacts financing constraints in the high independent director group. The Fisher’s portfolio test results using Stata for the grouping are significant at the 1% level, while those for the low independent director group are significant at the 5% level. The regression results of group comparison at the 5% level are significant, and the regression coefficient of firms’ ESG performance in the low independent director ratio group is greater than the high independent director ratio group. This suggests that the impact of corporate ESG performance on financing constraints is greater in the high independent director ratio group. Therefore, improving the ESG performance of firms with high independent director ratios will better affect financing constraint mitigation.
Table 6.
Description of the grouping of the percentage of independent directors.
Table 7.
Description of financial leverage grouping.
Leverage
Huang et al. [49] study the connection between corporate leverage and productivity using information asymmetry and credit mismatch, finding that increased corporate leverage results in higher financing constraints. Therefore, to further analyze the relationship between ESG performance and financing constraints of firms with different leverage ratios, this paper divides sample firms into two groups according to the median financial leverage ratio of 42.3% of the sample for regression comparison, table 7 shows the relevant descriptive statistics after grouping the firms in the sample. The regression coefficients of ESG performance in the low financial leverage group are smaller than in the high financial leverage group, signifying that ESG performance has a more significant impact on financing constraints in the low financial leverage group. The Fisher combination test using Stata on the grouping is significant at the 1% level for the low financial leverage group, while it is significant at the 10% level for the high financial leverage group. The regression is significant at the 1% level of group comparison, and the regression coefficient of ESG performance in the low financial leverage group is smaller than that in the high financial leverage group, indicating that ESG performance has a greater impact on the financing constraints of firms in the low financial leverage group. Therefore, enhancing ESG performance among firms with low financial leverage will better mitigate financing constraints.
Conclusions
This paper extends the research by Hadlock C J, Pierce J R (2010), and Ju et al. (2013) on corporate financing constraints by investigating the relationship between corporate ESG performance and financing constraints by studying Chinese A-share non-financial listed enterprises from 2011-2021. Unlike previous studies, this paper provides new insights for firms to mitigate financing constraints as follows: First, a significant negative relationship exists between corporate ESG performance and financing constraints. This finding remains valid after a series of robustness tests, which is consistent with the findings of Bai et al. [50], Zhang et al. [51], and Zhai et al. [52]. Second, one of the major contributions of this paper includes the discovery of a masking effect of corporate financialization on corporate ESG performance, affecting corporate financing constraints. There is a mediating effect of corporate management ownership and equity concentration. Lastly, corporate ESG performance has a stronger impact on financing constraints for non-state-owned firms, firms with a high percentage of independent directors, and firms with low financial leverage.
The paper provides practical implications in providing an in-depth understanding of the relationship between corporate ESG performance and financing constraints, with important guidance for policymakers and practitioners in the financial sector. We propose some suggestions for policymakers and financial practitioners as follows:
First, policymakers can use these findings to develop more rational and effective financial regulatory policies. Corporate financing constraints can be reduced by increasing the requirements for corporate ESG performance and promoting corporate upgrading of ESG levels. Also, governments can strengthen corporate management shareholding and equity concentration regulations to ensure a positive influence on the mediation of financing constraints.
Second, financial practitioners can draw on these findings to improve their risk assessment and investment decision-making methods. When assessing the firm’s financing constraints, it is important to consider a firm’s ESG performance beyond traditional financial metrics. This performance data could provide a more comprehensive picture of a company, helping investors better understand its sustainability and risk levels and, thus, more accurately assess its financing constraints.
Finally, companies can apply the findings to their internal management and strategic decision-making. By improving ESG performance, enterprises can reduce their financing constraints, obtain more financing opportunities, and reduce financing costs. In addition, corporate management can focus on equity concentration and shareholding to reduce the impact of financing constraints, as well as improve the financing ability and competitiveness of the firm.
In conclusion, this paper’s findings provide policymakers and practitioners with important insights into the relationship between ESG performance and corporate financing constraints and some concrete applications. These findings can help guide the financial sector in a more sustainable and robust direction, promoting sustainable corporate development and financial market stability.
Our study also has some limitations. First, our sample is based on listed companies in mainland China, which is representative but lacks international applicability. Second, we only used CSI ESG ratings data and did not compare the impact of the ESG ratings of different organizations on our conclusions.
Here are some potential future research directions:
First, future researchers could examine the mechanisms by which corporate ESG performance affects financing constraints, such as the circumstances in which corporate financialization weakens or strengthens the impact of corporate ESG performance on financing constraints.
Second, researchers could compare the relationship between corporate financing constraints and ESG performance in different industries and regions. The study in this paper focuses on Chinese listed companies, while future research can be extended to other countries and regions to compare the relationship between corporate financing constraints and ESG performance in different industries and regions to find possible differences and special cases.
Third, researchers can assess the impact of different financing methods on the relationship between corporate ESG performance and financing constraints. This paper focuses on debt financing constraints, while future research can consider other financing methods, such as equity financing and venture capital, to explore their impact on the relationship between corporate ESG performance and financing constraints.
Finally, the impact of corporate ESG performance on investor decision-making and market reactions, such as investor decision-making market reactions (stock price and trading volume), can also be investigated so as to uncover the potential mechanism of the impact of ESG performance on corporate value.

