

Introduction
Since the 1990s, China has undergone a comprehensive reform of its socialist market economy system. This reform has involved the establishment and development of various types of factor markets, including labor, capital, land, technology, and others. These markets were initiated from a nascent stage and have undergone significant growth and evolution over time. After entering the 21st century, the accelerated iteration of new-generation digital information technology has led to the widespread identification and application of data as the carrier of various types of information elements [1]. To promote the circulation and value realization of data elements, different countries have formed different data trading models according to the characteristics and needs of their data industries. There are three main data trading models in the United States: C2B distribution of data platforms, where individuals sell data directly to the platforms; B2B centralized sales, where data platforms act as intermediary agents to summarize transactions; and B2B2C distribution and aggregation, where data platforms act as data brokers to collect data and then sell it exclusively. Contrarily, the European Union (EU) holds the belief that the primary impediment to the smooth flow and exchange of data stems from the dearth of trust between the entities involved in the transaction [2]. For this reason, the EU has created a data intermediary system. Data intermediaries and data supply and demand sides have strict independence. The UK puts data into a trust mechanism with legal checks and balances. In Japan, most of the relevant data trading platforms, data circulation promotion associations, etc., are led by private enterprises or organizations and industry self-regulation. At this stage, it is apparent that countries are actively exploring and promoting the construction of a data trading market.
Industrialization has exhibited a substantial surge in human productivity; however, it has concurrently resulted in substantial emissions of greenhouse gases and exacerbated the degradation of the ecological environment [3-5]. In light of the environmental crisis, achieving sustainable development has become an urgent and significant matter. It has been demonstrated that the emergence of environmental issues can be attributed to the inadequacy of the traditional model of technological innovation in accommodating the requirements of the current stage of productivity development. Additionally, the lack of action by the primary actors within enterprises concerning the negative externalities of innovation has contributed to this situation [6]. More and more enterprises and governments realize that innovations that harm either the economy or the environment cannot achieve truly sustainable development [7]. Green innovation serves not only to enhance the competitiveness of enterprises but also to mitigate the adverse environmental effects across the entire production cycle of their products [8]. This exemplifies a paradigm of high-quality development that achieves a mutually beneficial outcome for both the environment and the economy.
In existing research, the influencing factors driving enterprises to engage in green innovation activities can be broadly categorized into two main types. The first is external pressure. At the government level, enterprises’ revenue dependence on government customers [9], government subsidies to enterprises [10], and government environmental regulations can influence enterprises’ green innovation. However, it is crucial to consider both the stringency of these policies and the existing environmental conditions within individual enterprises [11]. Otherwise, the efficiency of corporate green innovation may differ significantly from expectations. At the market level, volatile market conditions [12], economic uncertainty [13], public environmental demands [14], and fluctuations in investor sentiment [15] can all have an impact. It is important to recognize that these factors can affect innovation in different dimensions, highlighting the multifaceted nature of their effects. Specifically, they can be divided into product, technology, process, organization, and so on. The second is internal pressure. On the one hand, enterprise green innovation necessitates substantial resource allocation. The presence of innovation capabilities, as a heterogeneous resource, enables enterprises to cultivate competitive advantages [16]. The access to production resources by an enterprise plays a pivotal role in shaping its decisions regarding green innovation. Previous research has primarily concentrated on examining the influence of cash flow and acquisition of human capital on enterprises’ green innovation activities [17-20]. On the other hand, corporate green innovation activities are also influenced by the personal characteristics of management. Factors such as gender, age, and educational background have been identified as potential determinants in shaping the propensity of managers to engage in green innovation efforts [21, 22], education [23], overseas background [24], work experience [25], political affiliation [26], social affiliation [27], and environmental awareness of executives [28, 29] have been demonstrated to exert an influence on corporate green innovation.
According to Schumpeter’s theory of innovation, innovation involves the recombination of production factors [30]. Enterprises possess a natural advantage in terms of innovation factor agglomeration by leveraging advanced labor, abundant resources, flexible organizational structure, and a keen market perception. According to Schumpeter, the role of the entrepreneur is to realize innovation and introduce “new combinations of factors of production”. In the context of the growing environmental and climate crisis, the requirements of green and low-carbon development gave innovation a deeper responsibility and mission.
Will the allocation of data elements through market mechanisms influence green innovation in enterprises? The unique characteristics of the data elements differentiate it from other production factors, enabling it to facilitate enterprise green innovation across multiple dimensions. Specifically, the immediacy of the data elements provides a guarantee for the timeliness of various environmental decisions of enterprises [31]. Enterprises can better perceive market changes and flexibly adjust their management structure [32]. Simultaneously, the rapid diffusion of data information also facilitates enterprises in gaining a better understanding of market demand and the government’s ecological protection requirements [33], to carry out green product innovation in an orderly manner [34]. The strong technical dependence on data elements forces enterprises to accelerate technological innovation and improve data storage and processing capabilities [35]. In the digital era, a strong data processing capability forms the cornerstone for enterprises to successfully embark on green innovation endeavors. The non-exclusivity of data elements further facilitates the allocation and utilization of elements among enterprises. It also promotes collaboration among different enterprises in the realm of environmental governance [36]. Moreover, the high degree of integration of data elements necessitates dependency on other traditional production factors to effectively allocate and utilize data as a resource. Optimizing the existing combination of production factors promotes the enterprise’s total factor green allocation [37]. This helps enterprises to form a new green total factor production chain and realize the value-added factor value of data. Ultimately, this process cultivates a distinctive green competitive advantage for the enterprise. Under the joint action of the above factors, enterprises can realize the innovation of green products, green technology, and environmental resource allocation. In this process, the collection, storage, processing, trading, and application of data by enterprises necessitate the establishment of robust market mechanisms within the data elements market. Additionally, it requires the cooperation of relevant regulations and systems to ensure a conducive environment for data-related activities [38].
Since 2014, China has been actively promoting the establishment of data elements markets. The current landscape comprises primarily government-led initiatives, such as the establishment of big data trading centers, as well as enterprise-led platforms that provide big data services. Since the Guiyang Big Data Trading Organization was approved and established in China in 2015, relevant data trading organizations have been set up in various places. This situation provides an exogenous shock for us to examine the impact of allocating data elements through market mechanisms on enterprise innovation. It offers an opportunity to test the effects of market-based data resource allocation on fostering innovation within enterprises. According to the IDC Worldwide Big Data and Analytics Spending Guide (IDC Worldwide Big Data and Analytics Spending Guide), the total global big data IT investment scale in 2022 will be about $247.1 billion. As a big country of big data IT investment, it is expected that China’s big data IT investment scale in 2027 is expected to reach 43 billion U.S. dollars, the size of about 8% of the total global investment. China’s five-year compound growth rate is about 21.5%, leading the world in growth rate. The presence of such initiatives suggests that China possesses notable advantages and potential in the development, utilization, and trading of data elements. Consequently, studying the progress of data resource development in China holds significant reference value and inspiration for other countries seeking to explore the value creation of data elements and advance the process of marketization in this domain.
Unlike developed market economies, China is at a stage of transition and development of a dualistic system. In this context, the government plays a crucial role in incentivizing green innovation in enterprises, due to the positive social externalities of such activities. However, there is a pressing need to activate and further leverage market mechanisms for green innovation within an efficient market framework. This paper aims to analyze the relationship between the market allocation of data factors and the green innovation activities of enterprises and explore the application of China’s data factor market construction in promoting sustainable development. Additionally, the paper systematically analyzes and empirically validates the mechanisms behind factor marketization and green innovation, shedding light on their internal logic. Finally, the paper provides new evidence that the establishment of data trading organizations has a significant impact on corporate green innovation, contributing to the existing empirical research on factor market allocation.
The paper is structured as follows: Section 2 presents the institutional background and theoretical analysis. Section 3 outlines the research design. Section 4 conducts the empirical analysis, encompassing benchmark regressions and dynamic effects tests. Section 5 presents a series of robustness tests. Section 6 provides furthe analysis, including mechanistic analyses and heterogeneity tests. Section 7 provides the research conclusions and policy implications.
Institutional Background and Theoretical Analysis
The Evolution of Market Allocation of Data Elements
Currently, China’s data elements market is still in the early stages of development. It commenced in 2015 with the issuance of the “Outline of Action for Promoting the Development of Big Data” by the State Council. This policy aimed to direct resource flows towards the concentration of the big data industry and encourage enterprises to undertake digital transformation. However, given the circumstances at that time, the program was primarily pursued to establish a foundation of hardware infrastructure for future digitization endeavors. It did not effectively regulate the lack of data elements, market systems, and rules. Of course, this had a lot to do with the fact that China’s digital transformation was still in an exploratory and experimental stage. Consequently, during this stage, the process of enterprises acquiring and utilizing data elements has revealed certain challenges. These challenges include inadequate circulation of data elements, limited utilization of data utility, and difficulties in identifying instances of data misuse, among others. In April 2020, the State Council of China released the Opinions on Building a Better Institutional Mechanism for Market-based Factor Configuration. This document put forth the proposal to recognize data as the fifth major factor of production, on par with land, labor, capital, and technology. This opinion gives data the status and attributes of a “production factor” and clarifies the importance of data elements in China’s market economy. Subsequently, the State Council of China released the Opinions on Accelerating the Improvement of the Socialist Market Economic System in the New Era in May 2020, followed by the Opinions on Building a Data-Based System and Enhancing the Utilization of Data Elements in December 2022. These opinions put forth concrete proposals for the market-based construction of data elements. They encompass various aspects, including data information management, the definition of data ownership, and data privacy protection. Indeed, in China, the current legislation and relevant judicial interpretations do not provide a clear definition and specification of data resource ownership, leading to a lack of a robust legal framework in this regard. This situation has hindered the development of the data elements market. At the micro-enterprise level, on the one hand, enterprises owning data elements are worried about their data being infringed upon or leaked. They are reluctant to put their data elements into the market for trading, which reduces the supply of market elements and the efficiency of innovation. On the other hand, some illegal enterprises take advantage of legal loopholes to obtain and use data elements illegally through the “black” and “gray” industries. The absence of a clear definition and specification of data resource ownership not only undermines the competitive market environment but also encroaches upon the legitimate rights and interests of data resource owners. It has created an uncertain and ambiguous landscape where the rights and responsibilities of data elements are not sufficiently protected.
As the primary entity responsible for facilitating the market allocation of data elements, data trading organizations play a crucial role in connecting the supply and demand sides of data. They enhance the efficiency of data allocation, ensure the protection of data ownership, and regulate the functioning of the market system. These organizations serve as important intermediaries in enabling the smooth and efficient exchange of data elements. There are generally two types of data transactions in the market: peer-to-peer transactions and platform transactions. With the increasing volume of transactions, the drawbacks of peer-to-peer transactions are becoming more and more prominent. Many illegal transactions, such as the “dark net” and “black industry chain”, are hidden in the peer-to-peer transaction process [39, 40], which seriously disrupts the normal and orderly development of the factor market. Platform trading, with its standardized and transparent trading process, has become the mainstream way of factoring market development [41]. In 2015, the Guiyang Big Data Trading Organization was approved to be established, which is the first data trading organization in China. After that, big data trading centers (platforms and institutes) were established one after another across China. By the end of June 2023, there were more than 40 data trading organizations initiated, led, or approved by the government across China. Among them, the transaction scale of head data trading organizations such as Beijing International Big Data Trading Organization and Shanghai Data Trading Organization has reached the billion-dollar level, showing explosive growth. While the transaction scale of China’s data trading organization has exhibited rapid growth, it is important to acknowledge that these platforms are predominantly concentrated in economically developed regions. This highlights the growing disparity in development levels among different regions within China. In the process of enterprises’ daily data collection and use, they still face many problems, such as inefficient data circulation, mismatch between data supply and demand, poor market development, and limited technological innovation [42, 43]. The construction of the data elements market still needs to be improved in many aspects, such as systems, technology, society, and culture.
Data Elements and Corporate Green Innovation
The market allocation of data elements can assist in overcoming the barrier of information asymmetry that enterprises may encounter before entering the market. It also acts as a safeguard against the concentration of data elements in the hands of government entities or industry giants. By enabling a market-driven approach to data resource allocation, it promotes fair competition and prevents monopolistic control over data elements. Further, enterprises can accurately mine market demand through a large amount of data analysis [44]. Combined with the environmental protection requirements of market development, they can innovate products and services with green competitive advantages [45]. Once enterprises enter the market, the market allocation of data elements offers several benefits. Firstly, it allows enterprises to access market information freely, enabling them to adapt to changes in the competitive environment more effectively. Secondly, through environmental data analysis and other means, enterprises can proactively anticipate the environmental regulatory requirements set by regulatory authorities. This early prediction empowers enterprises to react promptly and comply with regulatory standards [46, 47]. Research has demonstrated that engaging in early environmental governance can effectively reduce firms’ compliance costs associated with environmental regulation. By proactively addressing environmental concerns and implementing sustainable practices, firms can minimize the financial burden and operational disruptions that may arise from non-compliance or retroactive adjustments to meet regulatory standards [48]. This can potentially reduce future expenses associated with environmental rectification and compensation [49]. Moreover, it plays a pivotal role in stimulating the green innovation capacity of enterprises and fostering the innovation and application of environmentally friendly technologies and products [50].
It should be noted that enterprise green innovation is different from general productive activities. It is characterized by elements such as high risk, substantial investment requirements, and environmental externalities [51]. At the same time, the public goods characteristics of environmental resources and limited rationality make the economic subject’s environmental awareness low [52]. This leads to the lack of green innovation willingness of early managers during their tenure and the formation of the phenomenon of belittling green innovation activities, or “more words, less action”. Due to management’s shortsightedness and profit-seeking mindset, there is a risk that they may prioritize short-term gains over long-term benefits. This can result in over-expansion and the abandonment of innovative activities that contribute to the high-quality and sustainable development of the enterprise. Consequently, governments are compelled to implement environmental regulations in order to prevent and control environmental pollution.
Market allocation is generally considered more efficient than administrative interventions when it comes to promoting green innovation activities within enterprises [53]. Under the framework of market allocation of data elements, fair competition among economic agents has become the core principle of market operation [54]. The opening and circulation of data between sectors not only makes the connection between sectors stronger. Moreover, it increases the transparency among market subjects. The non-market intervention behaviors that distorted the market order in the past will no longer be effective and will even damage the existing competitiveness of enterprises. It has been shown that the deviation of factor costs from market costs due to maladministration is often accompanied by rent-seeking corruption and arbitrage [55]. Rent-seeking activities generate excessive returns, resulting in a misalignment of enterprise resources and a decline in the efficiency of market allocation [56]. Especially in innovation activities characterized by high input and long cycles, the crowding-out effect of corporate rent-seeking on them is much larger than that of general economic activities. At the same time, problems such as barriers to information communication and low market transparency acquire productive resources too long and costly, leading to the poor circulation of key factors necessary for green innovation [57]. These non-market means sometimes reduce the allocation and utilization efficiency of enterprises’ environmental protection funds, and enterprises tend to use their limited funds to maintain their existing production operations and reduce their investment in green R&D and innovation [58]. The market allocation of data elements mitigates direct government intervention and enhances the efficiency of allocating green production factors. By employing market-oriented mechanisms, it reduces friction costs and efficiency losses arising from imperfect competition. Consequently, limited data elements are channeled into research and development as well as innovation endeavors in the realm of green products.
The market allocation of data elements entails that data prices adhere to the law of value, whereby prices fluctuate around their intrinsic worth. Data as a commodity, on the other hand, has a price that deviates from its value. The extent of this deviation relies on the alignment between the value of data and the demand for data. In different demand scenarios, there is a big difference in the recognition of the utility of data by enterprises due to factors such as data collection and data processing. Regarding the inputs and outputs of green innovation, when the price of data commodities is lower than their intrinsic value, enterprises can acquire and utilize data at a reduced cost, thus lowering the threshold for engaging in green innovation activities. Conversely, it reduces the return on innovation activities. When it comes to selecting a green innovation model for a firm, if the value of a product derived from data processing exceeds its price, the firm is more likely to opt for exploratory and disruptive innovation approaches [59]. In other words, firms will be willing to accept green innovation activities with relatively high levels of risk and return. When the price of data is higher than its value, firms are more inclined to invest in stable green innovation activities. Examples include improvements and incremental innovations based on existing environmental technologies [60]. The market allocation of data elements can establish a utility-sensitive price formation mechanism, which guides enterprises to independently choose and engage in R&D and innovation activities through the “invisible hand”. This contributes to the augmentation of the green innovation atmosphere and vitality within enterprises across the entire market. Simultaneously, as the data elements market continues to advance, it leads to a reduction in the level of information asymmetry between shareholders and management [61]. This helps to alleviate the corporate agency problem. In this environment, management’s business inertia will be significantly reduced and show a positive willingness to innovate [62].
Based on the aforementioned analysis, we can summarize that the market allocation of data elements has several benefits. It reduces government administrative intervention and enables enterprises to access green innovation resources through fair competition. Furthermore, it enhances the allocation and utilization efficiency of production factors within enterprises and stimulates their intrinsic motivation for innovation. Consequently, we propose the following research hypothesis:
H1: All other conditions being equal, the allocation of data elements through market mechanisms can promote enterprise green innovation.
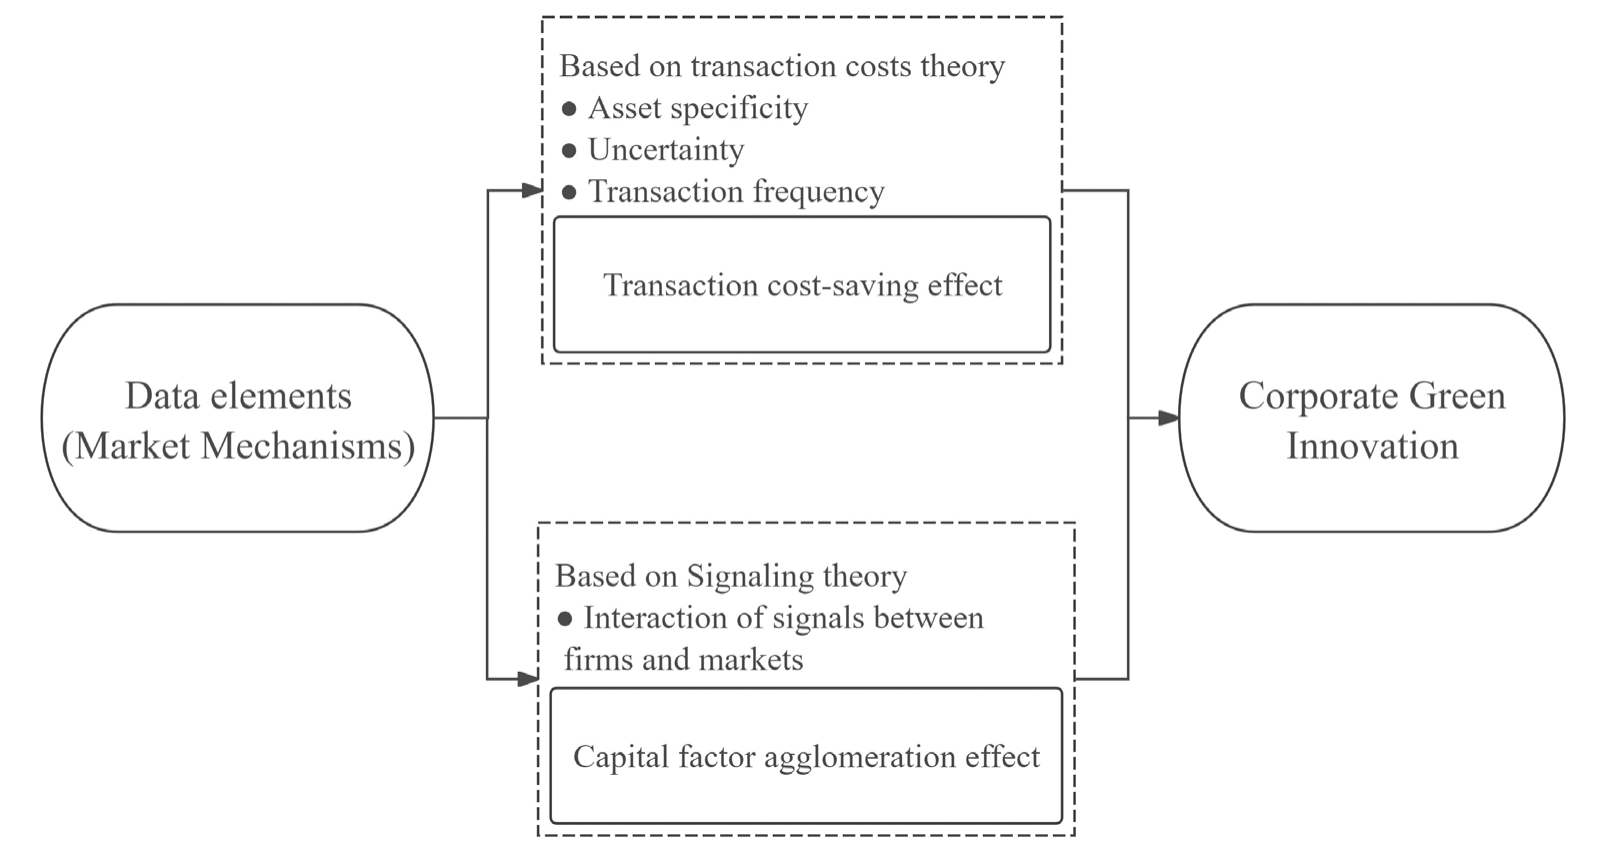
Williamson’s theory of transaction costs states that asset specialization, uncertainty, and frequency of transactions are important factors affecting transaction costs [63, 64]. The purpose of enterprises adopting different organizational methods is to save transaction costs. The market allocation of data elements has the potential to mitigate information asymmetry between data suppliers and demanders, lower transaction costs for enterprises, and facilitate the establishment of cost and risk control systems within enterprises [65]. This can enable enterprises to focus their resources and efforts on green innovation.
In the context of asset specificity, data elements possess non-competitive attributes and can be processed flexibly to enhance their value based on specific demand requirements. Specifically, the market allocation of data elements implies that data elements are widely circulated in the market, and enterprises can select data according to the supply and demand mechanism [66]. This facilitates the enhancement of enterprises’ efficiency in acquiring the necessary data for green innovation and reduces search costs in the process. Meanwhile, the continuous enrichment of data services can provide more materials, tools, and platforms for enterprises’ green innovation. This helps to stimulate enterprises’ green innovation thinking and improve their internal innovation capability [67].
In terms of uncertainty, the allocation of data elements through market mechanisms establishes a utility-sensitive price formation mechanism. Data prices are determined by the extent to which enterprise demand aligns with the value of the data, which, in turn, aids in reducing communication costs for enterprises. In addition, along with the introduction of relevant data trading regulations and industry management systems, the allocation of data elements through market mechanisms can establish a guarantee mechanism for the property rights, protection, security, and privacy of data elements, which can reduce the risk costs of enterprises [68]. A good data pricing and institutional protection environment can save production factor acquisition costs for enterprise green innovation and provide good tenure protection for enterprise green innovation inputs and outputs.
Regarding transaction frequency, the market-based allocation of data elements facilitates the efficient circulation of these resources. Through a network platform, data elements are interconnected and allocated, thereby enhancing the security and convenience of enterprise data transactions [69]. As a result, this reduction in supervision costs for enterprises and the mitigation of the “crowding out effect” on green innovation inputs can be achieved. Additionally, the exchange and collaboration of data elements among enterprises offer diversified opportunities for collaborative innovation [70]. This broadens the scope of green innovation for enterprises and facilitates cross-sector and cross-industry collaboration in the field of green innovation.
Signaling theory suggests that firms can obtain or transmit preferences and intentions from or to the market through “signals” and achieve potential gains [71]. Within the framework of market allocation of data elements, enterprises can analyze the data circulating in the market. This analysis enables them to gain insights into the actual demand and consumption preferences of society for green products and services. Consequently, this process effectively transmits demand signals that drive green innovation within enterprises and stimulate their intrinsic motivation for innovation. Simultaneously, for firms, data processors can analyze innovation data to proactively anticipate the scale of costs and profitability associated with green innovation. This helps to increase enterprises’ confidence in green innovation and signals to the market the demand for innovation capital. Further, market trading of data elements can break information asymmetry, and enterprises engaging in green R&D and innovation activities can signal to the capital market the potential advantages of enterprises in environmental protection. This attracts green capital from bond and equity markets towards companies actively involved in green innovation. Additionally, the information regarding enterprises’ green innovation spreads rapidly within the data market and garners monitoring and attention from the broader society [72], which helps enterprises truly engage in environmental protection and innovation to obtain the recognition and support of market entities. In addition, data circulation makes enterprise innovation activities more in line with social needs and expectations. By engaging in open data sharing, cooperation, and exchange, enterprises can establish effective communication channels with the government, society, and other stakeholders. This facilitates the alignment of innovation outputs with the green needs of society, ensuring that they are well-suited to address environmental concerns [73]. Better social externalities can increase the probability of enterprises obtaining subsidies from government funds [74]. The positive signals emitted by corporations in their pursuit of green innovation can foster capital agglomeration, attracting financial resources and providing stable financial support for such endeavors.
Based on the above analysis, we further propose the following hypothesis:
H2: All other things being equal, the allocation of data elements through market mechanisms can promote corporate green innovation by reducing corporate transaction costs.
H3: All other conditions being equal, the allocation of data elements through market mechanisms can promote capital agglomeration and enterprise green innovation.
Certainly, based on the aforementioned theoretical analysis, we can represent the influence mechanism of market-based allocation of data elements on enterprise green innovation in the form of Fig. 1.
Research Design
Sample Selection and Data Sources
In our study, we have undertaken a quasi-natural experiment, focusing on the establishment of data trading organizations in China after 2014. The initial sample for our research includes all companies listed on the Shanghai Stock Exchange and Shenzhen Stock Exchange, specifically those categorized as A-share companies, spanning the period from 2012 to 2021. To explore the causal relationship between the marketization of data elements and corporate green innovation, we have constructed a multi-period Difference-in-Differences (DID) model. This model allows us to assess the impact of data elements marketization on corporate green innovation. To ensure the validity of our analysis, we have manually collected and organized information regarding the timing and location of the establishment of data trading organizations in China after 2014. This data has been matched with firm-level information. Certain exclusion criteria have been applied to refine our sample. Specifically, we have excluded firms in the banking and finance industry, as well as special treatment (ST and *ST) firms. Additionally, firms with gearing ratios exceeding 1, firms listed for less than one year, and firms with missing values for core explanatory variables have been excluded. After implementing these criteria, our final research sample comprises a total of 30,082 observations from 3,793 listed companies. Financial data of the firms have been sourced from the China Stock Market & Accounting Research (CSMAR) Database, while data on firms’ green patents have been obtained from the Chinese Research Data Services Platform (CNRDS). Information about the establishment of data trading organizations has been manually collected by our team of researchers.
Model Design and Definition of Variables
To test the impact of the establishment of data trading organizations on firms’ green innovation, we constructed a multi-period difference-in-difference (DID) model with firms’ green innovation level as the dependent variable:
In Equation (1), Greeni,t denotes the level of green innovation of enterprises, which is measured by the natural logarithm of the number of green patents acquired by the company in the current period plus one, drawing on the existing literature [7, 75]. Some studies have chosen to use the number of green patent applications to measure the level of green innovation of firms [76, 77], taking into account the fact that patent granting is affected by the administrative efficiency of industries or government agencies. We take into account biases in patent application and utilization [78-80]. In subsequent robustness tests, the direction of effect and significance of firms’ innovation level measured by the number of green patent applications is consistent with the results measured by the number of firms’ patent acquisitions. Treati denotes the dummy variable for the establishment of the data trading organization; when the location of the listed company is the same as the location of the data trading organization (the treatment group), it is assigned as 1. The rest of them are assigned as 0. Timet is the dummy variable for the time before and after the establishment of the data trading organization. The value of Timet is assigned to 1 for the year and later for the firms in the region where the organization is set up, and 0 for the rest of the firms. β, the coefficient of the cross-multiplier term Timet×Treati, reflects the average change in the level of green innovation of the firms in the region where the data trading organization is set up, compared with that of the region where the data trading organization is not set up. Xi,t is the control variable, δi represents the fixed effects of firms that do not change over time, μt controls for year fixed effects, and εi,t is the random error term. Our parameter of interest is β. If β is significant, it can be inferred that the establishment of a data trading organization has a valid impact in terms of firms’ green innovation.
In the selection of control variables (Xi,t), we refer to the existing studies, and at the firm level, we control the following variables: the number of years the firm has been listed (Listing Time), the size of assets (Size), the return on total assets (ROA), the gearing ratio (Lev), the proportion of shares held by the first largest shareholder (Top1), the size of the board of directors (Board), the ratio of independent directors within a company (Indr), and the remuneration of executives (Wage). In addition, at the regional level, we added the level of economic development (GDP) and industrial structure (Structure) as control variables. It should be noted that in Schumpeter’s hypothesis, the larger the firm size, the more efficient the technological innovation [81]. This provides a better basis for using asset size as a firm-level control variable. The specific definitions of the variables are shown in Table 1.
Descriptive Statistics of Variables
Table 2 presents the descriptive statistics of the key variables. Over the period from 2012 to 2022, the average number of green patents obtained by listed enterprises is 4.929, with a standard deviation of 27.129. This indicates substantial variation in the number of green patents obtained by enterprises, characterized by a left-skewed distribution. To address the issue of skewed data distribution, a logarithmic transformation was applied by adding 1 to the number of patents obtained, resulting in a mean value of 0.735 for the transformed data. This transformation helps mitigate the bias that skewed data distribution may introduce to the results.
Results and Discussion
Dynamic Effects Test
We draw on the event analysis proposed by Jacobson et al. in 1993 [82] to compare changes in firms’ green innovation activities before and after the establishment of data trading organizations. For this purpose, the following model is constructed:
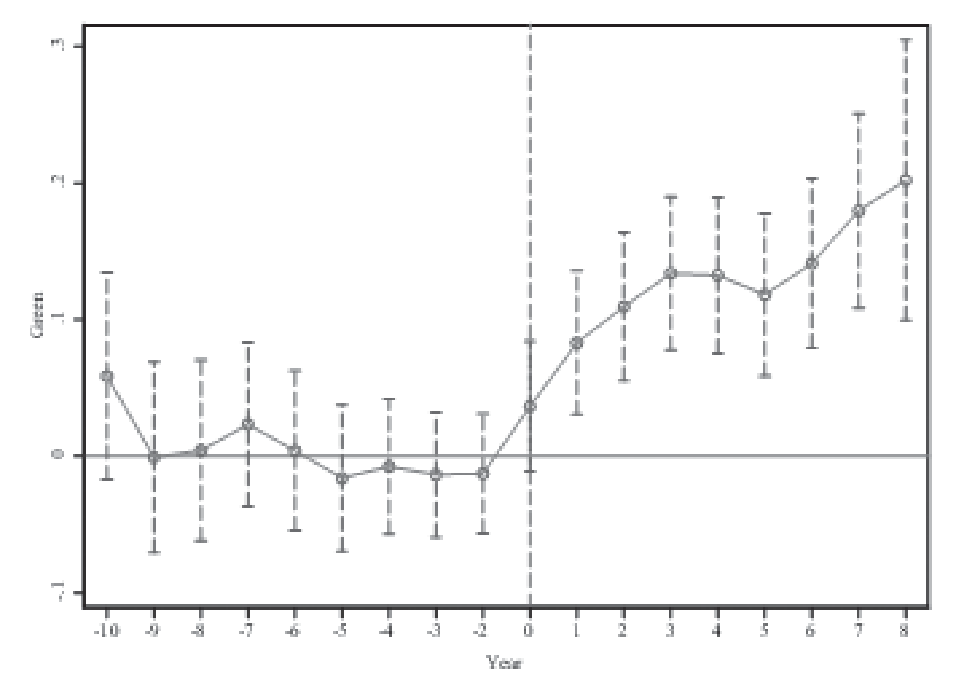
In Equation (2), to avoid the problem of multicollinearity, we artificially set the previous period in which the data trading organization is established as the base period. The coefficient βj reflects the impact on firms’ green innovation before and after the establishment of the data trading organization, and the definitions of the other variables are the same as in Equation (1).
Fig. 2 reports the dynamic impact of data trading organization establishment on firms’ green innovation at a 95% confidence interval. It is easy to see that the estimated coefficient βj has a relatively flat change before the establishment of data elements and does not pass the significance level test at the 95% confidence interval. This indicates that there was no statistically significant disparity in green innovation between firms in the treatment and control groups before the establishment of the data trading organization. After the establishment of the data trading organization, the estimated coefficient βj shows a significant upward trend and passes the significance test. This indicates that the establishment of data trading organizations can significantly enhance the green innovation capability of enterprises in the treatment group.
Table 1.
Representation and measurement of control variables.
Table 2.
Descriptive statistics of the main variables.
Baseline Regression Results
To verify the impact of the allocation of data elements through market mechanisms on firms’ green innovation, we first regress the model (1). Table 3 reports the baseline regression results. Column (1) shows the regression results without adding control variables and without controlling for time and individual fixed effects. The results show that the allocation of data elements through market mechanisms can significantly promote firms’ green innovation, and the regression coefficients are significant at the 1% level. Columns (2), (3), and (4) add control variables to the regression. Column (2) controls for year-fixed effects, and column (3) controls for firm-fixed effects. The regression coefficients all pass the significance test at the 1% level. It indicates that the allocation of data elements through market mechanisms can significantly promote green innovation in enterprises. Column (4) controls both year and firm fixed effects, and the regression coefficient of Timet×Treati is 0.077, which passes the significance test at the 1% level. It is further verified that the allocation of data elements through market mechanisms can improve the level of green innovation of enterprises. Specifically, after the establishment of data trading organizations, the number of green patents acquired by enterprises increased significantly. Preliminary verification of H1 in the hypothesis part of the research.
Results and Analysis of the Robustness Tests
Placebo Testing
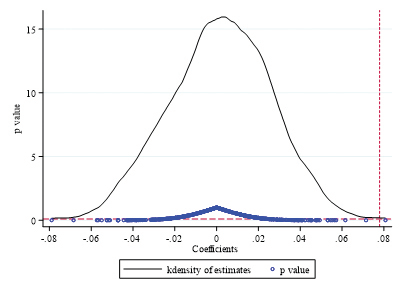
To rule out the possibility that the effect of the establishment of data trading organizations on firms’ green innovation is influenced by other unobservable variables, we conduct placebo tests. We use a randomized disruption of the treatment and control groups to observe whether the effect of the allocation of data elements through market mechanisms on firm innovation persists. Specifically, we select 2,000 firms from 3,793 firms as the treatment group, i.e., Treati is assigned a value of 1. The rest are used as the control group and Treati are assigned a value of 0. The purpose of the random sampling is to ensure that the pseudo-treatment variables that we constructed do not have a significant effect on firms’ green innovation. We substitute the above treated data into the model (1) to test. Through 500 times of random sampling, we find that the effect of data trading organizations on corporate green innovation is no longer significant. Fig. 3 shows the distribution of regression coefficients of Timet×Treati after 500 times of random treatment. The coefficients of the variable Timet×Treati exhibit a distribution that is centered around 0, indicating their values are significantly smaller compared to the true value of 0.077 estimated in the benchmark regression. This observation suggests that the measurement error associated with our original treatment group is within an acceptable range. Consequently, it further substantiates the robustness of our research conclusions.
Table 3.
Baseline regression results.
PSM-DID
The establishment of data trading organizations in China is often related to the degree of local digital transformation and thus is not random. To mitigate the potential issue of endogeneity arising from sample self-selection bias, we employed a methodology inspired by Luo et al.’s research [83] and chose the propensity score matching method for the robustness test. Specifically, we conduct a logit regression on the interaction term (Timet×Treati) with all control variables as covariates. We analyzed to examine the potential impact of control variables on the probability of a firm being located in a region where a data trading organization is established. Second, based on the matching variables, the propensity score is calculated. Finally, we employed the nearest neighbor matching method to ensure a case-by-case matching approach, aiming to minimize any significant differences between firms in the treatment and control groups. We test the PSM nearest neighbor 1:4 matched samples by substituting into the model (1), and the coefficient of the interaction term Timet×Treati is 0.061 and significantly positive at the 1% level. The regression results are reported in Column (1) of Table 4. Even after addressing the issue of self-selection bias in firms’ samples through the Propensity Score Matching (PSM) technique, the results indicate that the market allocation of data elements continues to have a positive impact on promoting green innovation in enterprises.
Exclusion of Other Policies in the Same Period
Regarding the independent variables, our analysis takes into consideration the potential confounding effects of other Chinese digitization policies on the role of market allocation of data elements. Similarly, for the dependent variable, we account for the potential influence of environmental regulations on firms’ green innovation within the study context. These factors, if not properly addressed, can introduce bias in estimating the net effect of data trading organization establishment on firms’ green innovation. To mitigate this bias, we simultaneously control for the impact of the Chinese government’s National Comprehensive Big Data Pilot Zone policy implemented in 2016, the environmental protection tax introduced by the Environmental Protection Tax Law of the People’s Republic of China in 2018, as well as the impact of resource tax collection according to the Resource Tax Law of the People’s Republic of China enacted in 2019.
Specifically, for the policy of the National Comprehensive Pilot Zone of Big Data, we construct the policy variable (Big-Data) of the National Comprehensive Pilot Zone of Big Data by referring to the construction method Timet×Treati in the model (1). It should be noted that Timet×Treati in Eq. (1) is a multi-temporal DID, while the policy shock year of big data is only 2016. For the impact of enterprise environmental protection tax and resource tax collection, we obtain the environmental protection tax paid by enterprises since 2018 and resource tax paid since 2020 from the detailed account of “tax payable” of the sample enterprises. We standardize the variables using the total assets of enterprises to measure environmental tax collection (Envtax) and resource tax collection (Restax). All three are added to the regression model as control variables for regression analysis. The regression results are shown in column 2 of Table 4. The coefficient of the interaction term Timet×Treati is 0.078, which is significantly positive at the 1% level; meanwhile, the impact of resource tax and environmental protection tax on enterprises’ green innovation is also significantly positive. While verifying the rationality and effectiveness of the interference policy selection, it further proves the robustness that the allocation of data elements through market mechanisms promotes green innovation in firms.
Other Robustness Tests
To address the issue of endogeneity caused by a lag in the acquisition of green patents by enterprises, we employ two solutions. Firstly, we use the number of corporate green patent applications as a proxy for the number of patents acquired. Specifically, we substitute the logarithmic measure of corporate green innovation, represented by the current period’s number of corporate green patent applications plus one (green), into Model (1) for testing purposes. Secondly, we shift the dependent variable one period ahead (Green_). To mitigate the potential bias arising from the simultaneous equation, we also shift the data of all control variables one period ahead. The regression results of these two approaches are presented in Column (3) and Column (4) of Table 4. Notably, the coefficients of the interaction term Timet×Treati are all significantly positive.
Table 4.
Robustness test.
In addition, we will take into account the possible spatial correlation of the error terms and cluster the standard errors into the joint dimension of “City-Year”. The regression results are shown in column (5) of Table 4. The coefficient of the interaction term Timet×Treati is 0.077 and significant at the 5% level. The coefficient is consistent with the estimate of 0.077 from the benchmark regression. This indicates that the robustness test is passed.
Further Analysis
Mechanism Analysis
The theoretical analysis in the previous section concludes that the allocation of data elements through market mechanisms promotes enterprise green innovation through two mechanisms: reducing enterprise transaction costs and guiding capital factor agglomeration. For this reason, we adopt a two-step mechanism test idea, respectively, from the transaction cost-saving effect and capital factor agglomeration effect, two aspects of the allocation of data elements through the market mechanisms to influence the role of the enterprise green innovation mechanism. We constructed the following mechanism test model based on model (1):
In Equation (3), Machanismi,t is the mechanism variable, and the definitions of the specific variables will be presented separately below. Other variables are the same as in model (1).
Transaction Cost Savings Effect
The allocation of data elements through market mechanisms has the potential to enhance the efficiency of resource allocation within enterprises, leading to resource and energy savings that can be redirected towards green innovation initiatives. To measure the transaction costs of enterprises, we refer to the study of Li et al. [84] and choose the management expense ratio (Man_fee) and the sales expense ratio (Sale_fee) as the proxy variables for the transaction costs of enterprises. The regression results are reported in Columns (1) and (2) of Table 5. The results show that the estimated coefficients of the interaction term Timet×Treati are negative. In the regression analysis with Man_Fee as the dependent variable, the coefficient of the interaction term is found to be statistically significant at the 5% level. Similarly, in the regression analysis with Sale_ Fee as the dependent variable, the coefficient of the interaction term is statistically significant at the 1% level. These results indicate that the allocation of data elements through market mechanisms has a favorable impact on reducing transaction costs, thereby fostering green innovation in enterprises.
Table 5.
Mechanism analysis.
Capital Factor Agglomeration Effect
Allocation of data elements through market mechanisms can guide the flow of market capital to firms engaged in green innovation activities and provide a stable source of capital for firms’ green innovation. We use firms’ long-term borrowing plus one (Longdebt) to take the natural logarithm to measure firms’ access to capital from the debt market. Tobin’s Q is used to measure the value of enterprises in the stock market. The above two indicators are used as proxy variables for firms’ capital factor agglomeration. The regression results are shown in columns (3) and (4) of Table 5. It can be seen that the estimated coefficients of the interaction term Timet×Treati are positive. In the regression analysis where Longdebt is the dependent variable, the coefficient of the interaction term is found to be statistically significant at the 1% level. Furthermore, in the regression analysis with Tobin’s Q as the dependent variable, the coefficient of the interaction term is statistically significant at the 5% level. These findings suggest that the allocation of data elements through market mechanisms has a positive influence on the agglomeration of capital factors, consequently fostering green innovation in enterprises.
Heterogeneity Analysis
Degree of Factor Market Development
The level of factor market development in the location of an enterprise emerges as a crucial factor influencing the extent to which data elements contribute to value creation. The level of marketization of factors of production signifies the degree of effectiveness in price formation mechanisms, allocation efficiency, and elasticity of factor supply. In general, a higher level of factor marketization facilitates the smooth circulation of data elements, enabling their full value realization. In this context, we draw upon the study conducted by Fan et al. [85]. To assess the level of factor market development, we employ the factor marketization index of the province where each company is situated. This index serves as a matching variable that aligns with the enterprise data, enabling us to evaluate the degree of factor marketization in the corresponding region. The specific data are from the report of the National Economic Research Institute (NERI) in Beijing. The report’s data range is limited to the years 1997-2019. To account for the years 2020-2022, we extrapolate the data using the average growth rate observed across all years. The regression results, grouping the degree of factor market development by median, are presented in Columns (1) and (2) of Table 6. Specifically, Column (1) displays the regression results for firms located in regions with a low degree of factor market development, while Column (2) presents the regression results for firms located in regions with a high degree of factor market development. When considering regions with a low degree of factor market development, the coefficient for the impact of data trading organization establishment on green innovation in enterprises is estimated to be 0.049, which is statistically significant at the 5% level. Conversely, in regions characterized by a high level of factor market development, the estimated coefficient for the impact of establishing a data trading organization on green innovation in enterprises is 0.079. Importantly, this coefficient is statistically significant at the 1% level of significance. The difference between the two coefficients is 0.030, and the above results indicate that the value creation role of data elements is stronger when the factor market is better developed.
Table 6.
Heterogeneity analysis.
Level of Data Property Rights Protection
The non-competitive and low-cost replicability of data poses the challenge of determining and protecting property rights for the development of data resource markets. Data ownership is the core of the bundle of data property rights. Only when data ownership is clearly defined and protected can market activities such as the alienation of the right to use data, the exercise of the right to trade, and the realization of the right to income be carried out safely and stably [86, 87]. Although individual users create great value for enterprises by contributing data, individuals are unable to obtain corresponding data remuneration. At the same time, under the guidance of interests, unscrupulous elements carry out data trading activities such as the “gray industry chain”, which seriously infringes on the privacy of data owners [88]. The aforementioned phenomena pose obstacles to the well-regulated development of the data elements market. Simultaneously, externalities exist in the green innovation behavior of enterprises. Enterprises engaged in independent green innovation face challenges in realizing the anticipated benefits of their innovation efforts due to the occurrence of free-riding behavior among other enterprises. This will likewise affect the incentives of enterprises to carry out autonomous innovation. Therefore, we draw upon the study conducted by Li et al. [89] and employ the number of intellectual property trial closures in prefecture-level cities, which will be matched with the enterprise data. This measure serves as an indicator of the extent to which intellectual property rights are safeguarded. The data comes from the number of intellectual property-type trial closures heard by the People’s Courts of each municipality included in the judicial case database of PKU Law, which is manually organized by the researchers. The median was used to categorize the level of intellectual property protection into two groups: high and low. The regression results for firms with different levels of location intellectual property protection are presented in Columns (3) and (4) of Table 6. Specifically, Column (3) displays the regression results for firms located in regions with poor intellectual property protection, while Column (4) showcases the regression results for firms situated in regions with better intellectual property protection. It can be seen that the regression coefficient of the interaction term Timet×Treati is not significant for firms with poorer location intellectual property protection. The coefficient of the influence of allocation of data elements through market mechanisms on green innovation of enterprises with better intellectual property protection is 0.091 and significant at a 1% level. The difference between the two sets of coefficients is 0.65, and the aforementioned analysis demonstrates that the marketization of data elements plays a more prominent role in regions characterized by a high level of data intellectual property protection.
Size of the Enterprise
Based on the perspective of firm innovation, the Schumpeter hypothesis suggests that firms with large firm sizes are more innovative than firms with small sizes. Therefore, we use the median firm size (Size) to categorize the firms in the sample into two groups: large and small. The regression results are presented in columns (5) and (6) of Table 6. The results show that in small-sized firms, the coefficient of the effect of the establishment of data trading organizations on firms’ green innovation is 0.051 and significant at the 5% level. For large firms, the regression coefficient of the interaction term Timet×Treati is 0.082 and significant at the 1% level. The disparity between the two regression coefficients amounts to 0.031. Our study supports Schumpeter’s hypothesis from the perspective of data elements. The findings substantiate the assertion that as enterprise size increases, the role of market-based allocation of data elements in driving green innovation becomes increasingly prominent.
Level of Competition in the Industry
According to the Schumpeterian hypothesis, there is a positive relationship between monopoly and firm innovation. When competition in an industry is intense, profits are diluted, leading to a lack of innovation. To measure the intensity of competition, this paper uses industry concentration, specifically the market share of the largest firms in the relevant market. The sample firms are divided into two groups based on industry concentration (high and low) using the median as the cutoff point. Higher industry concentration indicates a higher level of monopoly power and a lower degree of competition within the industry. Conversely, lower industry concentration suggests a higher degree of competition. The regression results, presented in columns (7) and (8) of Table 6, indicate that the effect of market allocation of data elements on firms’ green innovation is not significant in firms with high industry competitive intensity. However, in firms with low industry competition intensity, the impact coefficient is 0.126 and passes the significance test at the 1% level. This finding further supports the Schumpeterian hypothesis, suggesting that the establishment of data trading organizations has a stronger impact on corporate green innovation in industries with higher competition intensity.
Conclusions and Policy Implications
Conclusions
This study focuses on measuring corporate green innovation through the acquisition of green patents by listed companies in China’s Shanghai and Shenzhen markets from 2012 to 2022. By considering the establishment of data trading organizations as an exogenous shock, a multi-temporal shock DID (difference-in-differences) model is employed to examine the impact of the allocation of data elements through market mechanisms on corporate green innovation. The results indicate that the establishment of data trading organizations significantly promotes corporate green innovation, and this conclusion remains robust even after conducting various robustness analyses. One possible mechanism underlying this effect is that the allocation of data elements through market mechanisms can effectively reduce transaction costs for firms and facilitate the agglomeration of capital factors. Furthermore, the analysis of heterogeneity reveals that the influence of market-based data resource allocation on green innovation is more significant in firms situated in regions with advanced factor market development and robust intellectual property rights protection. Additionally, larger firms and those operating in less competitive industries also experience a stronger impact.
The possible marginal contributions of our study are: Firstly, we theoretically establish the intrinsic connection between the allocation of data elements through market mechanisms and firms’ green innovation by including data within the framework of production factors. This theoretical inclusion highlights the fundamental relationship between these factors.
Secondly, we systematically analyze the mechanism through which the allocation of data elements through market mechanisms influences firms’ green innovation activities by combining transaction cost theory and signaling theory. This analysis enhances the existing research on these theories regarding factor market allocation, providing a comprehensive understanding of the underlying dynamics. Furthermore, in the heterogeneity analysis, we examine the Schumpeterian hypothesis, which posits a positive relationship between firm innovation and both firm size and industry competitive intensity. This additional analysis further validates the research findings and expands the scope of the theory’s applicability.
Lastly, our study provides empirical support for the positive impact of the establishment of data trading organizations on corporate green innovation. This finding not only contributes to the existing literature but also offers new evidence for the sustainable development of enterprises, particularly in developing countries.
Policy Implications
For data trading organizations, it is important to clearly define their role as data market operators. They should maintain neutrality and work towards strengthening and enhancing the trust relationship between data suppliers and demanders. Additionally, efforts should be made to enrich the types of data products and services offered to address the issue of mismatch between data supply and demand.
For governments, it is essential to adopt a targeted approach to guidance for regions and industries with varying resource endowments. Each region is at a different stage of factor market development, and policies should be tailored to their specific development objectives and prevailing circumstances. Likewise, differentiated regulatory measures should be implemented to address the specific characteristics of monopolistic and competitive industries.
For enterprises, it is significant to actively engage in data trading activities and share data dividends. By harnessing the transaction cost-saving effect and resource factor agglomeration effect of the data factor market, enterprises can drive green innovation. Breaking down data silos and leveraging data analysis results to empower business capabilities should be the guiding principle. This approach will activate the intrinsic motivation of enterprises to engage in data sharing and trading.

