

Introduction
The earth is currently facing numerous environmental crises, including unsustainable consumption and production that exacerbate climate change, natural degradation, loss of biodiversity, environmental pollution, and increased waste [1]. The climate crisis has led to increasing extreme weather events and has caused trillions of dollars in economic losses. Ecosystem degradation has affected 40% of the world’s population, causing approximately one-third of the world’s farmland to deteriorate, approximately 87% of inland wetlands to disappear, and one-third of commercial fishing resources to be overfished. Air pollution causes approximately seven million premature deaths each year, and the amount of plastic waste in aquatic ecosystems continues to increase [2]. Meanwhile, the United Nations Environment Program has announced that the world is using resources equivalent to 1.6 earths to maintain its current way of life. Ecosystems are no longer able to sustainably meet global demands, which is believed to be the root cause of the current environmental crisis, constraining the sustainable development of the global economy. To address the new challenges faced globally in sustainable development, it is important to understand whether the intensity of human activities exceeds the ecosystem’s capacity to withstand and regulate before implementing targeted countermeasures and measures [3]. Therefore, it is important to apply relevant data to evaluate and analyze the spatiotemporal evolution trends of ECC at the regional scale and propose tailored decision-making solutions to support the sustainable development of global and regional socioeconomic development.
After Park et al. proposed the concept of bearing capacity in 1921 [4], researchers conducted a series of related studies. With changes in the ecological environment, ECC has become a popular research topic. This research has predominantly focused on the construction of an ECC evaluation index system and the selection of evaluation methods.
To date, most researchers have constructed evaluation index systems from the perspective of single and multiple factors. Single factors have mainly focused on resources such as water, ocean, and land. Jia, Cai et al. established a water environment carrying capacity indicator system including the water environment carrying capacity, environmental pressure, water environment vulnerability, and development and use potential [5]. Du and Wang constructed a resource environmental carrying capacity evaluation index system for marine ranches from the perspectives of pressure and support [6]. An ecological geological environment carrying capacity evaluation index system has also been constructed, including the geological environment, ecological geological environment, ecological environment, and social environment subsystems [7]. The in-depth study of single factor carrying capacity by scholars provides a basis for further clarifying the connotation of ECC. However, the ecological environment is a complex system influenced by various factors such as economy, society, and resources, and studying ECC solely from a single factor has become increasingly limited. Therefore, scholars have begun to evaluate ECC from multiple factors. The specific research results include studying the intrinsic mechanism of ECC from the perspective of state pressure response based on the DPSIRM framework [8]. An evaluation index system for the resource and environmental carrying capacity (RECC) was based on water resources, land resources, environment, and ecosystem, using the square difference decision-making method [9]. An indicator system for urban resource and environmental carrying capacity was established based on ecological civilization, including water carrying capacity, land carrying capacity, atmospheric environmental carrying capacity, energy carrying capacity, and solid waste environmental carrying capacity [10, 11]. The ECC index system of economy, resources, and environment uses the entropy weight method to calculate indicator weights, and the TOPSIS model was used to calculate ECC [2]. Based on the elements and structural characteristics of urban ecosystems, ECC was examined and explored from natural, social, and economic perspectives [12]. The research results on the construction of an ECC evaluation index system have laid a solid theoretical foundation for further delineation of the theoretical boundaries of ECC and for the construction of a suitable index system in this article.
In the field of evaluation methods research, scholars have used various evaluation methods to evaluate the level of regional ECC comprehensively. Specifically, they have used the carbon footprint and biomass capacity indicators within the framework of the environmental carrying capacity [13]. Utilizing a modified dynamic capacity model [14]. Wang and Liu determined the state of the regional carrying capacity using the ratio of positive and negative contribution values [15]. Calculating the model using the RECC index [6, 16]. A combination of an ecological environment pressure index model and state space method was constructed [17], and different methods were used to evaluate the ECC. With the emergence of the ecological footprint method, detailed and diverse evaluation methods have been developed, including the indicator system method and the system dynamics model. Researchers have begun to use detailed evaluation methods to study ECC. proposed a detailed model to determine the carrying capacity for resources and the environment based on the ecological footprint method [18, 19]. Further research was also conducted using an improved ecological footprint model [20]. The entropy weight method has been used to calculate the weight of indicators, and the TOPSIS model is then used to calculate the ECC [2, 7]. The ECC and its subsystems were evaluated using the Shannon entropy theory, fuzzy synthesis method, and analytic hierarchy process [3, 21]. Meanwhile, Nakajima and Ortega evaluated the carrying capacity using energy value assessment [22]. Other scholars used a system dynamics model to simulate its historical conditions and future scenarios, emphasizing the connection between socioeconomic and ecological environmental factors [23, 24]. The series of evaluation methods used by scholars have enriched the pathway of a comprehensive evaluation of ECC and provided a reliable basis for selecting reasonable research methods in this study.
Researchers have conducted research on the ECC in various regions at different temporal and spatial scales with a range of results that have provided a solid foundation for this study. The evaluation index system and methods for ECC have been continuously iterated and improved, but further improvements can be made in the following areas:
(1) The complex and diverse ecological environment is the result of the mutual influences between the regional society, economy, and resource environment. Therefore, it is important to select key social, economic, and resource environmental indicators that affect regional ECC and reduce the impact of subjective factors on the key indicators.
(2) In the evaluation of the ECC, a single method is often used. However, many factors affect the ECC evaluation results, and there are differences in the results obtained using different methods. Therefore, it is necessary to construct a data-driven method for measuring and evaluating regional ECC to predict its dynamic changes and regional ECC trends.
(3) Due to regional differences, the universality of relevant research findings needs to be improved, and support for regional decision-making has remained limited. Therefore, using data-driven methods to evaluate regional ECC can provide full process and dynamic monitoring for different regions, thereby forming differentiated and suitable precise countermeasures for different regions.
To address these challenges, this study has drawn on the research of Liu et al. [25]. and proposes a data-driven evaluation method for regional ECC [26, 27]. This has been in line with the spatiotemporal evolution trend of regional ECC to alleviate the contradictions between regional resource use, environmental protection, and economic development. It has also provided suggestions for policy formulation to achieve sustainable economic development.
The theoretical contributions and practical applications of this study are as follows:
Theoretical importance: Based on the relationship between regional society, economy, and resource environment and the characteristics of the regional ecological environment, a detailed evaluation index system for regional ECC was constructed from the three levels of society, economy, and resource environment. This was tailored to local conditions. By using the entropy weight method, TOPSIS method, and a data-driven approach, high-quality dynamic data were collected to analyze the dynamic evolution of regional ECC. Based on the results, the evaluation theory for regional ECC was improved.
Practical importance: This has provided a basis for decision-makers in regional ecological environment management to quantify the level of ECC and identify development trends, to allow practitioners to establish themselves in the new stage of development, implement the concept of sustainable development, examine the dynamic evolution of regional ECC, adjust development strategies, and provide relevant suggestions for researchers and national policymakers to enhance ECC. To achieve these research objectives, the second section presents the methods, the third presents a case analysis, and the fourth presents the conclusion.
Methods
This section provides a detailed introduction to the measurement, evaluation, and identification methods, including method flow, data collection, data processing, data models, and data applications.
Method Processes
Advancements in urbanization and industrialization have led to increasingly prominent environmental pollution issues, which have severely constrained sustainable development [28]. To achieve harmonious coexistence between humans and nature, the ecological economy should form a key focus to promote high-quality economic development. It is necessary to deploy and promote green development, focus on solving prominent environmental problems, and increase efforts toward ecosystem protection. It is necessary to evaluate the mutual constraints between the regional society, economy, and ecology and quantify the level of ECC. This is also the motivation for this study.
However, the ecological environment is complex and diverse. In this context, the coupling and coordination relationships among society, the economy, and the resource environment remain unclear [6, 29]. Regional ECC is a complex system with regional differences in the influencing factors. There are substantial differences in the establishment of different regional datasets and the selection of evaluation methods [30]. Therefore, constructing a universal evaluation index system and accurate measurement of the dynamic evolution of regional ECC is a challenge for researchers.
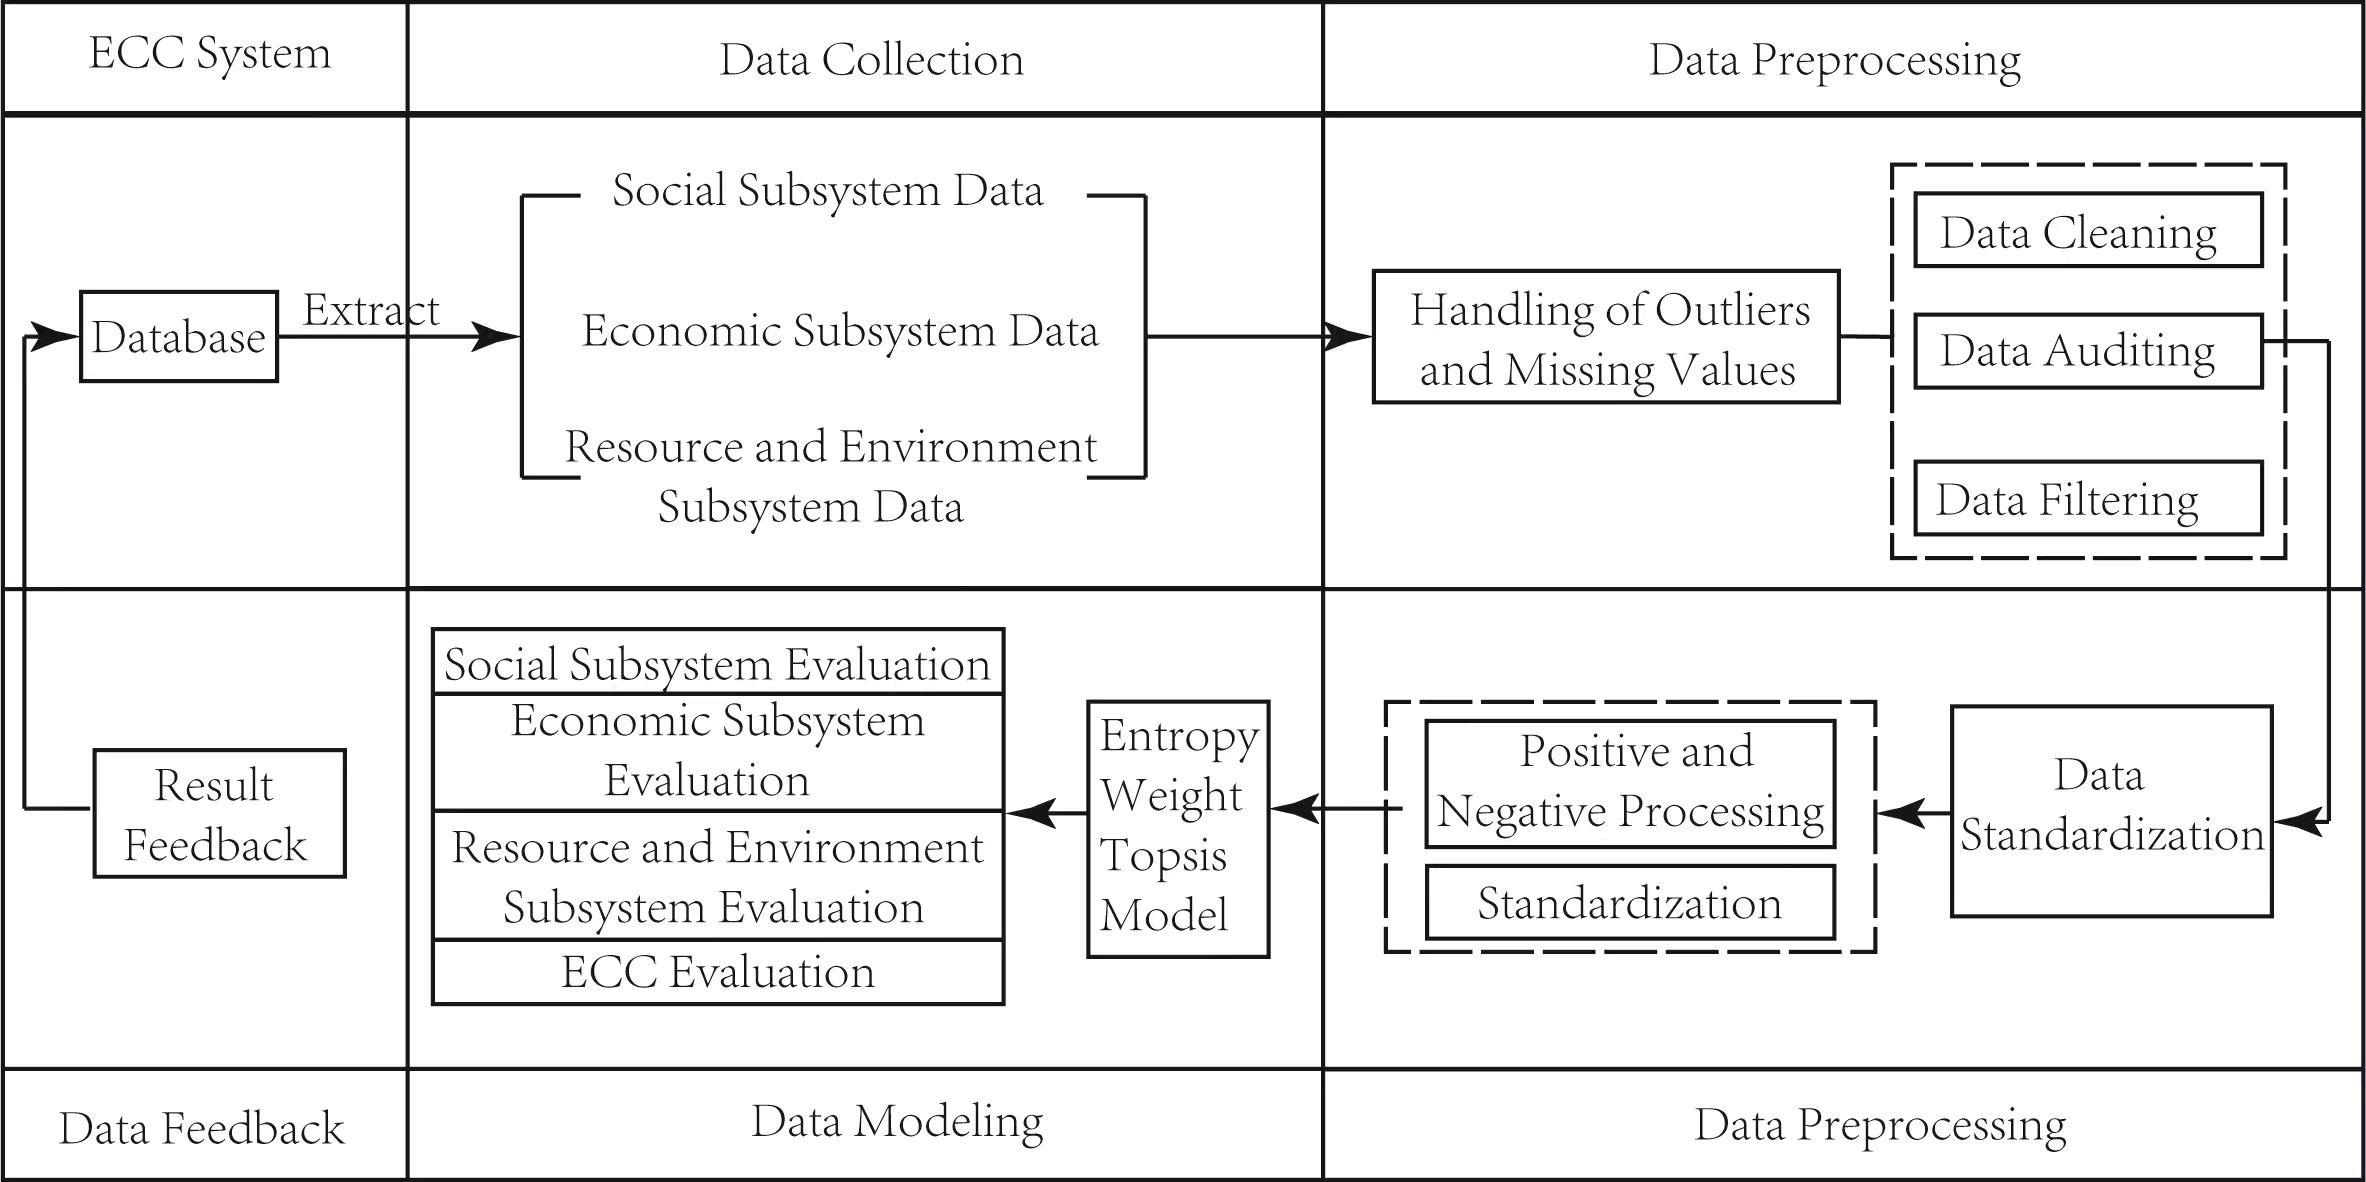
To address this challenge, this study established a data-driven evaluation method that measures, evaluates, and identifies regional ECC [25]. Data-driven applications mainly include data collected on indicators from the perspectives of society, economy, resources, and the environment [20] (see Fig. 1). The data processing involves using a normalization method for dimensionless standardization and an entropy method to determine the weights of indicators. Data modeling is then used in the construction of TOPSIS models for regional ECC [7]. Data analysis was based on TOPSIS, which can be used to evaluate the dynamic evolution trend of regional ECC. Targeted methods can then be proposed to improve regional ECC implementation practices. Data-driven applications are used to construct a more universal and detailed method for measuring, evaluating, analyzing, and optimizing regional ECC identification. This method can provide support for the evaluation and improvement of carrying capacity in different regions. This can also help management decision-makers who focus on carrying capacity, strengthen ecological environment protection, and formulate high-quality development strategies in different regions. This can improve the practical importance of ECC research.
Data Collection
The ECC reflects a complex system with many factors and is the result of the mutual influence and high harmony between regional resource and environmental background support, economic development level, and social progress [19]. It is the ability of the ecosystem to self-sustain and self-regulate, the supply capacity of resource and environmental subsystems, their sustainable socioeconomic activity intensity, and the population with a certain level of consumption [12]. Therefore, with reference to the perspective of Wu and Hu [2], a comprehensive evaluation system for regional ECC was constructed. The evaluation system mainly includes three subsystems: the social, economic, and resource environment subsystems. Thus, when selecting indicators, it was necessary to consider indicators that fully reflect the quality of resources and the environment, that are based on both social and economic aspects, and that also meet the requirements of the sustainable development indicator system. Based on the connotation of ECC and the theory of sustainable development, this study constructed a regional ECC evaluation index system from the three subsystems of society, economy, and resource environment (Table 1).
Among these subsystems, the social subsystem is composed of a human-centered social service system reflecting the sustainability of regional ecosystems in carrying population. Specifically, it includes a moderate population size (population density), good infrastructure (beds per 10,000 people), population consumption level (per capita disposable income), and a stable social environment (social security) [20, 31]. The economic subsystem refers to a regional ecosystem that can maintain the intensity of economic activities. It reflects the appropriateness of regional economic scale, the moderation of economic development speed, the governance of economic development, and the rationality of economic structure. It specifically includes the total economic output (per capita GDP), the speed of economic development (urbanization level, energy consumption of GDP), the degree of economic development governance (wastewater, exhaust gas, and solid waste emissions), and the economic industrial structure (proportion of secondary and tertiary industries) [32, 33]. The resource environment subsystem is composed of natural resources and environmental elements, including elements such as land, water, air, biodiversity, and human activities, that interact and constrain each other. It has functions such as resource supply, environmental regulation, and ecological services, with the goal of achieving regional sustainable development, environmental protection, and resource management. Specifically, it includes resource ownership (land resources, water resources, forests, green spaces, energy, etc.), utilization rate (sewage treatment rate, solid waste treatment rate, etc.), and high-quality environmental protection (air quality rate, industrial pollution control investment) [34, 35].
Data Sources and Processing
Data Sources
This study collected and organized data reflecting the social, economic, resource, and environmental aspects of regional ECC. Data were obtained from the 2012–2021 China Statistical Yearbook, China Environmental Statistical Yearbook, Jiangsu Statistical Yearbook, Anhui Statistical Yearbook, Zhejiang Statistical Yearbook, Shanghai Statistical Yearbook, relevant data published by the Ministry of Ecology and Environmental Protection of China, and field research data.
Table 1.
Table 1 ECC evaluation index system.
Data Processing
To differentiate more effectively between the importance of each indicator, the raw data were preprocessed by data cleaning, auditing, and screening. Positive and negative normalization methods were used for dimensionless standardization [36]. The entropy method was then used to determine the weights of the indicators. The specific steps were as follows:
(1) Construction of the regional ECC evaluation matrix
Assuming the original evaluation index matrix of regional ECC is:
yij represents the original value of the research i object and j indicator.
Given the different dimensions of the indicators for evaluating regional ECC and the existence of positive and negative indicators, the larger the value of the positive indicator, the higher the carrying capacity. The smaller the value of the negative indicator, the higher the carrying capacity. To unify and compare the indicator data, this study used a normalization method to perform dimensionless standardization [37]. The positive indicators were processed according to Formula (2). Meanwhile, the negative indicators were processed according to Formula (3), resulting in a standardized matrix Z (Formula 4):
zij represents the standardized values of research objects i and j, where i = 1, 2, ..., m and i = 1, 2, ..., n.
(2) Determination of indicator weights
To reflect the importance of various indicators of ECC, the entropy method was used to process standardized indicators and form different weights. The information entropy value Hj was first determined using Formula 5. The larger the value1-Hj, the higher the information utility value of the indicator, and the greater its weight in the evaluation of ECC. Formula 7 was then used to determine the weights wj of indicator j.
Data Model
Entropy Weight TOPSIS Method
When researchers use the indicator system method to evaluate ECC, they have predominantly used principal component analysis [38], the analytic hierarchy process [17], the fuzzy comprehensive evaluation method [12], the entropy value method [39], and the entropy weight TOPSIS method [7]. Principal component analysis has relatively limited accuracy in explaining ECC and requires a large sample size and a high cumulative contribution rate of the extracted principal components. Therefore, when there are many indicators, the applicability of this method is relatively low. The analytic hierarchy process (AHP) and fuzzy comprehensive evaluation (FCE) are greatly influenced by subjective factors when determining weights, which reflect numerous ECC indicators. This makes it difficult to determine weights in AHP. FCE may exhibit super fuzziness, leading to evaluation failure. The entropy method is relatively objective in determining weights and can also determine the differences between indicator positions. However, when evaluating the same region, it does not reflect the gap between actual and ideal ECC levels. Using the entropy weight TOPSIS method to evaluate ECC improves the value formula between the evaluation object and the positive and negative ideal solutions, to further match the evaluation results with the real situation. Meanwhile, to avoid the shortcomings of the AHP method, FCE method, and TOPSIS method, which mainly rely on subjective expert opinions to determine weights [25, 40, 41], this study selected this method for evaluation. The specific calculation steps are as follows:
(1) Construction of the weighted decision matrix
In the evaluation of ECC, to improve objectivity and reflect the differences in different indicators, a weighted approach was used to construct a weighted evaluation matrix using weights, as shown in Equation (8).
(8)
(2) Determination of positive and negative ideal solutions for the indicators
V+ represents the maximum value of the jth indicator in the weighted evaluation data on the ith object, which is the most suitable solution. V- represents the minimum value of the jth indicator in the weighted evaluation data on the ith object. This is the least ideal solution, which is taken as the negative ideal solution. The specific calculations are shown in Equations (9) and (10).
(3) Calculation of the Euclidean distance for positive (negative) ideal solutions
Let the distances from each evaluation object vector to the positive and negative ideal solutions be Di+ and Di–, respectively.
(4) Calculate the closeness: . Ci
The pasting process indicates the degree of proximity between the bearing capacity of the evaluated object and the positive ideal solution. This is the optimal solution. Its value range is (0, 1), and the closer Ci is to 1, the higher the bearing capacity of the research object. In contrast, the closer Ci is to 0, the lower the bearing capacity. The progress of pasting can be used to determine the ECC of each research object and the order of suitability.
Data Applications
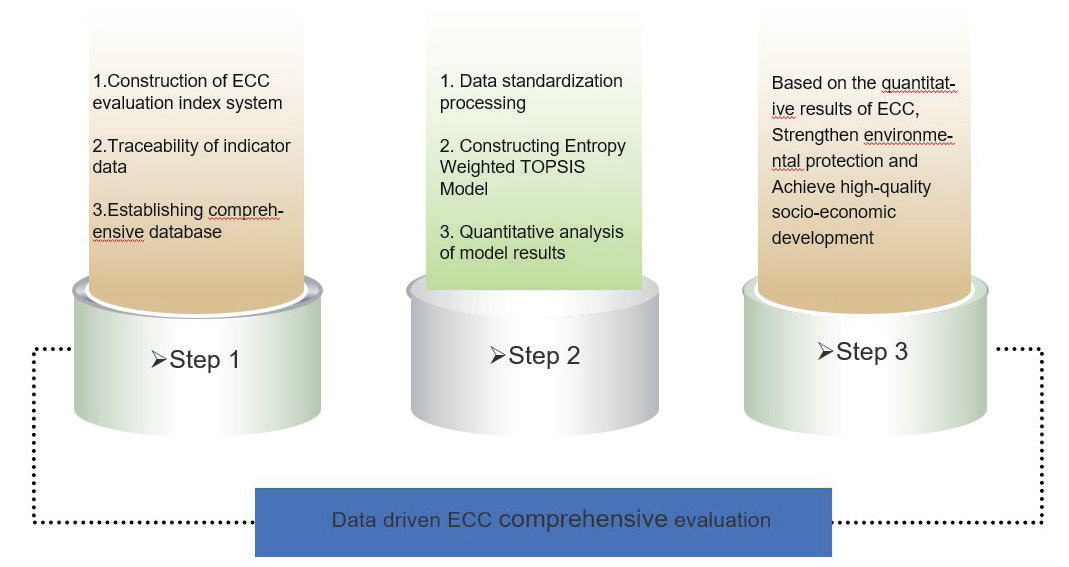
This study was based on the data-driven measurement, evaluation, and identification of regional ECC. A specific data application is shown (see Fig. 2). The first step involved the establishment of a complete dataset. Based on the coupling relationship between society, economy, resources, and the environment, an evaluation system that fully reflects the regional ECC was established. A complete database was then constructed to dynamically reflect and monitor the level of regional carrying capacity. The second step was to evaluate the regional ECC. The entropy method assigns weights to the indicator layer of regional ECC based on the difference in importance of influence. It uses the TOPSIS method to quantify and evaluate the level of regional carrying capacity. Time-series results on the regional carrying capacity levels were obtained, and the changes in different periods were compared. Meanwhile, different regions are differentiated. Based on the results, a reference method is then provided to assess the regional carrying capacity. The third step was to propose environmental protection and high-quality socioeconomic development strategies based on regional ECC.
Case Study
Using these research methods, focusing on the ECC of the Yangtze River Delta region from the perspective of the social economy resource environment, using a data-driven approach, we quantified the dynamic evolution trend of ECC in the region. We have also proposed policy recommendations to enhance the ECC of the Yangtze River Delta region, optimize the ecological security pattern, achieve high-quality economic development, and summarize management insights.
Case Study Background
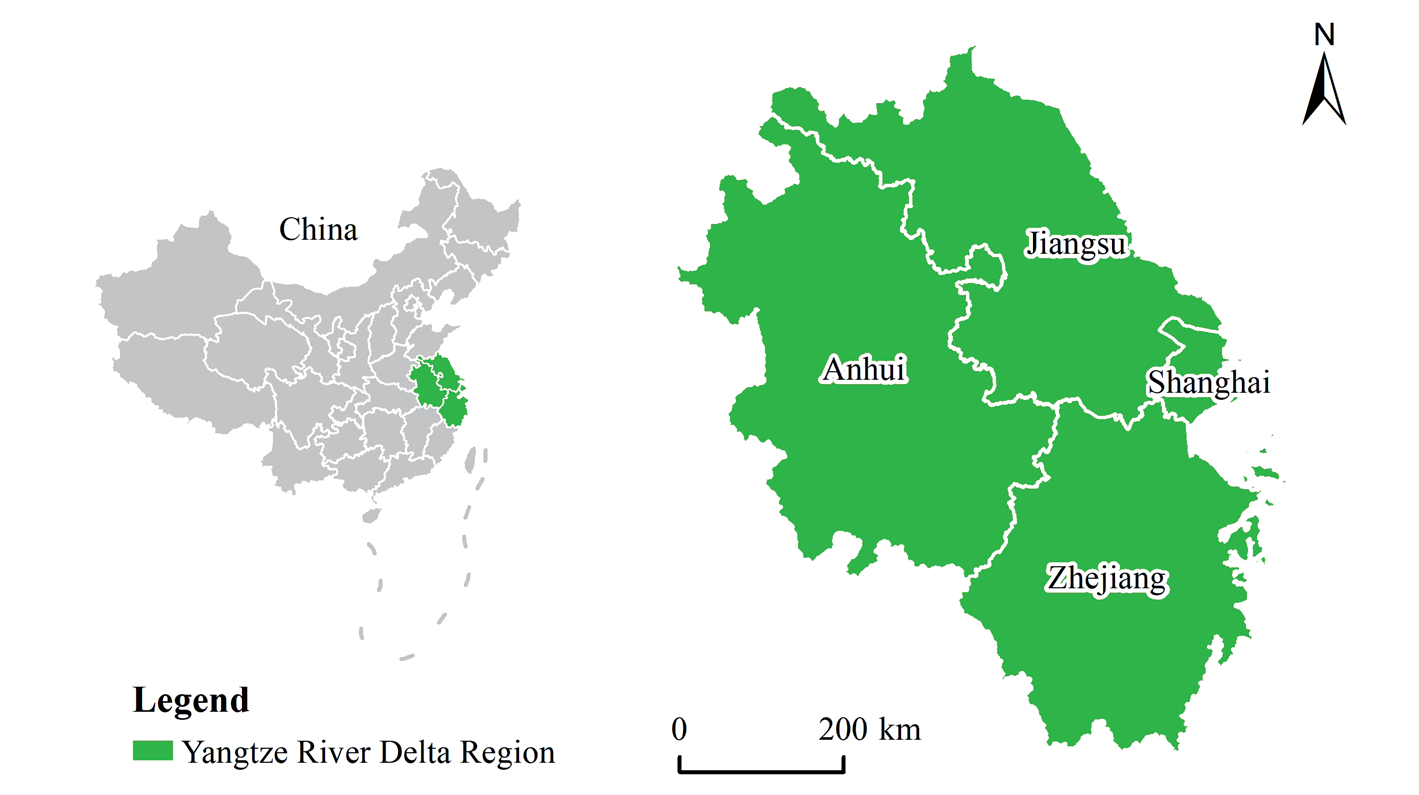
Encompassing Shanghai, Jiangsu, Zhejiang, and Anhui provinces (see Fig. 3), the Yangtze River Delta region is the most developed region of China’s economy. In 2021, the region had a regional gross domestic product of 27.59 trillion yuan. This represents an increase of 8.4% compared to the previous year, accounting for 24% of the national total. This has played an important role in the high-quality development of the Chinese economy. However, there is a regional imbalance in the economic development of the Yangtze River Delta. Some regions rely on large-scale investments to drive economic growth. This has resulted in high resource consumption, intensive pollutant emissions, and severe air pollution. The 2021 China Environmental Status Bulletin disclosed that although the proportion of excellent days in the Yangtze River Delta region increased in 2021, there are still days when pollutants such as O3, PM2.5, PM10, and NO2 exceed the standard, severely affecting public health. Therefore, the Yangtze River Delta is the most developed and urbanized region in China, with the highest degree of urban agglomeration. Studying regional ECC can alleviate the contradictions between resource use, environmental protection, and economic development in the Yangtze River Delta region, achieve high-quality economic development, and have a certain typicality. This study also provides a reference for other regions.
Results
Using the entropy weight TOPSIS method, the ECC size of the Yangtze River Delta region from 2011 to 2020 was obtained. To further analyze and describe the trends and reasons for ECC changes, the carrying capacity of the three carrying subsystems of society, economy, and resource environment was calculated. Based on this, the characteristics and dynamic evolution trends of the ECC of the Yangtze River Delta region and each subsystem were analyzed. The specific changes are shown in Fig. 4–7.
ECC Analysis From the Yangtze River Delta Region
Fig. 4 shows that the ECC in the Yangtze River Delta region continued to improve from 2011 to 2020. In 2011, the per capita gross domestic product (GDP) of the Yangtze River Delta region was relatively low. However, the level of urbanization was relatively low, and an industrial-added value of 10,000 yuan resulted in large amounts of wastewater, exhaust gas, and solid waste emissions. The use rate for industrial solid waste and the urban domestic sewage treatment capacity were relatively low. This has reduced the ECC of the region and led to a relatively low ECC level in the Yangtze River Delta region. By 2020, the ECC index in the Yangtze River Delta region reached new highs, with Zhejiang Province (0.637) reaching a relatively advanced level. Anhui Province (0.59) and Jiangsu Province (0.47) performed well, while the ECC in Shanghai (0.388) required further improvement.
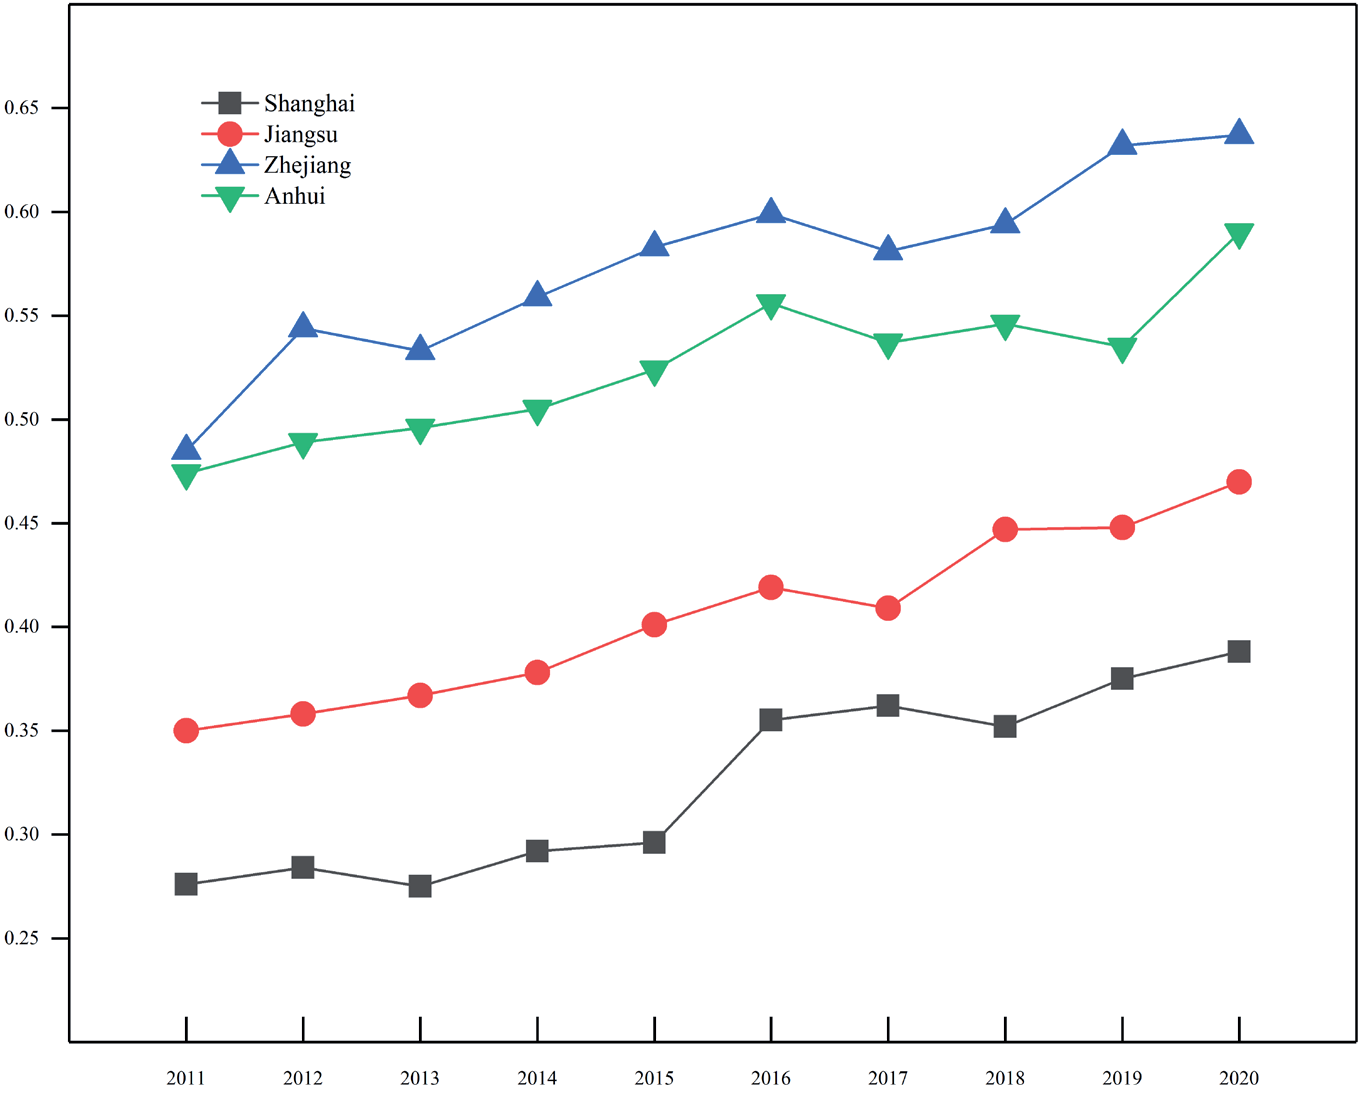
From the perspective of zoning, in the last ten years, the Yangtze River Delta region has achieved successful results in terms of social, economic, and ecological environmental protection and governance. In the Yangtze River delta region, ECC has improved the fastest in Zhejiang Province, followed by Anhui Province and Jiangsu Province. Meanwhile, Shanghai required further improvement. This is due to the insufficient retention of resources in Shanghai. Comparative analysis of ECC in the Yangtze River Delta region showed a spatial distribution pattern of high in Zhejiang, medium in Anhui and Jiangsu, and low in Shanghai. The main reasons for the spatial differentiation of regional ECC were that Zhejiang Province has abundant resources and a high level of socio-economic development. Although Anhui Province is relatively rich in resources, its economic development level is relatively low. Jiangsu Province has a relatively high level of economic development, but has insufficient resources. Although Shanghai has the highest level of economic development among the three provinces and one city, its lack of resources severely limits its ECC level.
Evaluation of the Ecological Subsystem Carrying Capacity in the Yangtze River Delta Region
Evaluation of the Social Subsystem of the ECC in the Yangtze River Delta Region
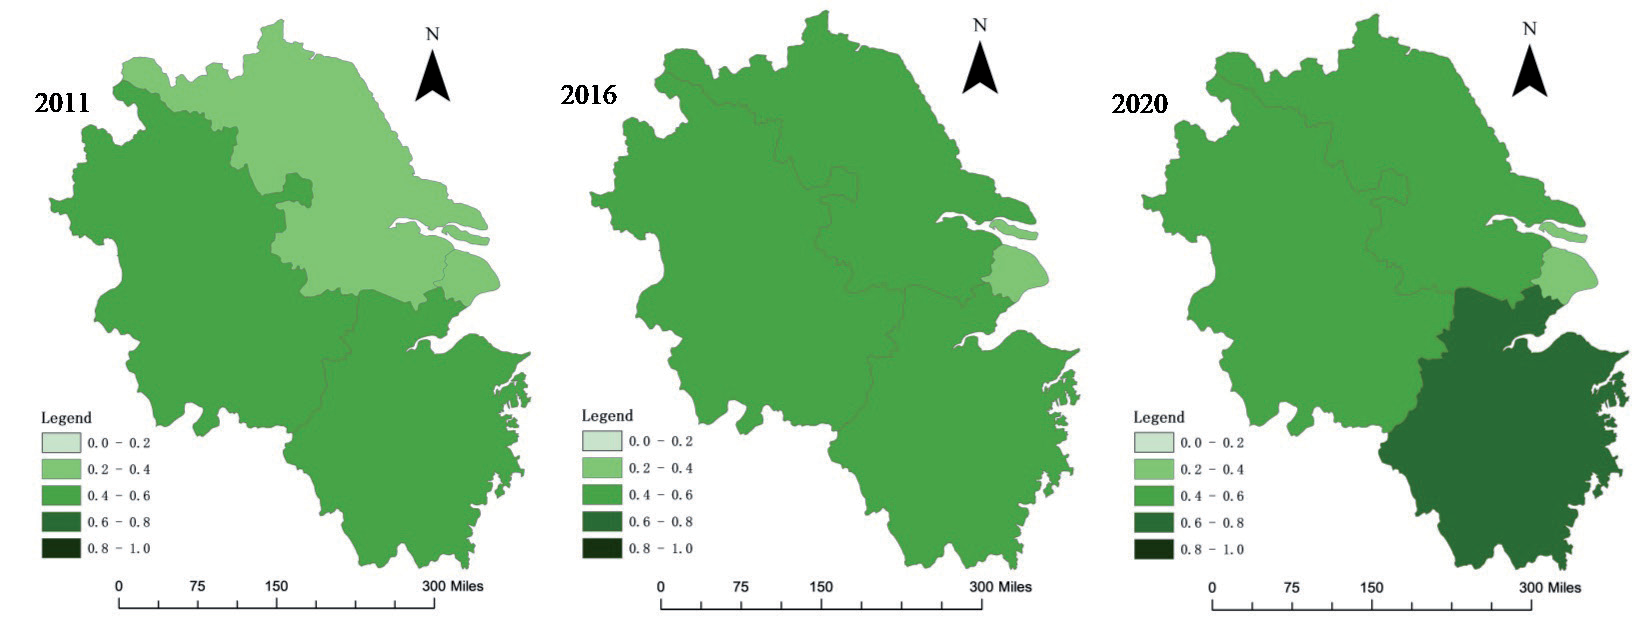
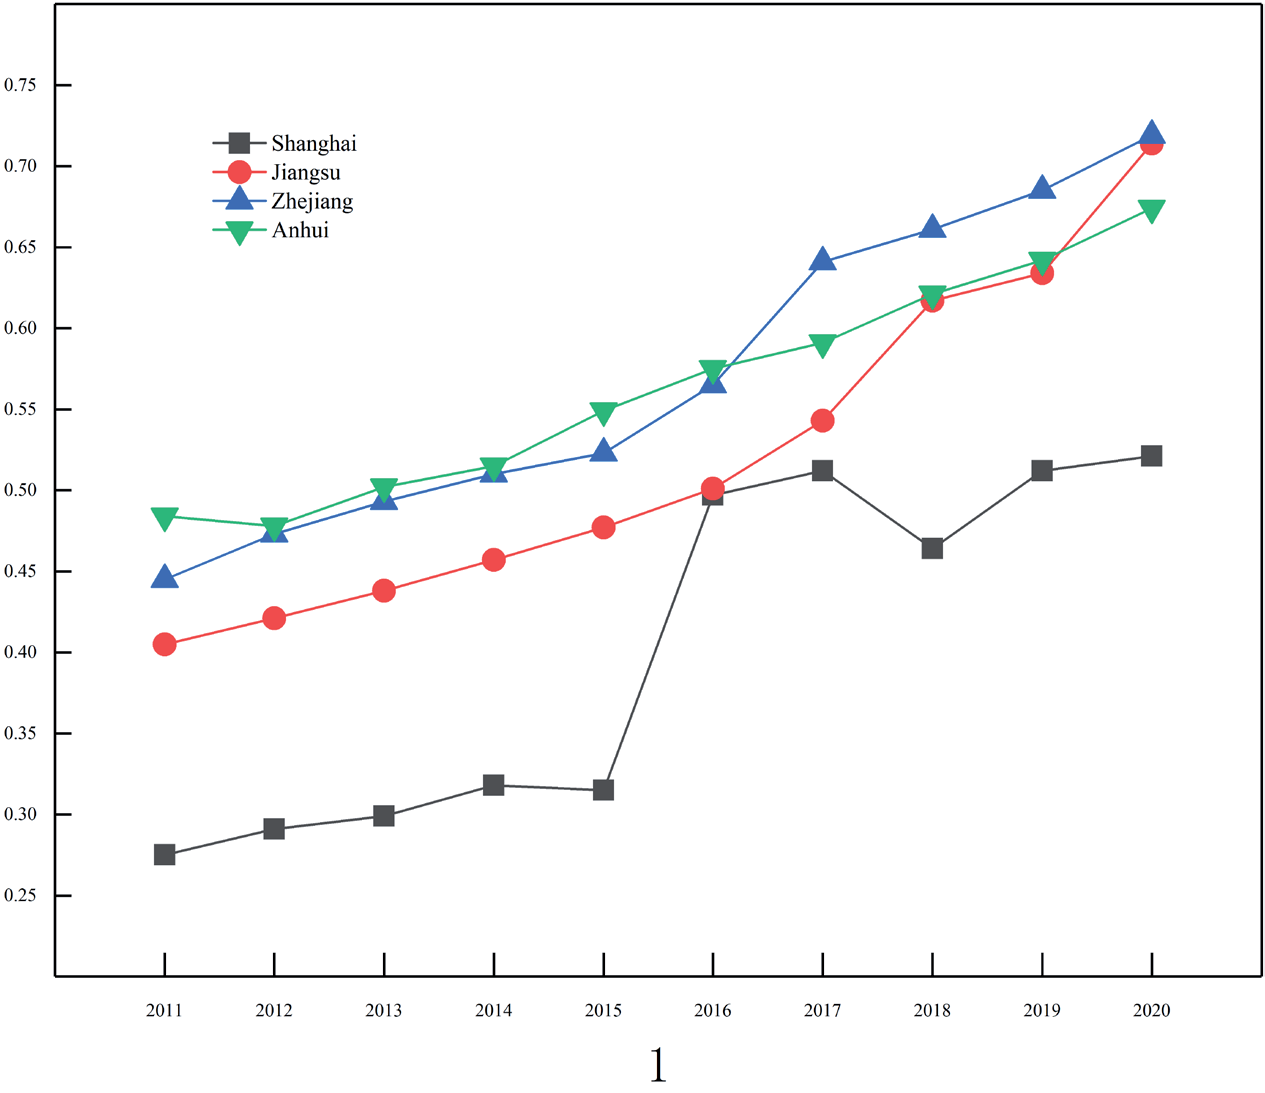
As shown in Fig. 6, the carrying capacity of the social system in the Yangtze River Delta region shows an upward trend from 2011 to 2020. In 2011, except for Shanghai (0.275), which was at a lower stage, the carrying capacity index of the other three provinces exceeded 0.4. This is mainly because of the population density of 3715 people/km2 in Shanghai, which is substantially higher than that in other regions. The social system’s carrying capacity improved significantly in 2016. The carrying capacity of the system is expected to improve further by 2020. Jiangsu Province (0.719), Zhejiang Province (0.714), and Anhui Province (0.674) have relatively high states. The social system carrying capacity index of Shanghai also exceeded 0.5. This indicated that the per capita disposable income and medical and health conditions in the Yangtze River Delta region have substantially improved along with quality of life.
From the perspective of spatial layout, based on the average social system carrying capacity in the past 10 years, the social system carrying capacity in the Yangtze River Delta region has a distribution that is relatively high in Jiangsu and Zhejiang provinces, medium in Anhui Province, and low in Shanghai city. This is because the per capita disposable income in Jiangsu and Zhejiang provinces is relatively high and the population density is moderate. Anhui Province has insufficient per capita disposable income and medical and health performance. Although Shanghai has relatively high per capita disposable income and healthcare performance, its population density is relatively high.
Evaluation of ECC Economic Subsystems in the Yangtze River Delta Region
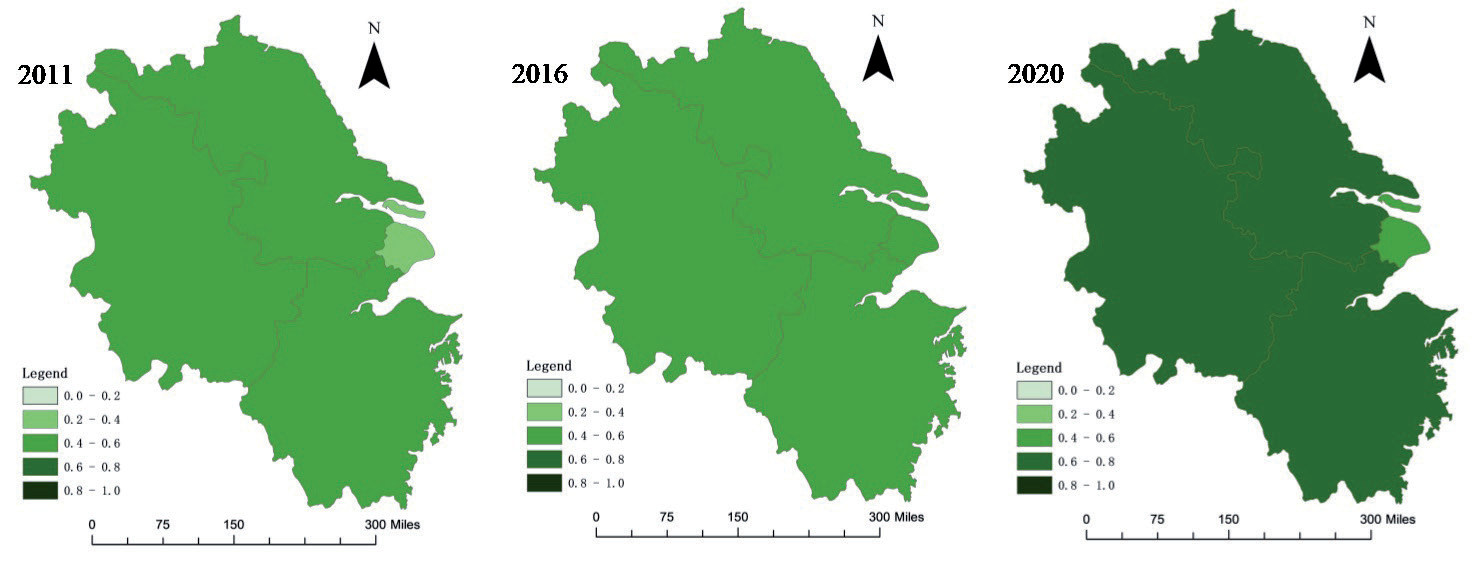
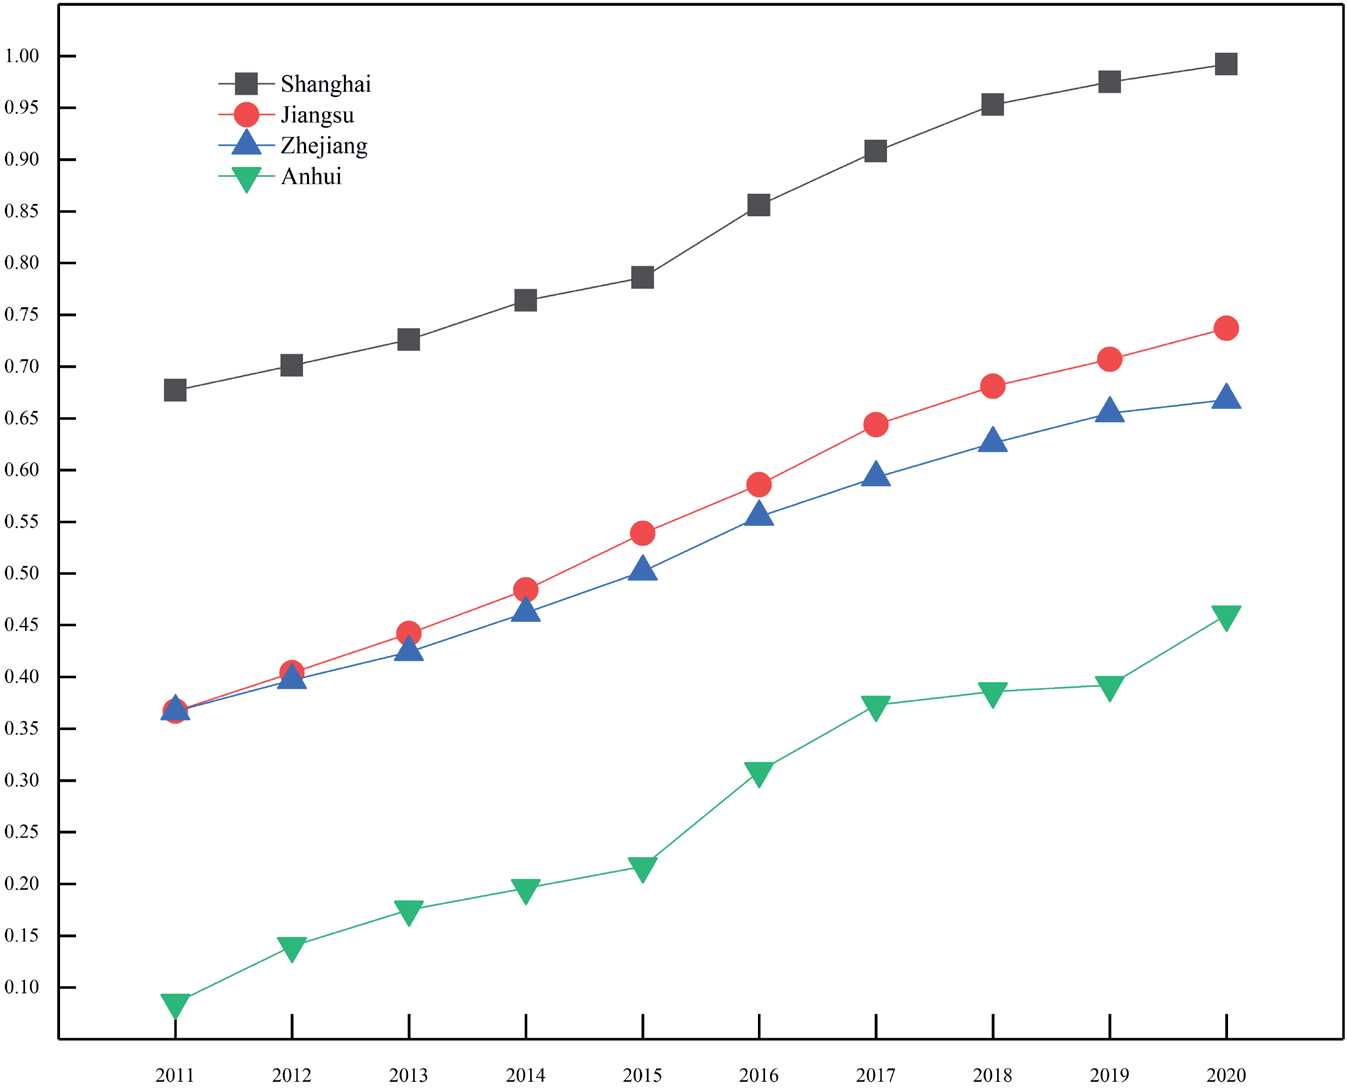
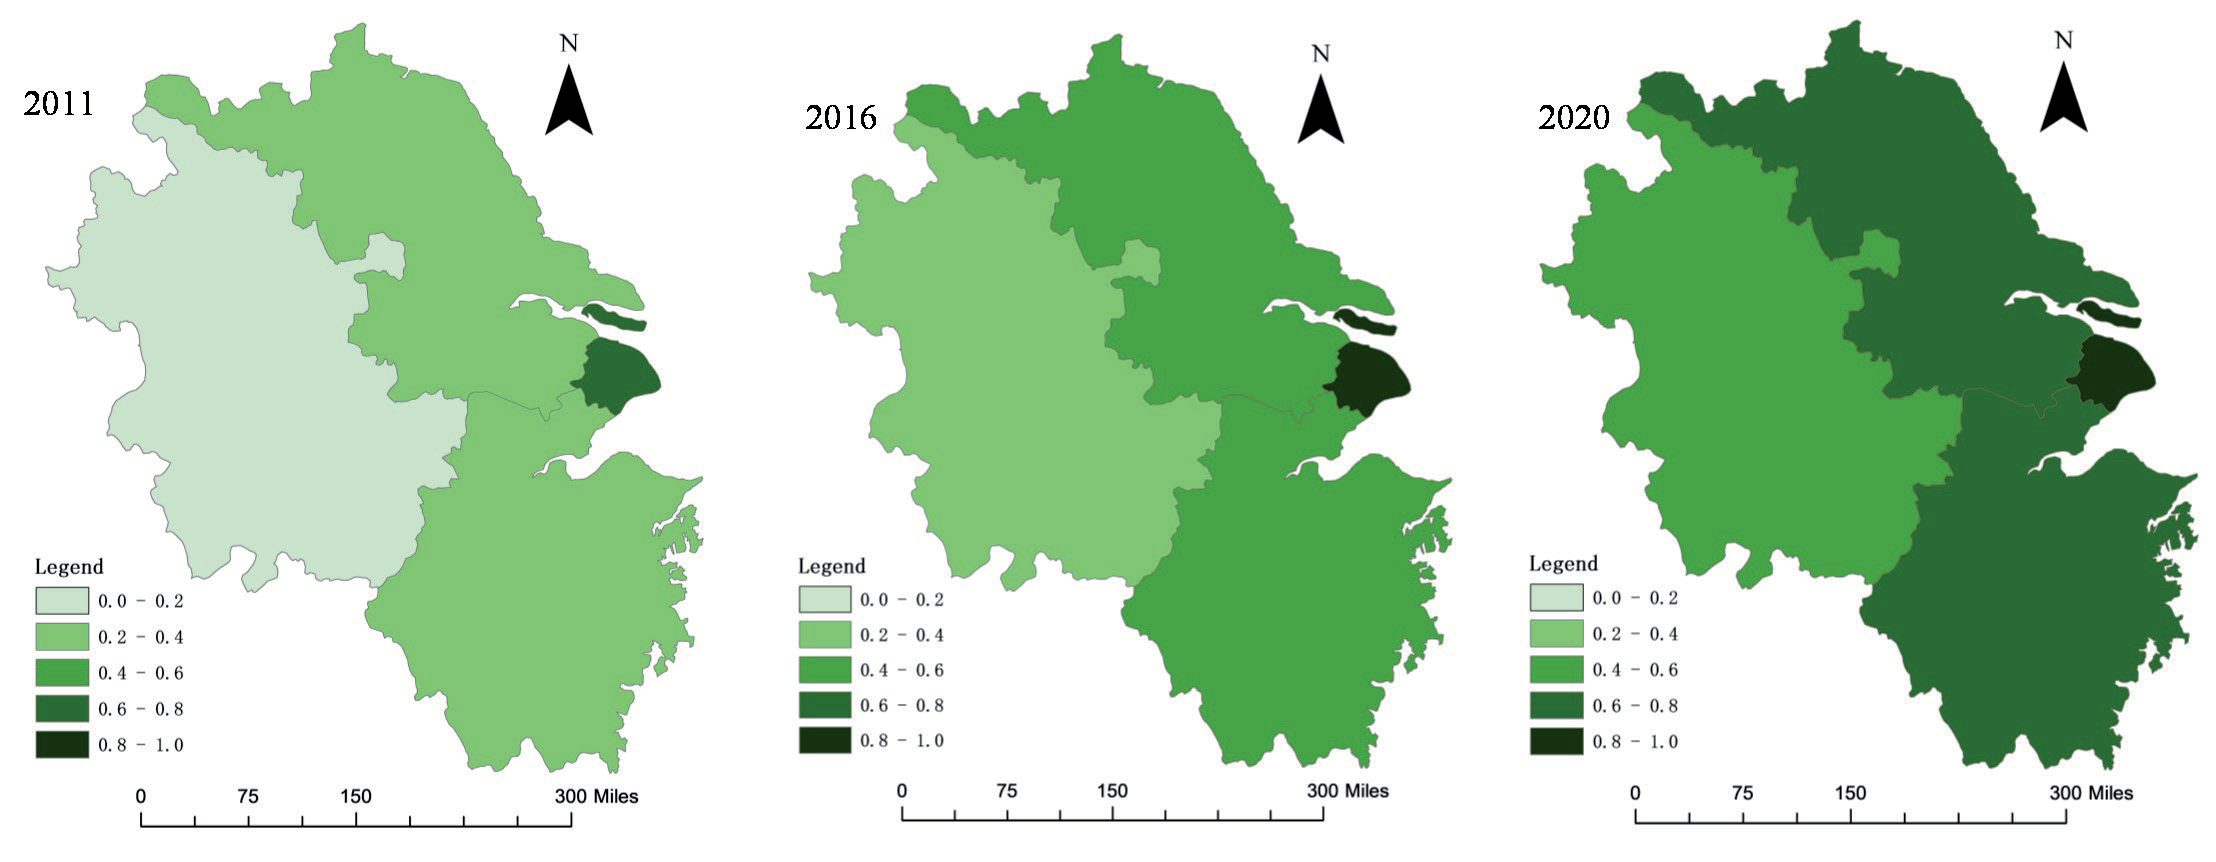
Fig. 8 shows that owing to the rapid decline in the GDP energy consumption rate, continuous optimization of the industrial structure, and continuous improvement in the urbanization level, the carrying capacity index of the Yangtze River Delta regional economic system has shown a clear upward trend. In 2011, the carrying capacity index of the economic subsystem in Shanghai reached 0.677, indicating a strong carrying capacity. The indices of Jiangsu and Zhejiang provinces are both 0.367. Meanwhile, the carrying capacity index of Anhui Province is only 0.085, indicating that its economic subsystem carrying capacity is at a relatively low level. In 2015, except for Anhui Province, the carrying capacity index of the economic subsystem exceeded 0.5, which is relatively high. In 2020, the carrying capacity indices of Shanghai, Jiangsu, and Zhejiang exceeded or approached 0.7. Meanwhile, that of Anhui Province also approached 0.5, especially Shanghai, which reached 0.992. This indicates that the carrying capacity index of the regional economic subsystems of the Yangtze River Delta is already high, but there are regional differences.
From the perspective of spatial distribution, from 2011 to 2020, the carrying capacity of the economic subsystem showed a trend of being high in Shanghai, medium in Jiangsu and Zhejiang, and low in Anhui. The carrying capacity of the economic subsystem in Shanghai has always been ahead of that of the other regions, and the carrying capacity index of Anhui Province is lower. This is because Shanghai’s per capita GDP, that is, 155,800 yuan in 2020, and urbanization level (89%) are substantially higher than those in other regions, and industrial structure adjustment and upgrading are more prominent. The amounts of wastewater, exhaust gas, and solid waste generated by the industrial added value per 10,000 yuan were relatively low.
Evaluation of ECC Resource and Environmental Subsystems in the Yangtze River Delta Region
Fig. 10 shows that the carrying capacity of the resource and environment subsystems in the Yangtze River Delta region exhibited a fluctuating growth trend from 2011 to 2020, with 2016 being the turning point. This is because investment in industrial pollution control in various provinces and cities in 2016 was the highest in the last decade. In 2020, the carrying capacity index for the resource and environmental subsystems in Zhejiang Province (0.615) and Anhui Province (0.594) both exceeded 0.5. Meanwhile, the carrying capacity index of Shanghai was 0.206. This indicated that the carrying capacity of resources and the environment in the region improved, but the overall level was not high and the difference was significant.
Fig. 10.
Evaluation results of the resource and environment subsystem of ECC in the Yangtze River Delta region (2011-2020).
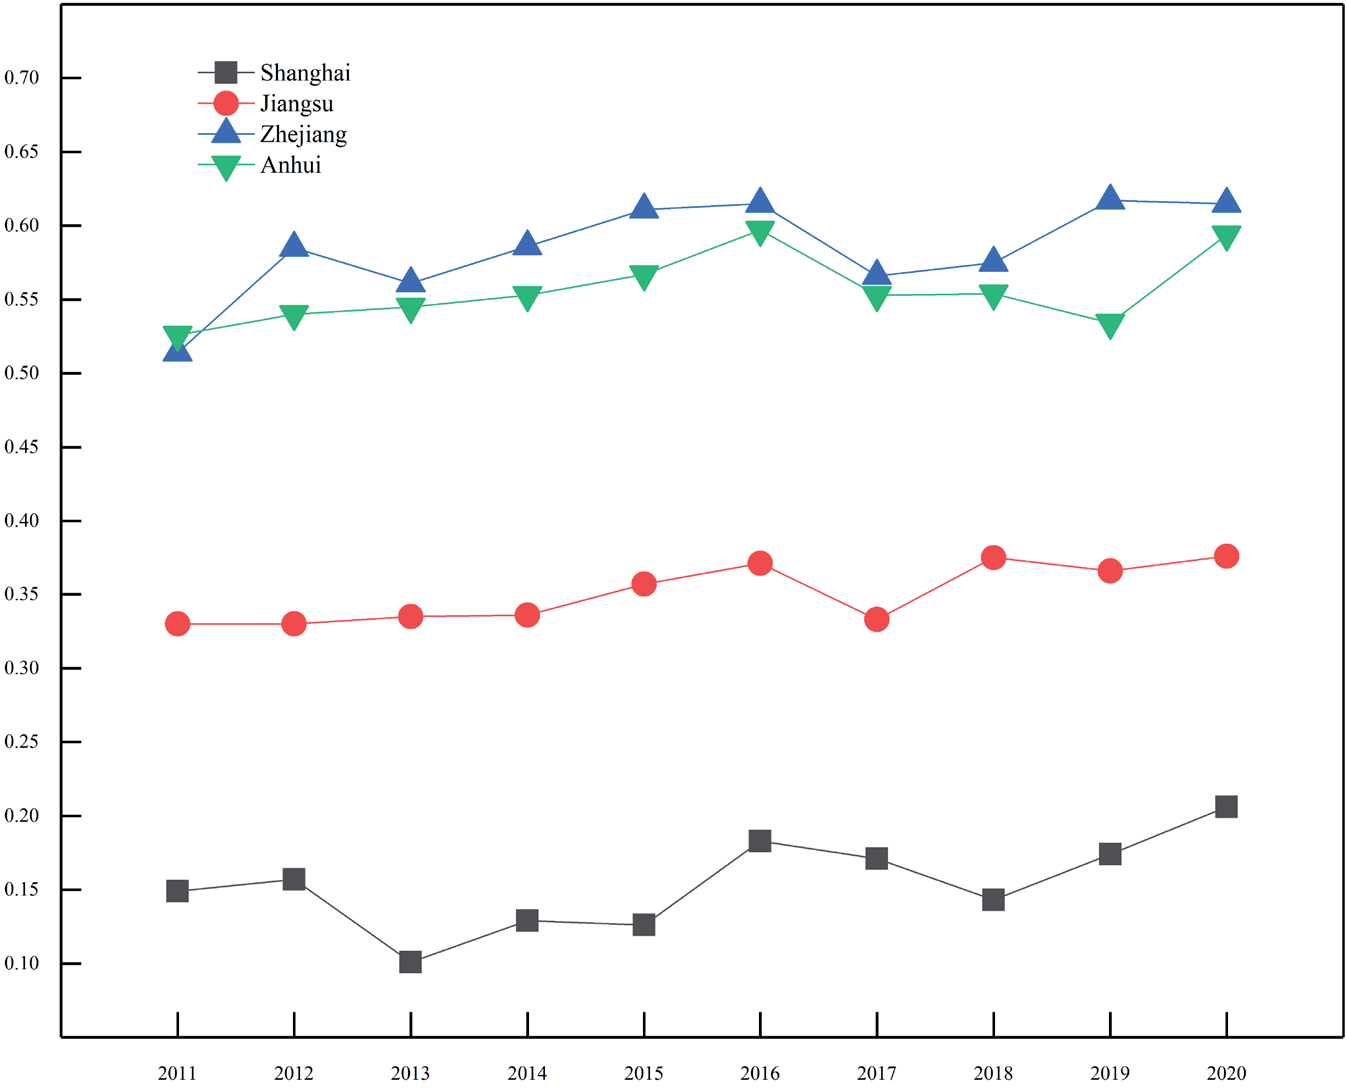
Fig. 11.
Spatial evolution of ECC resource and environment subsystem evaluation in the Yangtze River Delta region.
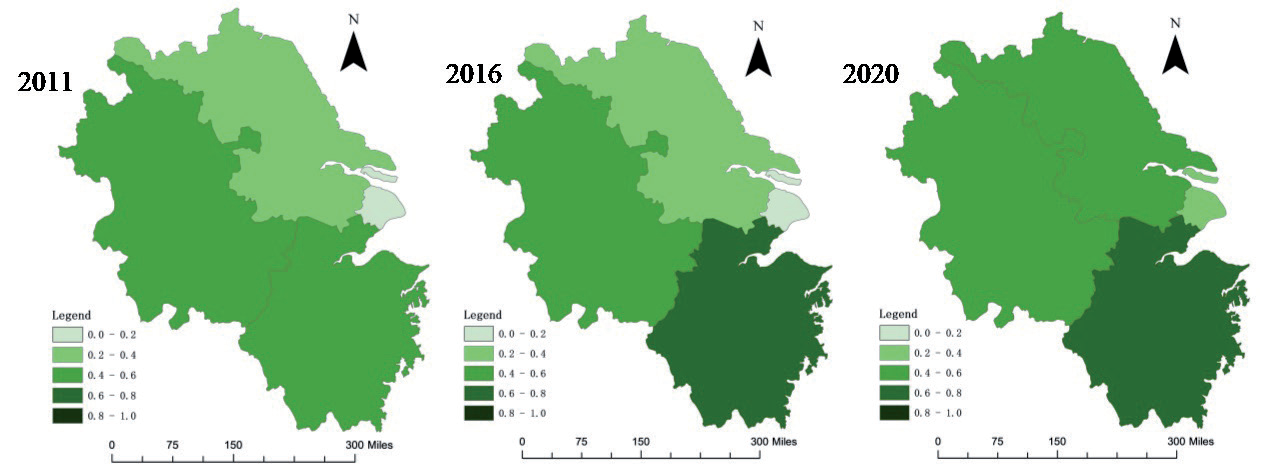
From the perspective of spatial layout, the carrying capacity index of the resource and environment subsystem in the Yangtze River Delta region shows a spatial distribution of high in Zhejiang and Anhui, medium in Jiangsu, and low in Shanghai. The means were 0.5845 in Zhejiang Province, 0.5563 in Anhui Province, 0.3509 in Jiangsu Province, and 0.1539 in Shanghai. This is because the water resources and forest cover in Zhejiang Province are relatively high. Meanwhile, the land and energy resources in Anhui Province are among the highest, and the air quality in the two provinces is relatively high. Although Shanghai has higher efficiency in environmental governance, the retention of various resources is relatively low, especially water and land resources, which are far lower than those of other regions.
Policy Suggestion
The overall ECC in the Yangtze River Delta region showed an upward trend, and the carrying capacity of each subsystem improved to varying degrees. However, there are still high levels of major pollutant emissions, resulting in high total carbon emissions, difficulty in improving green and low-carbon development levels, and greater difficulty in continuously improving air and water quality. Based on the results, the following suggestions are proposed:
Committing to Promoting Green Development in the Yangtze River Delta Region and Reducing Waste Emissions
The Yangtze River Delta region should actively promote the development of clean production and ecological industries, encourage enterprises to implement clean production technologies, promote green products and services, reduce pollutant emissions, and continuously reduce industrial value-added wastewater, exhaust gas, and solid waste emissions in its economy subsystem [42-44]. The resource and environment subsystem should improve the sewage treatment rate and industrial waste solid utilization rate, optimize the greening and pollution removal capabilities of the two subsystems, and continuously enhance the ECC of the Yangtze River Delta region.
The government in the Yangtze River Delta region is forcing enterprises to undergo a green transformation of their industrial structure and accelerate social development. In the future, the region should strengthen the implementation of environmental protection laws and regulations, increase the cost of environmental violations, and actively encourage enterprises to promote green products and services through subsidies, tax incentives, credit supports, and other policies. It should also work to enhance the commitment to environmental responsibility and competitiveness, foster green and low-carbon industries, and accelerate industrial structure adjustment, transformation, and upgrading. In the social subsystem, the region should increase the proportion of fiscal expenditure and the per capita income. In the economy subsystem, it should continuously increase the proportion of secondary and tertiary industries, enhance urbanization levels, and reduce regional unit energy consumption, achieving a green transformation of the industrial structure and leveraging the self-sustaining and self-regulating capabilities of the Yangtze River Delta regional ecosystem to enhance regional ECC. Regional collaborative governance needs to be implemented in the Yangtze River Delta to strengthen the coordinated development of ecological resources and ecological protection.
The Yangtze River Delta region should develop an overall plan for collaborative governance of resources and environment, establish a regional resource and environment information sharing platform, implement integrated monitoring data of regional resources and environment, and strengthen collaborative monitoring of the regional environment. In the resource and environment subsystem, a series of integrated watershed ecological restoration and protection projects, such as forest wetland protection, river management, and water source conservation, have been implemented. With the benefit of advanced atmospheric and water pollution collaborative governance technologies and models, the emission of pollutants can be reduced, self-sustainment and self-regulation of the ecosystem can be achieved, and the ECC of the Yangtze River Delta region can be improved continuously.
Discussion and Management Recommendations
Building on prior literature in the field [45-47], this study has the following advantages: Based on theories such as carrying capacity and ecosystem theory and using literature analysis and survey analysis methods, an indicator system for regional ECC was developed from the perspective of the social economy resource environment. A dynamic database was then constructed. Based on this database, a data-driven regional ECC evaluation model and subsystem evaluation model were implemented. The entropy-weighted TOPSIS method was used to evaluate and identify the carrying capacity, thereby providing theoretical support for quantifying regional ECC. Based on data-driven methods, a tool for measuring, evaluating, and identifying regional ECC was developed, providing a theoretical basis for differentiated resource use, reduced pollution and waste emissions, and improved carrying capacities in different regions. This has become the basis for the sustainable development of regional economies tailored to local conditions.
Based on the study findings, we can provide the following management insights:
A precise evaluation of the ECC level was the main basis for the high-quality coordinated development of the regional economy. Although different regions have been striving to improve ECC and use efficiency, if relevant data-driven approaches can be used, it would be beneficial to deepen our understanding of the regional carrying capacity and make strategic use of regional resources and the environment.
The ECC evaluation is a complex system that involves economic, social, and resource environmental subsystems within the ecosystem. Any system affects the accuracy of the evaluation to a certain extent, and there are differences between different regions. Therefore, it is necessary to analyze, identify, and optimize the influencing factors based on an evaluation of the bearing capacity.
Based on the study findings, targeted suggestions have been proposed to improve the regional ECC level, leverage the comparative advantages of each region, promote strategic flow and efficient agglomeration of factors, form complementary advantages, and achieve coordinated, high-quality economic development between regions. The key is to fully understand the differences in the regional economy, society, resources, and environment and quantify the level of ECC.
Conclusions
With increasing global efforts to prevent ecological degradation and environmental pollution and the need to continuously promote regional ecological civilization construction and high-quality development [48-51], it is necessary to base all of this on ECC. Therefore, scientific evaluation of regional ECC has become extremely important. To this end, we have proposed a data-driven method to evaluate regional ECC and identify its key factors.
The specific innovation lies in the following:
(1) From the perspective of the mutual influence of the economy, society, resources, and environment, and their inherent interrelationships, based on the study of specific regions, an objective and critical regional ECC evaluation index system was constructed from the three major interaction subsystems of economy, society, resources, and the environment. (2) We have developed a data-driven method to measure, evaluate, and identify regional ECC. This method provides a more objective evaluation of regional ECC, reflecting the dynamic changes and prediction trends of regional ECC and improving decision-making accuracy.
(3) Based on the results, process and dynamic monitoring can be conducted for different regions, thereby forming precise strategies for differentiated and suitable resource use, environmental protection, and sustainable regional economic development.
In-depth research on ECC is a solid foundation for achieving ecological civilization construction. Therefore, ECC needs to integrate the concept of ecological civilization construction [52, 53], consider the influence of factors such as technology, culture, and the humanities, and achieve content exploration and innovation [54]. In the evaluation of ECC, it is necessary to continuously revise and improve the indicator system based on the development of content innovation and deepen research methods and statistical algorithms. These can be combined with modern big data technology, such as deep learning methods [9, 55], to evaluate and identify key influencing factors. Meanwhile, in-depth research should be conducted on relevant standards and norms. Relevant thresholds (intervals) and rate-related parameters should be defined, and a standardized evaluation method should be developed to support the practical implementation of ECC.

