

Introduction
Under China’s “dual carbon” goals and the full implementation of the Rural Revitalization Strategy, green agricultural development has become a key pillar of the national ecological civilization agenda [1, 2]. As a major economic crop, vegetable production – marked by intensive inputs, frequent fertilization, and facility-based cultivation – has become a focal point of resource pressure within the green transformation framework [3, 4]. Policy directives such as “promoting green agricultural development” and “transforming agricultural production methods,” as outlined in the Rural Revitalization Strategy, emphasize the urgency of optimizing fertilizer inputs in vegetable cultivation to reconcile yield goals with ecological sustainability [5, 6].
Fertilizer use is central to agricultural sustainability, influencing productivity and input efficiency while contributing significantly to environmental externalities such as non-point source pollution, greenhouse gas emissions, and soil degradation [7, 8]. In recent years, substantial research has explored the spatial-temporal dynamics, environmental consequences, and policy frameworks surrounding fertilizer use. At the macro level, studies have examined national-level control measures and carbon reduction pathways, emphasizing the trade-offs between productivity and ecological outcomes [9]. At the meso level, investigations have focused on drivers of fertilization behavior, including farmer characteristics, pricing mechanisms, subsidies, and information interventions [10]. Recent advances also incorporate spatial economics and GIS-based methods to assess spatial dependence and regional clustering in fertilizer application [11].
Nevertheless, several critical gaps remain unaddressed. First, vegetable production—due to its intensive input profile and spatial heterogeneity—has often been lumped into broader “crop-level” studies, lacking dedicated spatiotemporal assessments [12]. Second, most existing research focuses on static patterns or aggregated trends, offering limited insight into the evolving spatial dynamics of fertilization, especially in response to major policy shifts such as the Rural Revitalization Strategy. Third, mechanisms behind spatial restructuring—such as cluster contraction, boundary anomalies, and gravity center shifts—have not been systematically examined, leaving the policy-spatial behavior linkage underexplored.
To address these gaps, this study constructs a fertilizer application intensity index for vegetable production using panel data from 31 Chinese provinces spanning 2011 to 2023. By applying a multi-method approach—comprising kernel density estimation, Theil index decomposition, spatial autocorrelation analysis (Moran’s I and LISA), standard deviation ellipse modeling, and gravity center migration analysis— this study systematically examines the spatiotemporal evolution and regional differentiation of fertilizer use before and after the launch of the Rural Revitalization Strategy.
This research emphasizes the vegetable sector’s high-input, high-externality nature, integrating dynamic spatial structure analysis with behavioral mechanisms. It introduces the concept of “spatial coordination mechanisms” within the context of green agricultural transformation. The findings provide both theoretical insight and policy-oriented guidance for optimizing fertilizer input structures and improving green governance capacity under the Rural Revitalization framework.
Data Sources and Research Methods
Data Sources
The data on fertilizer application intensity in vegetable production used in this study were derived from statistical estimations based on information from 31 provincial-level administrative regions in China, covering the period from 2011 to 2023. Due to data availability, the analysis excludes the Hong Kong Special Administrative Region, the Macao Special Administrative Region, and Taiwan Province. To ensure the authority and consistency of the dataset, all statistical data were obtained from publicly available sources, including the China Statistical Yearbook, China Agricultural Yearbook, and the Provincial Rural Statistical Yearbooks.
Estimation of Fertilizer Application in Vegetable Production
As China’s statistical system does not provide separate records of fertilizer usage specifically for vegetable production, this study adopts an indirect estimation method by constructing an area-based weighting coefficient [13]. Let AitVeg represent the vegetable sown area, Aitcrop the total crop sown area, and Fitcrop the total fertilizer consumption for crops in province i during year t. The estimated amount of fertilizer applied to vegetable production FitVeg is calculated as follows:
This formula assumes uniform fertilizer application rates across different crop types, whereby fertilizer allocation is proportional to the share of sown area. Although this approach involves a simplified assumption, it is widely adopted in empirical research when disaggregated fertilizer input data by crop type are unavailable [13].
Estimation of Fertilizer Application Intensity in Vegetable Production
To more accurately reflect regional dependency on chemical fertilizers in vegetable production, this study further calculates the fertilizer application per unit of vegetable yield based on the previously estimated total fertilizer usage. This indicator, referred to as the fertilizer application intensity in vegetable production, effectively measures both the input efficiency of fertilizer use and the associated environmental pressures across different regions.
Let YitVeg denote the total vegetable yield in province i during year t. The corresponding fertilizer application intensity IitVeg is defined as:
where FitVeg represents the estimated amount of fertilizer applied to vegetable production (measured in kilograms), and YitVeg denotes the total vegetable yield (measured in tons). The resulting unit of IitVeg is expressed as kilograms per ton (kg/t), indicating the amount of fertilizer consumed for every ton of vegetables produced.
Kernel Density Estimation
To analyze the spatial clustering characteristics and dynamic evolution of fertilizer application intensity, this study employs the non-parametric Kernel Density Estimation (KDE) method [14]. This approach overcomes the limitations of traditional discrete point analysis by quantitatively characterizing the probability density distribution and spatiotemporal trends of fertilizer application intensity. Compared to spatial autocorrelation methods, which rely heavily on discrete classifications, KDE generates a continuous probability density surface, enabling the identification of spatial polarization or diffusion effects. This provides an effective visualization tool for detecting fertilizer application hotspots and tracing gradient transition paths.
The kernel density estimation function for fertilizer application intensity is defined as [15]:
where x represents the point at which the density is estimated, xi denotes the observed fertilizer application intensity for province i, and K(⋅) is the kernel function. In this study, the Gaussian kernel is adopted to balance estimation smoothness and local sensitivity, expressed as:
The bandwidth parameter h determines the degree of smoothness of the density curve. Following Silverman’s rule of thumb, the optimal bandwidth is calculated as:
where σ is the sample standard deviation and IQR is the interquartile range.
By generating kernel density curves, this study compares the number of peaks, peak positions, and distribution skewness to reveal the dynamic process of spatial differentiation in fertilizer application intensity. For instance, a unimodal distribution indicates convergence of fertilizer intensity at a national scale, whereas a multimodal distribution suggests significant gradient disparities among sub-regions. Furthermore, when combined with gravity center migration paths derived from standard deviation ellipse modeling, this method facilitates the identification of spatial expansion or contraction patterns in fertilizer application hotspots.
Regional Disparities in Fertilizer Application Intensity
To systematically analyze the sources and hierarchical structure of spatial disparities in fertilizer application intensity, this study employs the Theil Index as a measurement tool. The entropy-based decomposition property of the Theil Index effectively overcomes the limitations of the Gini coefficient in tracing multi-level disparities [13]. Unlike the Gini coefficient, which only reflects overall inequality, the Theil Index allows additive decomposition of total disparity (T) into inter-regional disparity (TQ) and intra-regional disparity (TD). This enables the identification of the dominant spatial scale driving fertilizer application differences, providing a quantitative basis for formulating targeted fertilizer reduction policies.
The total Theil Index (T) is defined as the weighted information entropy of each province’s fertilizer application intensity relative to the national mean, calculated as follows:
where T represents the total Theil Index, indicating the overall inequality in fertilizer application intensity across all provinces; N is the total number of provinces; yi denotes the fertilizer application intensity in province i; and
The Theil Index can be further decomposed into two components: inter-regional disparity and intra-regional disparity, which reveal the sources of spatial heterogeneity. The inter-regional disparity (TQ) is calculated as:
where TQ reflects disparities between different regions; R is the number of regions; Nr is the number of provinces within region r; and
The intra-regional disparity (TD) is calculated as:
where TD measures inequality within each region, and Tr is the Theil Index for region r, computed using the same formula as the total Theil Index.
Spatial Autocorrelation Analysis
This study adopts the spatial autocorrelation framework proposed by Anselin, integrating both Global Spatial Autocorrelation and Local Spatial Autocorrelation perspectives to systematically reveal the spatial clustering patterns and hotspot-coldspot dynamics of fertilizer application intensity. By quantifying the similarity of attribute values among geographically proximate regions, this method effectively identifies spatial spillover effects and gradient transition paths in fertilizer use behavior [16].
The Global Moran’s I index is employed to assess the overall spatial distribution pattern of fertilizer application intensity across China. The formula for Global Moran’s I is defined as:
where n is the number of provinces, Wij denotes the spatial weight matrix representing the adjacency relationship between provinces i and j, xi and xj are the fertilizer application intensities of provinces i and j, respectively, and
I>0 indicates positive spatial autocorrelation (i.e., similar values cluster together);
I<0 indicates negative spatial autocorrelation (i.e., dissimilar values cluster);
I=0 suggests a random spatial distribution.
To further explore spatial heterogeneity and detect localized spatial association patterns, this study utilizes Local Indicators of Spatial Association (LISA) to evaluate intra-regional spatial correlations of fertilizer application intensity. The LISA statistic for province iii is calculated as:
where Ii represents the local spatial autocorrelation index for province i.
When Ii>0, it indicates positive local spatial correlation, including High-High (HH) and Low-Low (LL) clusters.
When Ii<0, it indicates negative spatial correlation, identifying High-Low (HL) and Low-High (LH) outlier patterns, reflecting significant disparities in fertilizer intensity between neighboring provinces.
The statistical significance of local clusters is assessed using Monte Carlo simulations with 999 permutations (p<0.05). LISA cluster maps are generated to visualize spatial anomalies and localized aggregation patterns throughout the study period.
Standard Deviation Ellipse Analysis
This study applies the Standard Deviational Ellipse (SDE) method to quantify the spatial distribution characteristics of fertilizer application intensity, including center shifts, directional trends, and dispersion patterns [17]. This method overcomes the static limitations of traditional centroid models by utilizing eigenvalue decomposition of the covariance matrix to construct ellipses that capture approximately 68% of the spatial distribution. The morphological parameters of the ellipse dynamically reflect spatial expansion modes and path dependency effects in fertilizer application intensity.
The weighted mean center (
The covariance matrix is constructed as:
where σx2 and σy2 represent the variances along the X and Y axes, respectively, and σxy is the covariance between x and y.
The principal direction angle θ is derived through eigenvalue decomposition:
The rotation angle θ∈[0°,180°] determines the orientation of the ellipse’s major axis. The lengths of the major axis
Data Processing
Raw data were compiled and organized using Excel 2021. Visualization and statistical analyses, including spatial mapping and graphical outputs, were performed using Python 3.13, specifically leveraging the Matplotlib 3.5.1 library and associated toolkits.
Regional Classification
To further investigate spatial disparities in fertilizer application intensity across China, this study adopts the regional division standard issued by the National Development and Reform Commission, categorizing 31 provincial-level administrative units into three major regions:
Eastern Region: Comprising 11 provinces and municipalities—Beijing, Tianjin, Hebei, Liaoning, Shanghai, Jiangsu, Zhejiang, Fujian, Shandong, Guangdong, and Hainan. This region is characterized by a developed economy, advanced agricultural modernization, and a well-established vegetable production and distribution system, serving as China’s core zone for facility agriculture and intensive cultivation.
Central Region: Including 8 provinces—Jilin, Heilongjiang, Shanxi, Anhui, Jiangxi, Henan, Hubei, and Hunan. As a traditional agricultural heartland, this region has undertaken significant agricultural restructuring during China’s green transition, featuring extensive vegetable cultivation areas, high production volumes, and pronounced regional development imbalances.
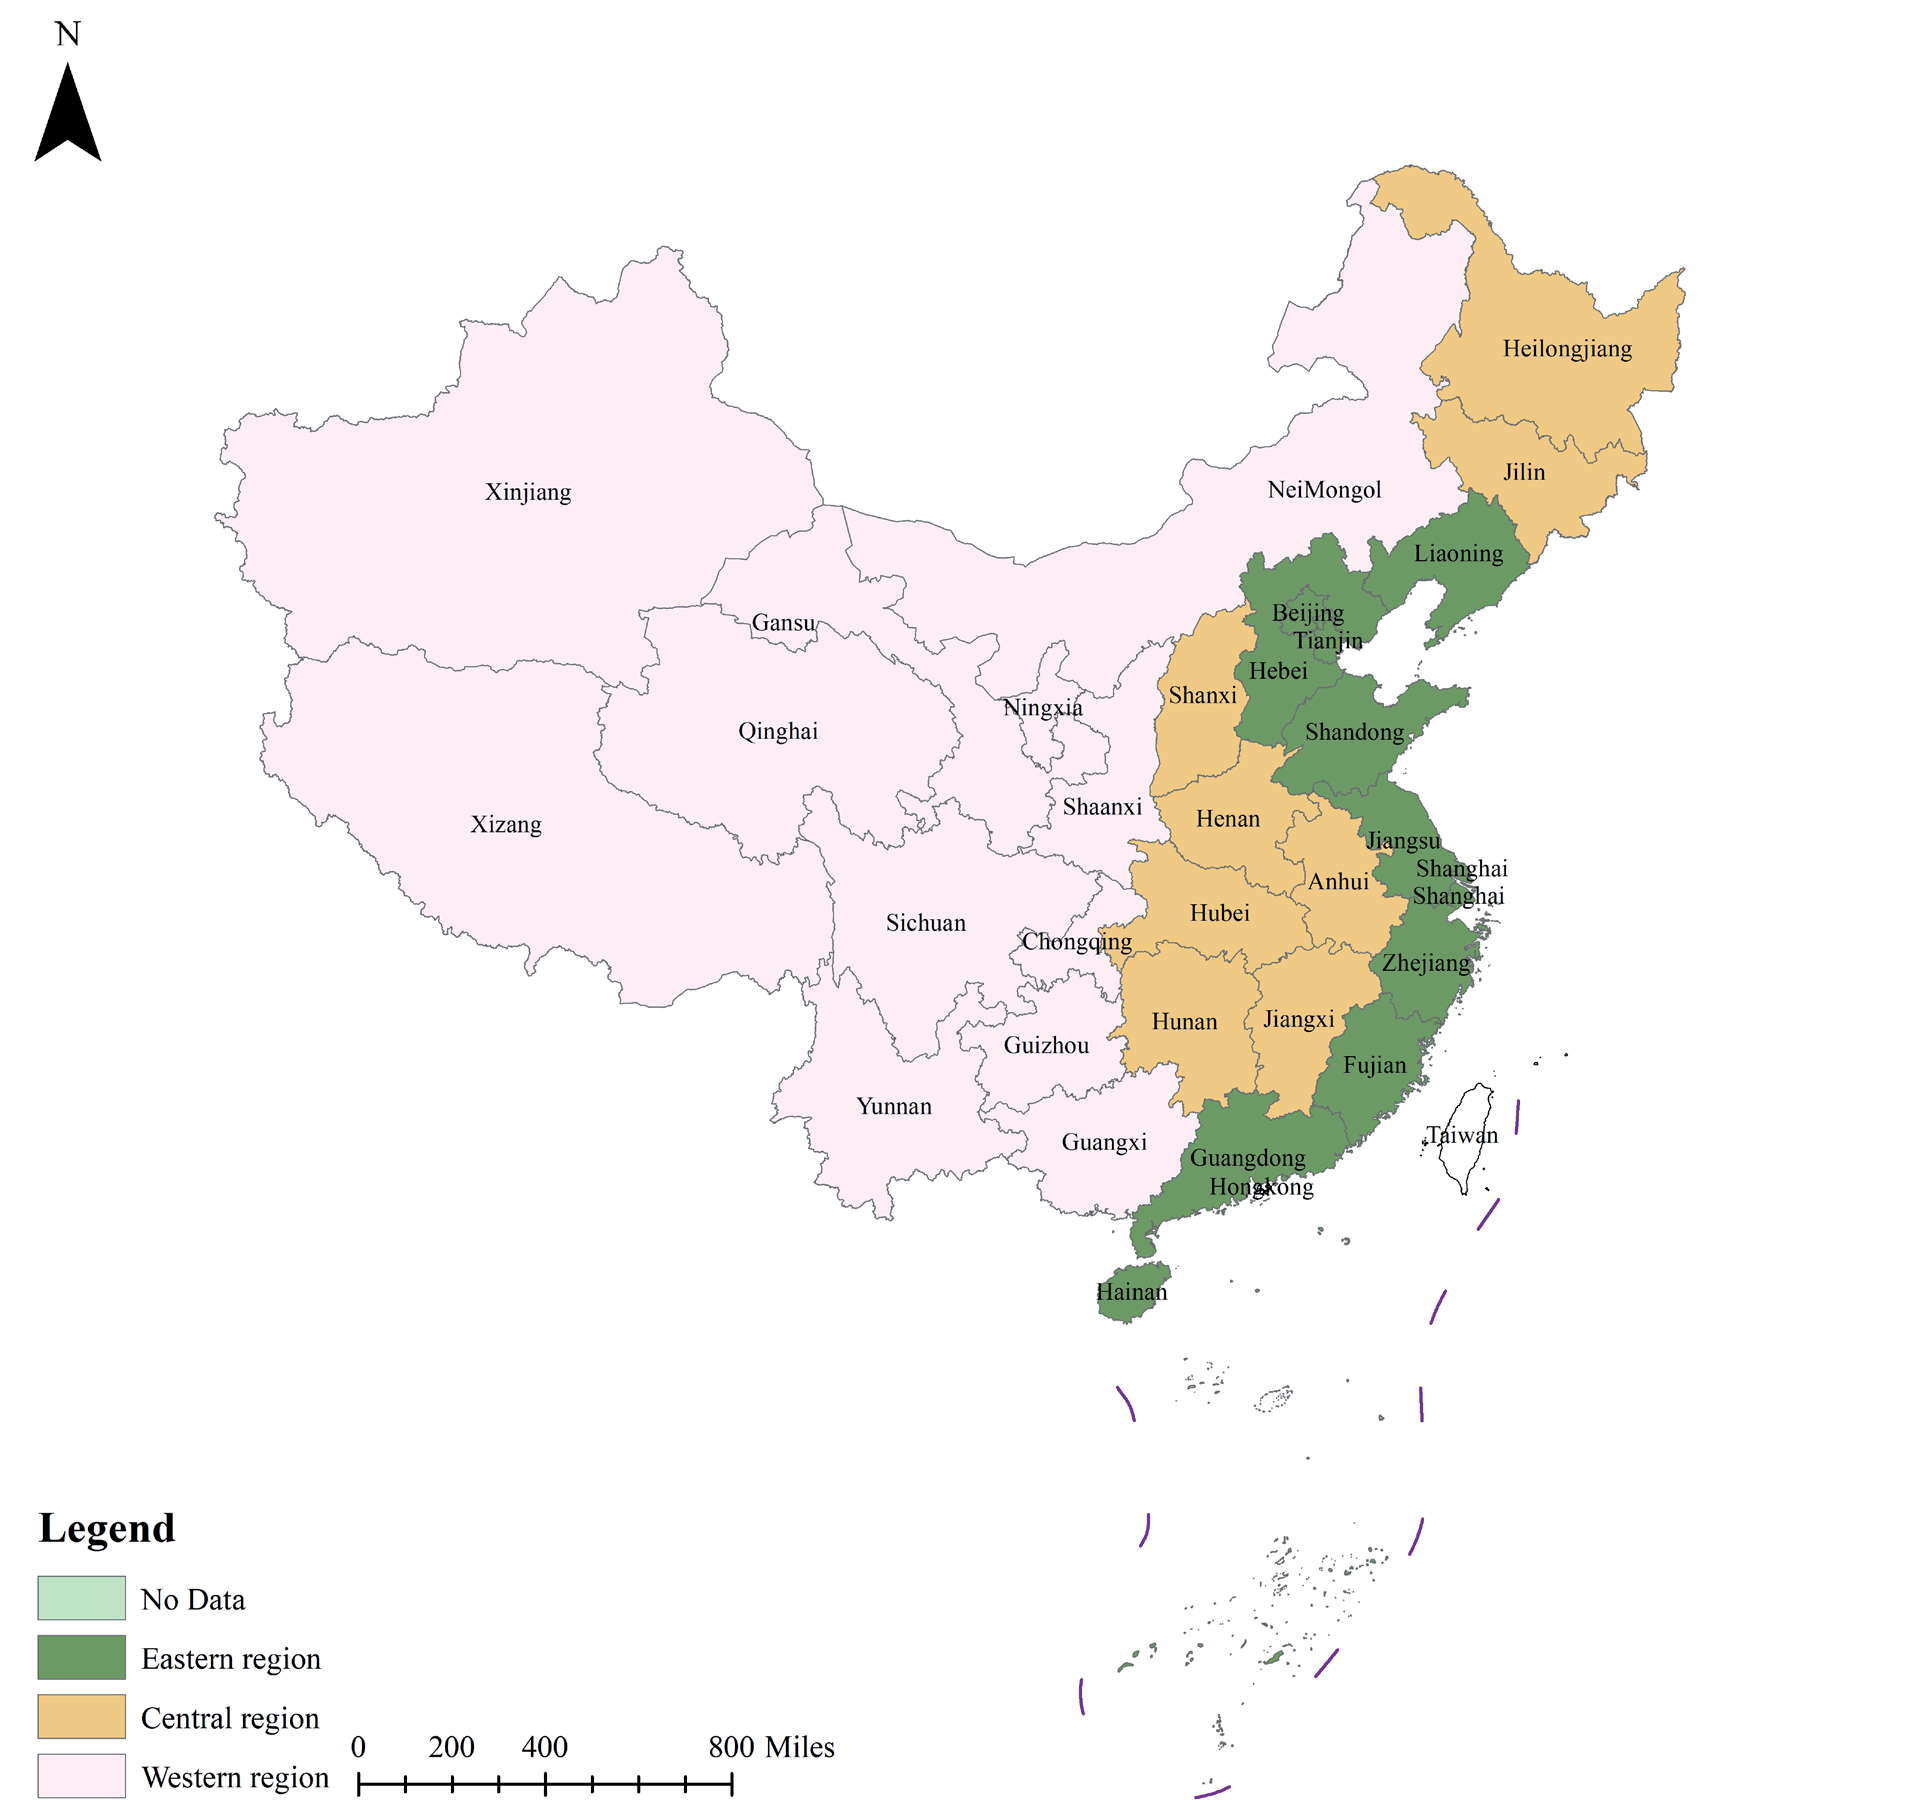
Western Region: Consisting of 12 provinces, autonomous regions, and municipalities—Inner Mongolia, Guangxi, Chongqing, Sichuan, Guizhou, Yunnan, Tibet, Shaanxi, Gansu, Qinghai, Ningxia, and Xinjiang. This region covers most of China’s ecologically fragile zones, with relatively weak agricultural infrastructure, and represents a key focus area for national green agricultural development initiatives (Fig. 1).
Results
Fertilizer Application Intensity
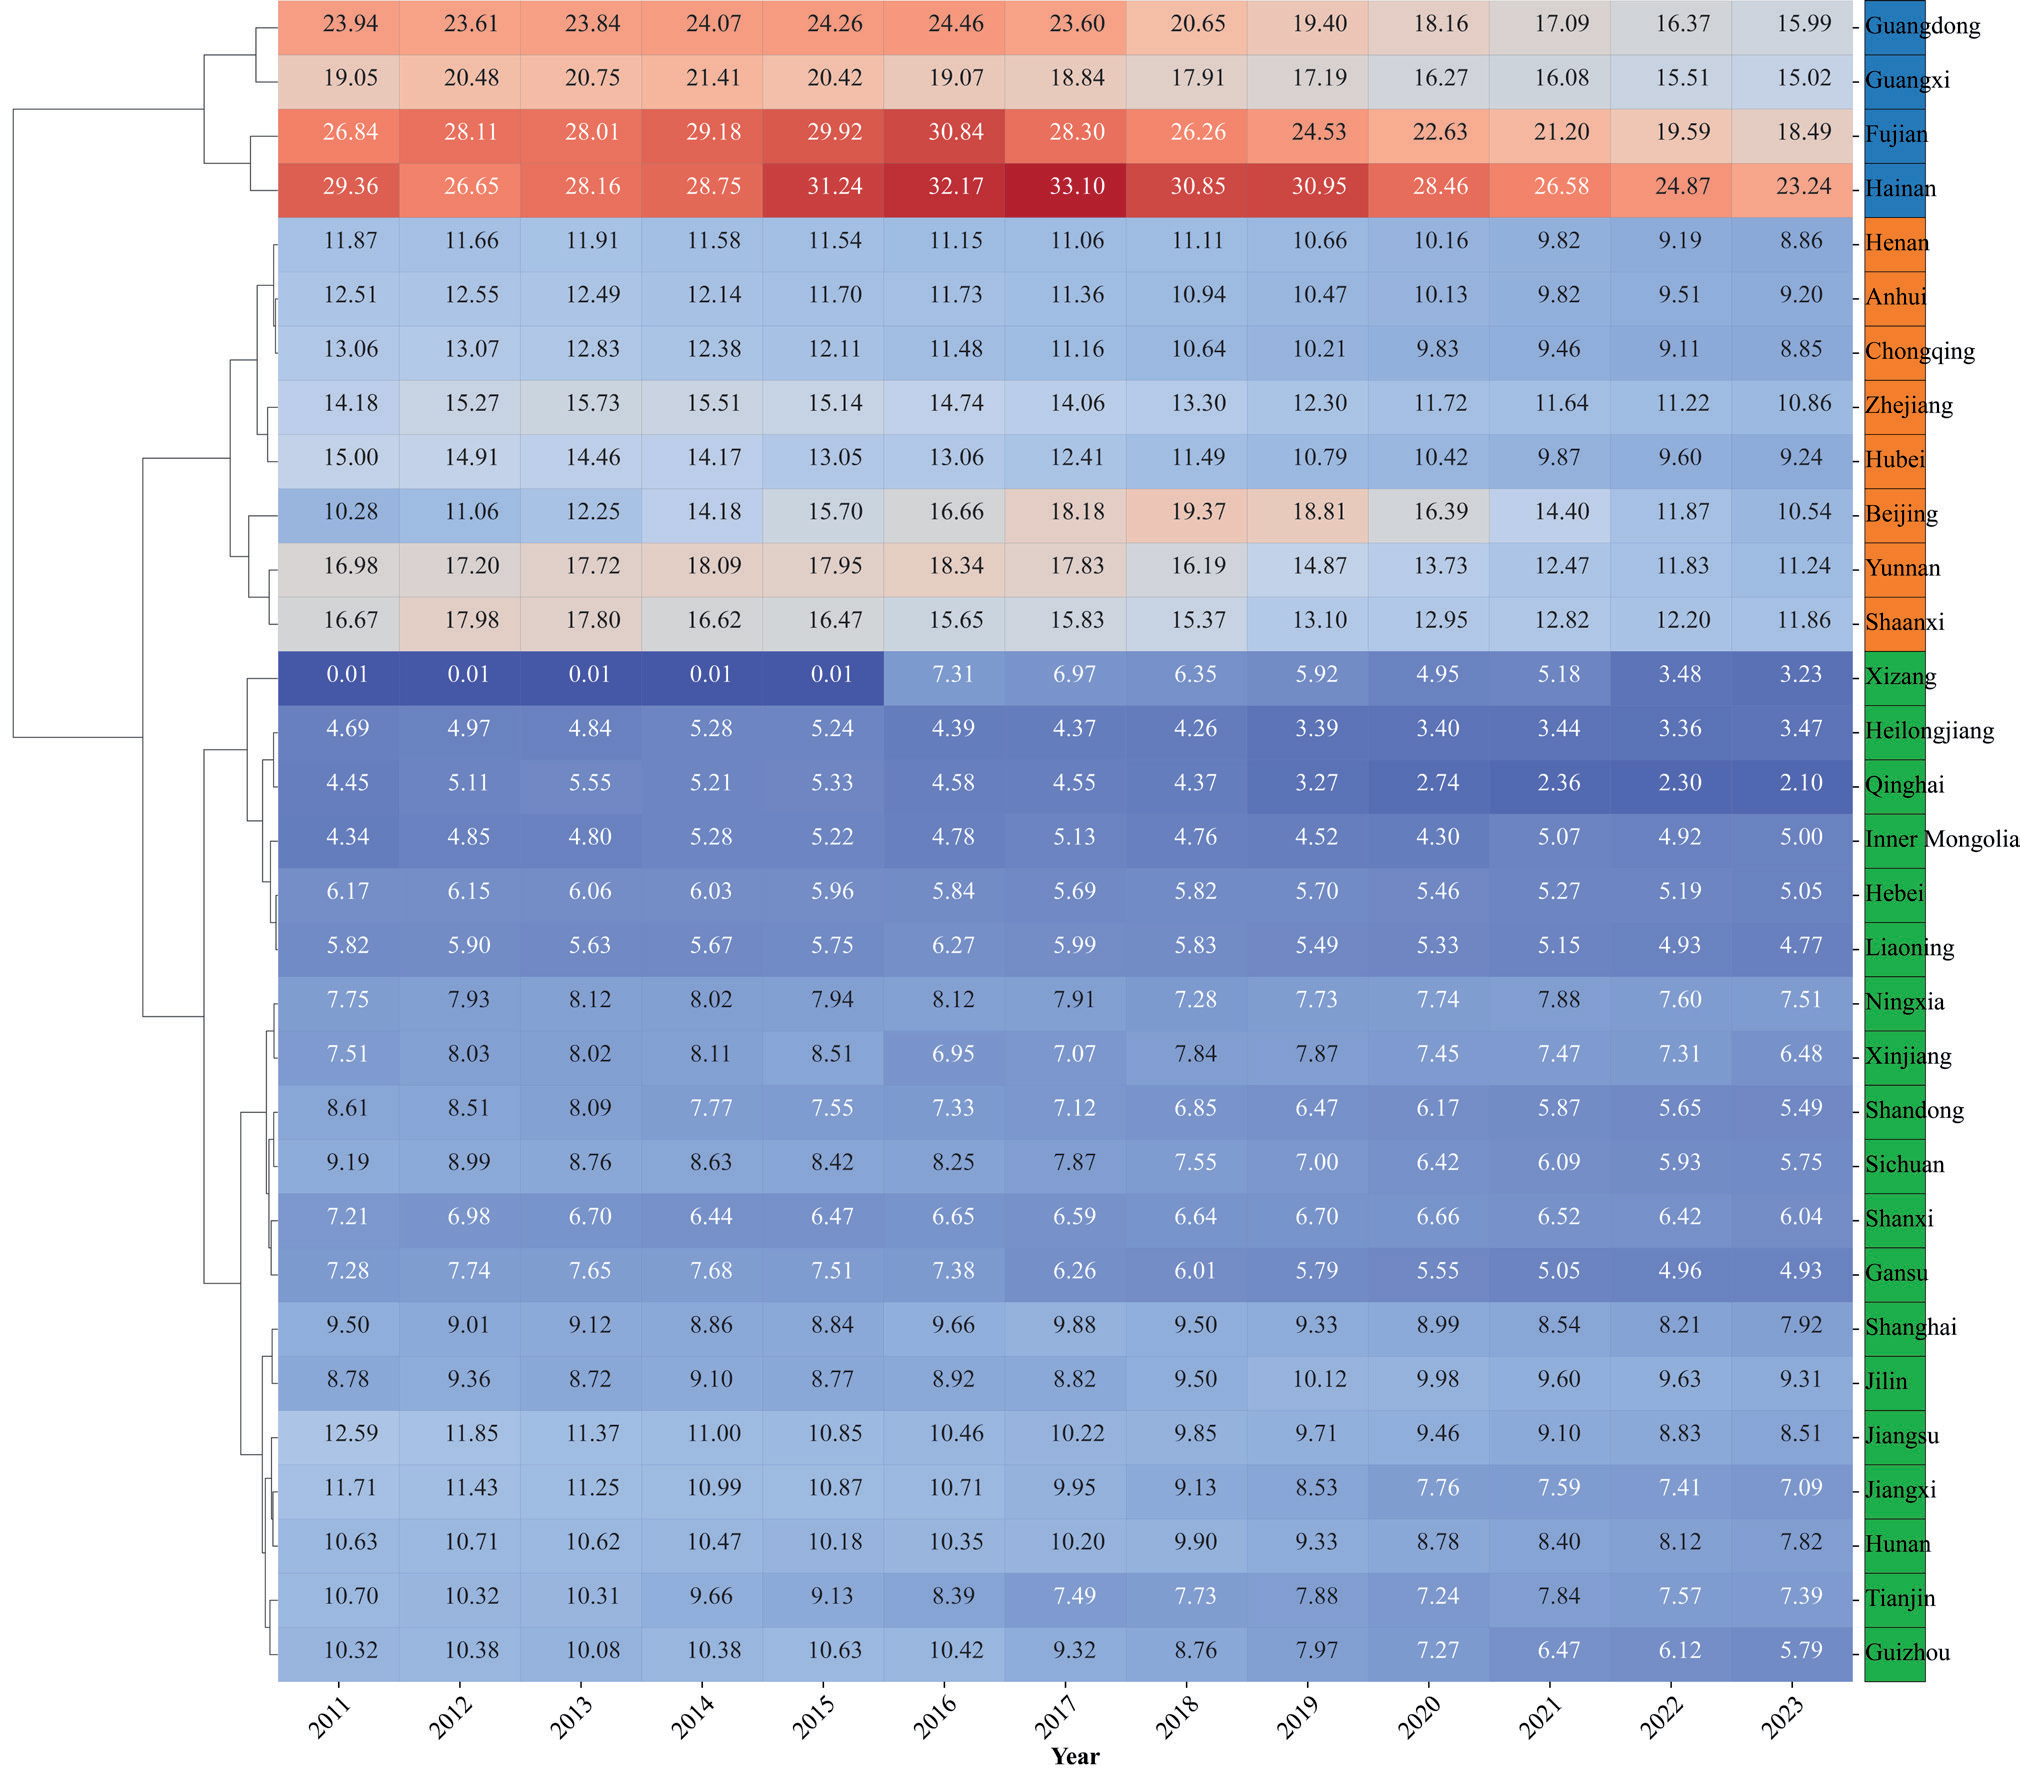
Based on the cluster heatmap of fertilizer application intensity in vegetable production across 31 Chinese provinces from 2011 to 2023, the distribution demonstrates distinct temporal phases and notable regional disparities. Using 2017 as a policy inflection point, the evolution of vegetable fertilization can be divided into two periods: the pre-implementation phase (2011–2017), characterized by conventional fertilization patterns, and the post-implementation phase (2018– 2023), marked by optimization aligned with green agricultural policies (Fig. 2).
Between 2011–2017, fertilizer intensity remained high nationwide, exhibiting a right-skewed distribution and significant inter-regional variation. Southern coastal provinces such as Hainan, Guangdong, Guangxi, and Fujian consistently reported elevated intensities, often exceeding 20 units annually and surpassing 30 units in some years. These regions, characterized by warm climates and high cropping indices, experienced frequent cultivation cycles and intensive fertilization, leading to fertilizer levels well above the national average. In contrast, northern and northwestern provinces— including Heilongjiang, Inner Mongolia, and Gansu— maintained consistently low intensities, typically below 10 units, reflecting structural constraints on chemical inputs despite favorable agroecological conditions.
After 2018, with the accelerated implementation of the Rural Revitalization Strategy and green development goals, most provinces experienced a significant decline in fertilizer use intensity. High-input provinces such as Hainan and Guangdong remained at the upper end but showed evident convergence trends. The central region exhibited a more pronounced shift, as provinces like Henan, Hubei, and Anhui—formerly moderate- to high-intensity areas—demonstrated sustained declines, transitioning to lower-intensity clusters. This reflects the effective rollout of green policy instruments and technology adoption.
In the western region, changes were relatively modest. Provinces such as Guizhou and Yunnan fluctuated slightly but remained largely within the medium-to-low intensity range, suggesting that infrastructural limitations, input structures, and low technology uptake may have weakened policy impacts. However, provinces like Chongqing and Sichuan, traditionally moderate-intensity regions, began a gradual transition toward low-input models, reflecting progressive adaptation to national strategies in central-western peripheries.
The clustering structure reveals three distinct categories of fertilization behavior:
1. High-Intensity Stable Zones (represented by the South China coastal region),
2. Moderate-Intensity Declining Zones (centered in the Central Plains), and
Low-Intensity Stable Zones (primarily in northern and northwestern regions). While these clusters began to converge after 2018, the boundaries remained clear, suggesting that despite the nationwide push for green transformation under the Rural Revitalization Strategy, regional heterogeneity in fertilization practices persists and requires tailored management approaches.
In conclusion, 2017 marked a turning point in China’s vegetable fertilization trajectory. The earlier phase featured widespread high inputs and spatial polarization, whereas the latter phase has shifted toward input efficiency and regional convergence. Although policy guidance has clearly facilitated this transformation, local variation in conditions and governance capacity has led to uneven outcomes. Future initiatives should prioritize region-specific coordination and differentiated policy implementation to further advance sustainable fertilizer management.
Kernel Density Estimation of Fertilizer Application Intensity
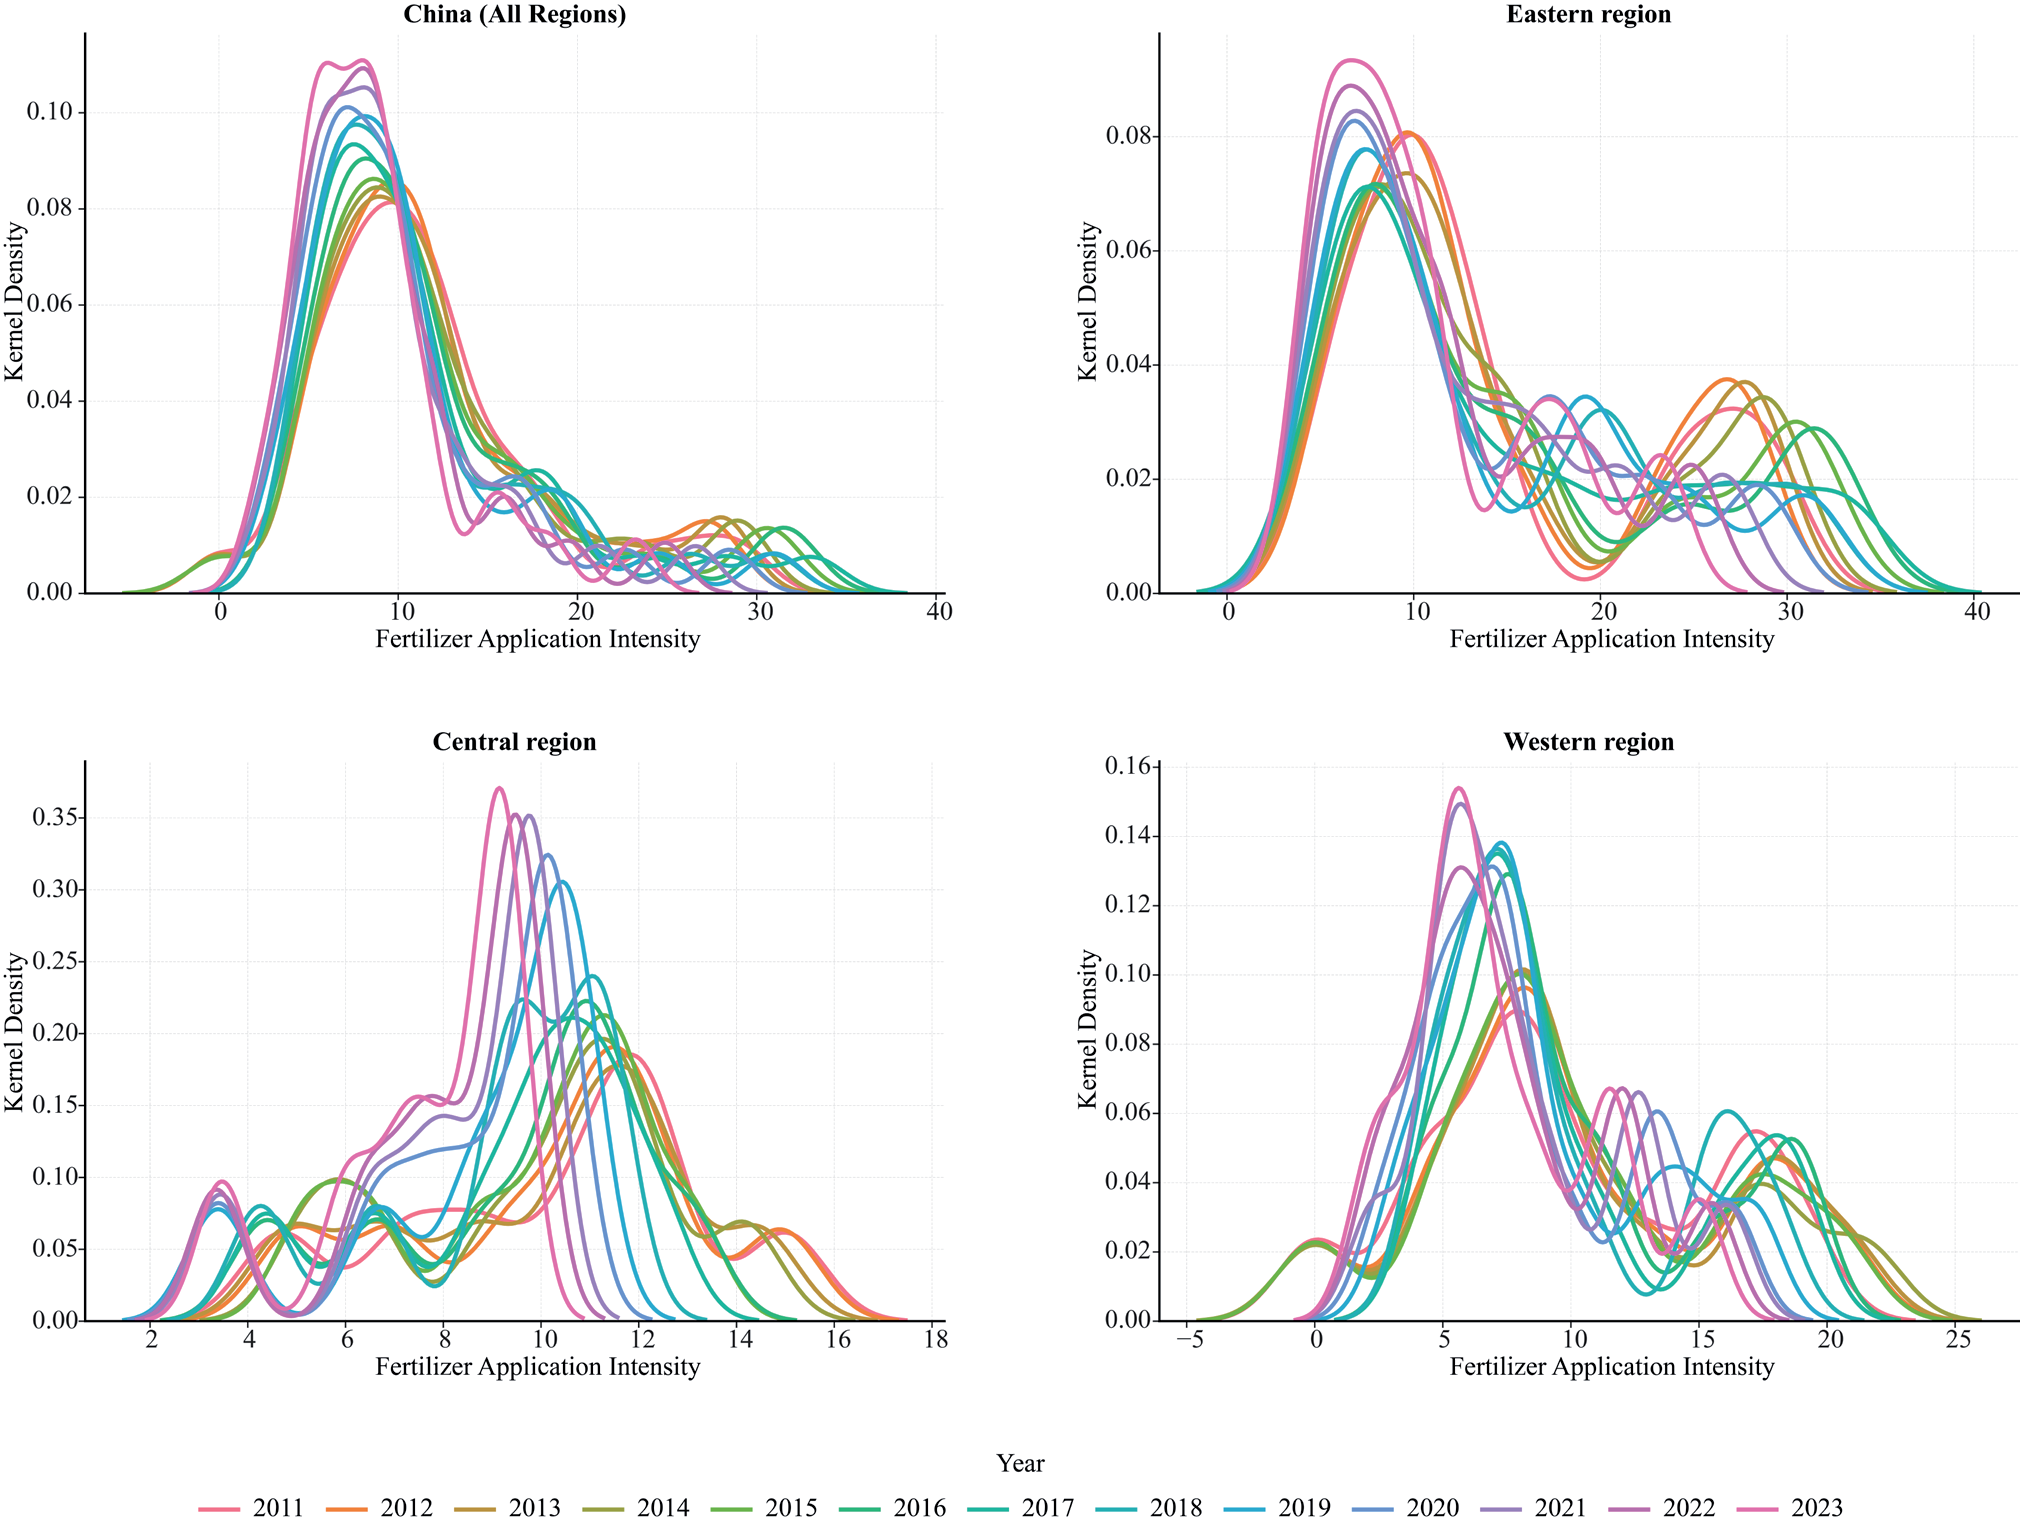
Kernel density estimation (KDE) results reveal the spatiotemporal evolution of fertilizer application intensity in China's vegetable sector, highlighting distinct shifts before and after the launch of the Rural Revitalization Strategy in late 2017. At the national level, the pre-policy period (2011–2017) exhibited a right-skewed unimodal distribution, with peaks concentrated between 8 and 15 units. This pattern reflects a high-input cultivation model characterized by the widespread use of chemical fertilizers and the absence of standardized fertilization guidelines— typical of early-stage agricultural modernization. In the post-policy period (2018–2023), KDE curves shifted significantly leftward, accompanied by a narrower distribution range. This reflects a clear transition toward reduced and standardized fertilization practices under policy influence. The contraction of the distribution tail further indicates the effective suppression of excessive fertilizer use in some regions.
Regionally, the eastern provinces displayed broad distributions and dispersed curve shapes in both periods. Although high-intensity observations declined after 2018—signaling an initial policy impact—the diversity of the curves suggests ongoing coexistence between eco-friendly practices and traditional high-input models. In the central region, KDE curves became increasingly concentrated post-2018, with intensity levels shifting toward lower ranges. This indicates a strong policy response, widespread adoption of green technologies, and effective local governance and extension services. The western region showed a more complex trajectory. Prior to 2018, the KDE curves were bimodal and volatile, reflecting uneven fertilizer management and delayed modernization. Following policy implementation, the curves gradually moved toward medium-to-low intensities, with a marked contraction in the right tail. This points to gradual progress in green practices, although structural challenges—such as underdeveloped infrastructure and fragmented institutional systems— continue to hinder balanced development (Fig. 3).
Regional Disparities in Fertilizer Application Intensity
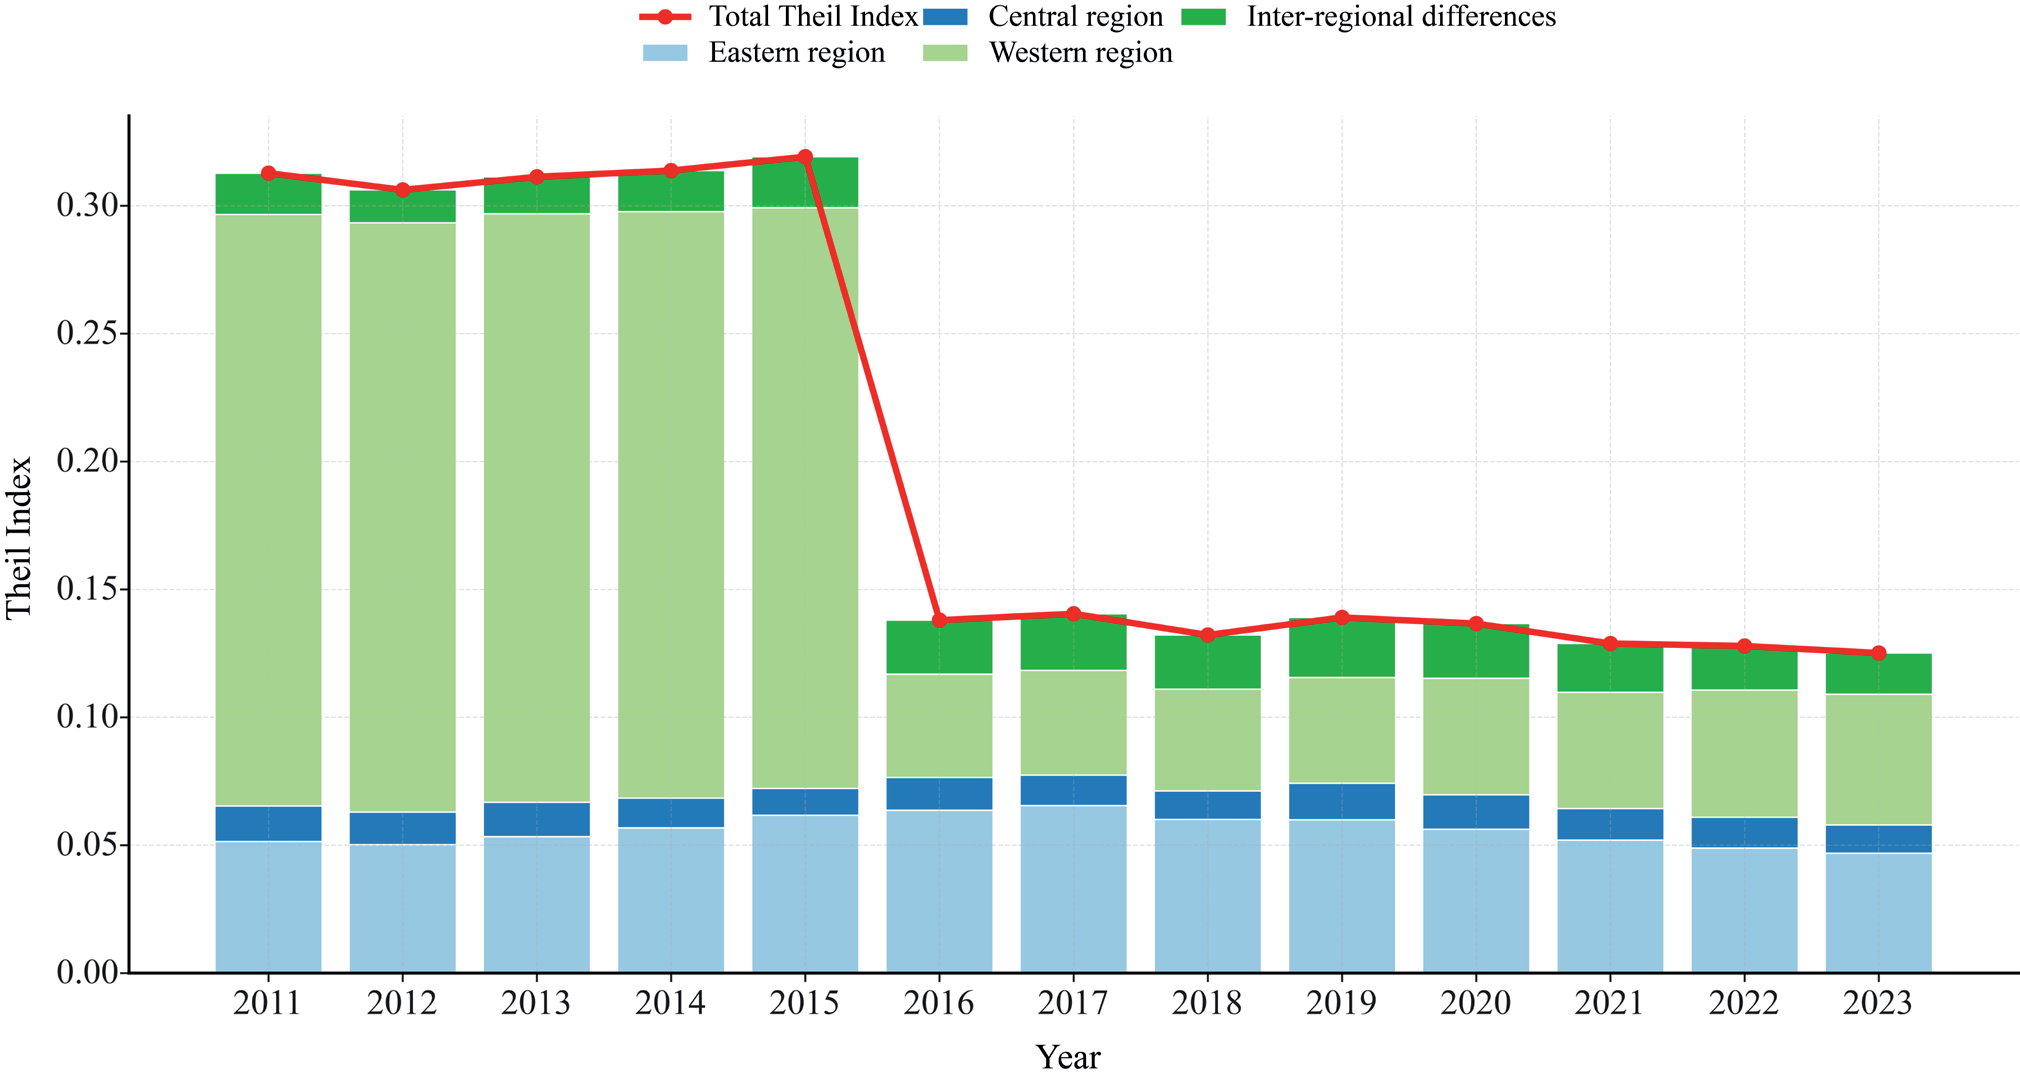
The Theil index decomposition results indicate that regional disparities in fertilizer application intensity within China’s vegetable production system underwent significant structural changes between 2011 and 2023. During the period from 2011 to 2017, the national Theil index remained at a relatively high and stable level, fluctuating around 0.30. This suggests that prior to the implementation of the Rural Revitalization Strategy, there was considerable regional imbalance in fertilizer application intensity, with pronounced polarization across different areas. Throughout this phase, the western region contributed the largest share to overall disparities, consistently dominating the spatial inequality landscape, while intra-regional disparities within the eastern and central regions remained comparatively minor and stable.
However, starting in 2018, driven by the systematic advancement of the Rural Revitalization Strategy and sustained green agriculture policies, the total Theil index experienced a sharp decline—from 0.31 in 2017 to approximately 0.14 in 2018—followed by slight fluctuations and a gradual downward trend in subsequent years. This abrupt shift signifies a marked convergence in regional fertilization practices under policy intervention, reflecting a trend towards homogenization of fertilizer application intensity. These findings align with the kernel density estimation results, where post-2018 distributions showed a clear leftward shift and narrowing of peaks, indicating that high-intensity fertilization patterns have been progressively replaced by medium- and low-intensity practices.
From a structural decomposition perspective, prior to the Rural Revitalization Strategy, the western region consistently accounted for over 50% of total disparity. This was primarily due to its complex terrain, uneven adoption of fertilization technologies, and lower levels of infrastructure and digital connectivity, which exacerbated regional imbalances. Following policy implementation, although the western region continued to contribute the largest share to inequality, its proportion declined significantly, suggesting the gradual diffusion of green fertilization technologies and ecological agriculture concepts, alongside initial improvements in regional governance effectiveness. Concurrently, the central region’s contribution to the disparity slightly increased, highlighting its growing role in fertilizer structure adjustment within China’s agricultural heartland.
Inter-regional disparities—reflecting the overall imbalance among the eastern, central, and western regions—declined notably after 2018, indicating a national trend toward regional coordination. However, intra-regional disparities remained relatively stable or declined more slowly, especially within the western and central regions, where internal structural differences and uneven technology diffusion limited full convergence. This indicates an enhanced convergence and coordination effect in national fertilization regimes within vegetable production. This trend is further corroborated by the clustering patterns observed in the heatmap, where numerous provinces shifted from high-intensity clusters towards medium- and low-intensity zones, with cluster boundaries becoming increasingly blurred post-2018. Such developments reflect a gradual movement towards a unified fertilization framework across regions.
In summary, prior to the implementation of the Rural Revitalization Strategy, fertilizer application behavior in China’s vegetable sector was characterized by distinct regional segmentation, with high- and low-intensity zones coexisting and significant disparities prevailing. Following the strategy’s rollout, policy guidance, green input reforms, technological diffusion, and infrastructure improvements collectively accelerated regional convergence, leading to a substantial reduction in the Theil index and a progressive transition toward balanced, eco-friendly fertilization practices. This indicates that fertilizer management in China has shifted from a phase of "structural polarization" to one of "coordinated convergence." Nevertheless, intra-regional disparities persist, underscoring the need for continued promotion of region-specific precision fertilization strategies and institutional innovation to ensure the long-term realization of sustainable agricultural development goals (Fig. 4).
Spatial Autocorrelation Analysis of Fertilizer Application Intensity
The global spatial autocorrelation analysis of fertilizer application intensity in vegetable production across China from 2011 to 2023, based on Moran’s I index, reveals a significant positive spatial correlation. Moreover, the results indicate a gradual transition from high spatial clustering to lower spatial dependence over time. In 2011, Moran's I value was 0.2826, with a Z-score of 2.9724 and a p-value below 0.01, indicating a highly significant spatial aggregation pattern. This suggests that provinces with high fertilizer intensity were geographically clustered with other high-intensity provinces, while low-intensity areas similarly exhibited spatial coupling (Table 1).
During the pre-policy phase (2011–2017), prior to the launch of the Rural Revitalization Strategy, Moran’s I values showed a slight downward trend but remained relatively high, averaging around 0.25. This indicates that fertilizer application intensity in vegetable production was strongly influenced by spatial proximity effects, with pronounced regional fertilization patterns. Specifically, homogeneous fertilization behaviors were evident within both the eastern coastal provinces and the western plateau regions, forming distinct spatial clusters.
Following the implementation of the Rural Revitalization Strategy in 2018, Moran’s I value dropped below 0.1826, reflecting a significant weakening of spatial clustering effects. Between 2018 and 2023, Moran’s I remained at lower levels, fluctuating between 0.1725 and 0.1937. Although Z-scores consistently exceeded critical significance thresholds, the p-values increased annually, indicating a steady decline in the strength of spatial correlation. This suggests that fertilization practices began to break away from traditional "geographical inertia," shifting towards greater diversification and spatial equilibrium. Such changes can largely be attributed to the widespread dissemination of green agriculture concepts and the promotion of region-specific fertilization technologies under policy guidance. Consequently, fertilization behavior has become increasingly influenced by factors such as industrial restructuring, technological empowerment, and institutional innovation, rather than merely geographic proximity.
Notably, after 2020, while Moran’s I values remained positive, fluctuations stabilized, and the spatial distribution pattern became more balanced. This reflects an emerging convergence effect in regional fertilizer intensity, with spatial inequalities being mitigated. These findings are consistent with the structural changes observed in the Theil index and the blurring of cluster boundaries in the heatmap analysis, collectively indicating a shift in China’s fertilization practices from spatial polarization towards spatial coordination.
In conclusion, fertilizer application intensity in China’s vegetable production has exhibited a clear temporal trend, evolving from strong spatial clustering to weaker spatial correlation, particularly since the implementation of the Rural Revitalization Strategy. This trend underscores the growing influence of policy interventions, green technology diffusion, and inter-regional interactions, providing robust empirical support for optimizing spatial fertilization structures and fostering coordinated regional fertilization mechanisms.
Local Spatial Autocorrelation Analysis of Fertilizer Application Intensity
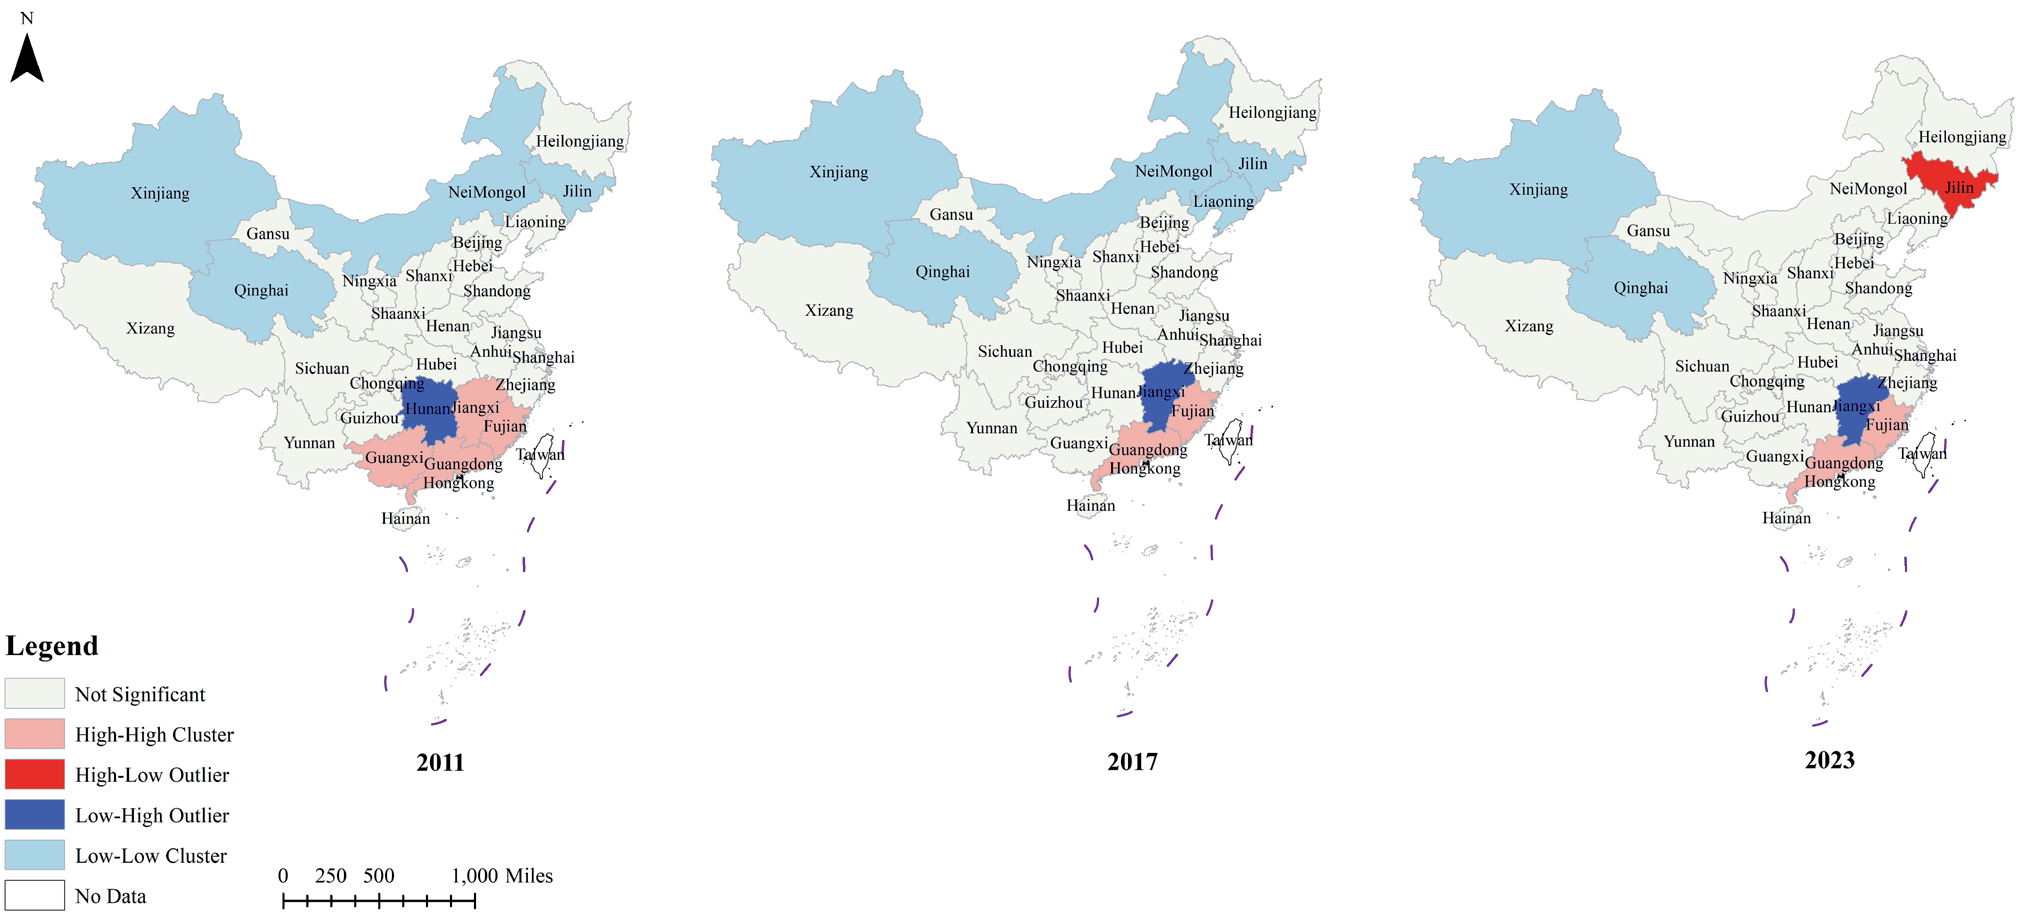
The LISA cluster maps reveal the micro-level spatial clustering patterns and evolutionary dynamics of fertilizer application intensity in China’s vegetable production. Overall, the results from 2011, 2017, and 2023 demonstrate a clear transition from regional polarization to localized coordination, reflecting a progressive optimization of spatial aggregation structures (Fig. 5).
In 2011, the spatial autocorrelation pattern exhibited pronounced polarization characteristics. The southeastern coastal provinces, represented by Guangdong, Guangxi, and Fujian, formed distinct High-High (HH) clusters, indicating consistently high fertilizer application intensity reinforced by neighboring high-value areas. This reflects a dense regional concentration of intensive fertilization practices. Conversely, northwestern provinces such as Xinjiang, Qinghai, and Gansu were identified as Low-Low (LL) clusters, highlighting generally low fertilization levels in ecologically fragile zones and areas with limited agricultural inputs, coupled with strong spatial correlation. Notably, provinces like Hunan and Jiangxi emerged as Low-High (LH) outliers, suggesting that although these provinces maintained low fertilizer intensity, they were surrounded by high-intensity regions, implying potential upward pressure on fertilizer use or positioning at the edge of a green transition zone.
By 2017, while the overall clustering pattern remained evident, initial adjustments were observed. The extent of HH clusters narrowed, becoming concentrated in core production areas such as Fujian, Guangdong, southern Zhejiang, and Jiangxi. This indicates that high-intensity fertilization began to consolidate within key cultivation zones, while peripheral areas showed signs of moderation. The LH outlier regions, still represented by Hunan and Jiangxi, exhibited increased stability, signaling persistent external pressures from neighboring high-intensity zones and underscoring the challenges these areas faced in advancing green transformation. Meanwhile, the boundaries of LL clusters remained relatively stable, with low-value aggregation persisting across the northwestern plateau and northeastern fringes.
By 2023, significant restructuring of local spatial patterns had occurred. HH clusters further concentrated along the Fujian–Jiangxi–Guangdong axis, reinforcing the emergence of a southern core aggregation zone. In contrast, Jilin in northeastern China was identified as a High-Low (HL) outlier, indicating a rapid increase in fertilizer intensity despite the region's generally low baseline. This could be attributed to the expansion of facility-based vegetable production or localized policy incentives. Provinces such as Hunan and Jiangxi continued to appear as LH outliers, reflecting that parts of the central region had yet to fully integrate into a coordinated green development framework, with policy implementation and technology diffusion requiring further enhancement.
Overall, the LISA cluster analysis illustrates a clear trajectory in spatial fertilization behavior, transitioning from polarized aggregation to boundary blurring and ultimately towards stable restructuring. Since the implementation of the Rural Revitalization Strategy, high-intensity fertilization has become increasingly concentrated in a few key areas, while the spatial diffusion of low-intensity zones has diminished. However, the persistent presence of outlier regions— particularly those characterized by "low-value surrounded by high-value" patterns—highlights critical zones for future breakthroughs in coordinated green governance. These boundary areas will be pivotal in advancing spatially integrated strategies for sustainable vegetable production.
Standard Deviation Ellipse Analysis of Fertilizer Application Intensity
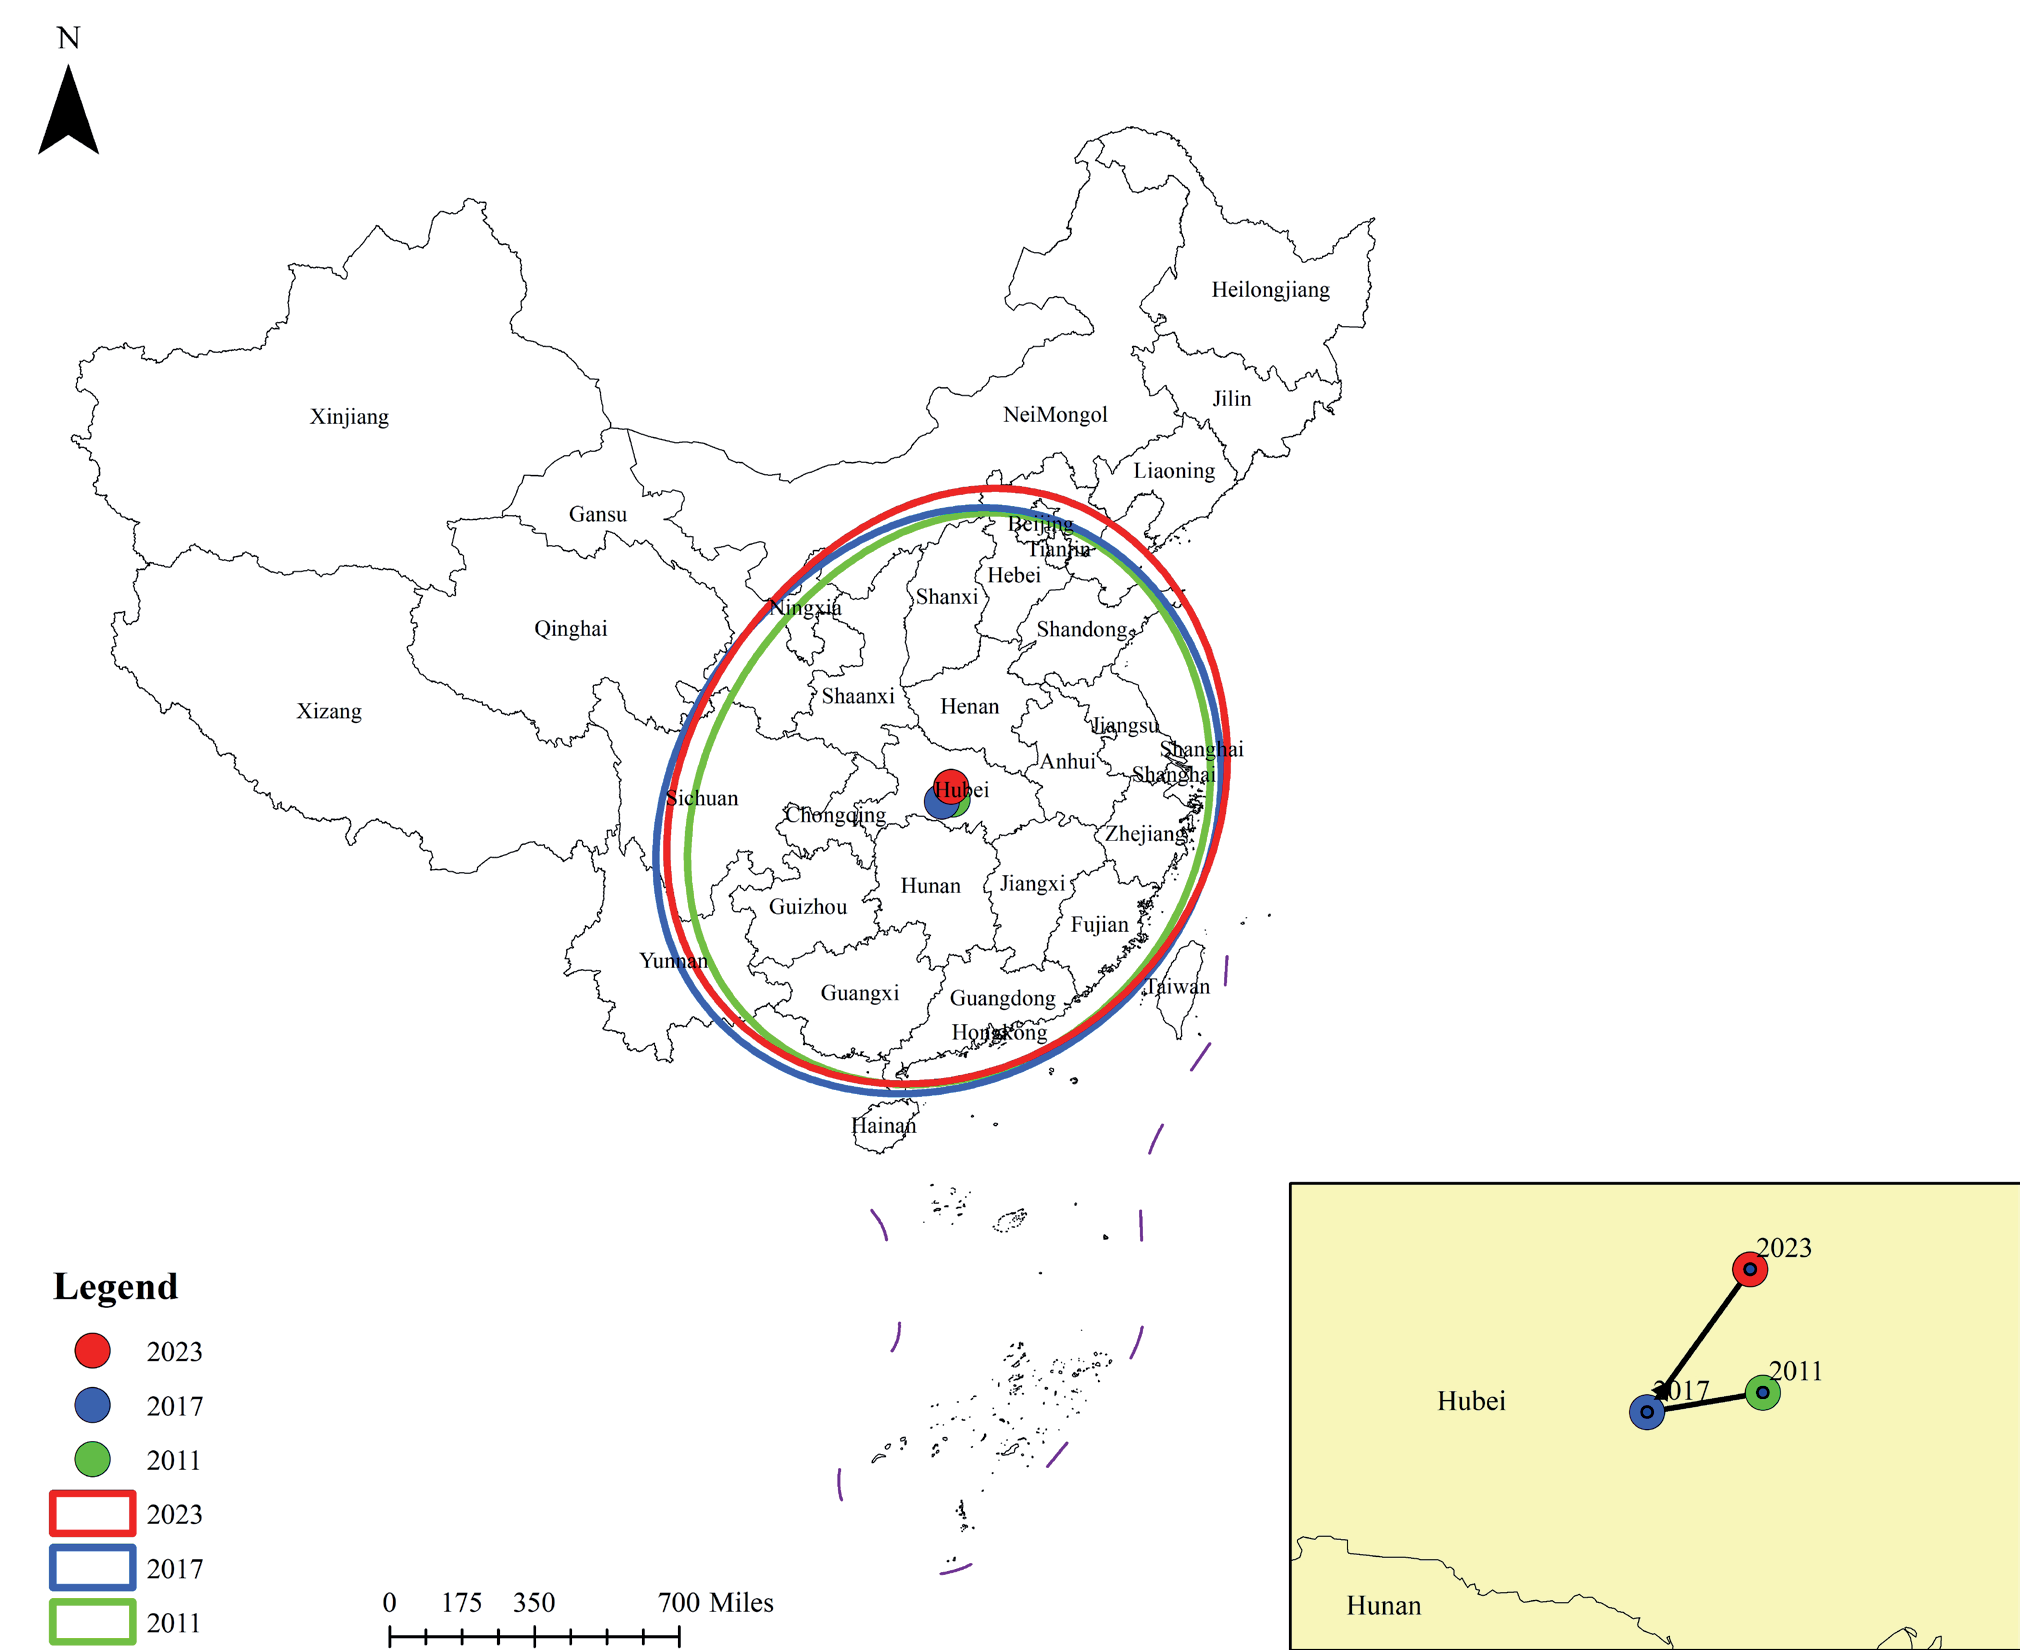
The spatiotemporal decomposition of standard deviation ellipse (SDE) parameters and gravity center migration trajectories reveals the uneven spatial differentiation of fertilizer application intensity under the Rural Revitalization Strategy. Data analysis indicates that the SDE area expanded from 3.2784 million km² in 2011 to 3.6684 million km² in 2023, marking an 11.9% increase. This confirms a significant diffusion trend in the spatial distribution of fertilizer intensity, contrary to the expected policy-driven agglomeration. This phenomenon is closely linked to asynchronous crop structure adjustments and regional disparities in technology adoption. The orientation angle of the ellipse’s major axis increased from 54.1° in 2011 to 62.2° in 2017 before declining to 58.6° in 2023, reflecting a "northeastward shift followed by northwestward adjustment." This trajectory corresponds to the expansion of facility-based agriculture around the Bohai Rim (2011–2017) and the promotion of ecological farming practices in the middle Yangtze River region (2018–2023), highlighting phased policy effects (Fig. 6).
The spatiotemporal analysis of the SDE gravity center reveals pronounced spatial restructuring influenced by policy interventions. According to Haversine calculations, the gravity center of fertilizer application intensity in vegetable production shifted a cumulative 137.5 km between 2011 and 2023, with an average annual movement of 11.5 km/year—significantly higher than the U.S. Corn Belt’s average of 3.2 km/year (2000– 2020). This underscores the strong policy-driven nature of China’s green agricultural transition.
Table 1.
Global spatial autocorrelation analysis of fertilizer application intensity.
The migration trajectory exhibited a three-phase pattern: eastward advance, westward retreat, and northward leap. From 2011 to 2017, the center shifted 72.8 km northeast (12.1 km/year), spatially coupling with the rapid expansion of major facility vegetable production hubs such as Shouguang (Shandong) and Lingyuan (Liaoning). This directional shift aligns closely with the increase in the ellipse’s orientation angle (54.1° → 62.2°), reflecting the dominance of capital-intensive agriculture in shaping spatial patterns. Between 2017 and 2023, the migration path turned northwest, covering 64.7 km (10.8 km/year). The east-west shift registered a net westward movement of 0.36 degrees longitude (111.98°E → 112.35°E), corresponding to organic fertilizer substitution policies in western ecologically fragile areas (e.g., Yan’an’s Green Planting Program launched in 2018). Simultaneously, the north-south shift showed a net northward movement of 0.51 degrees latitude (30.57°N → 31.07°N), aligning with groundwater over-extraction mitigation efforts in the North China Plain (e.g., Hebei’s "fallow-rainfed rotation" model introduced in 2016).
The heterogeneity of spatial diffusion is further highlighted by SDE parameters. The standard deviation along the X-axis increased from 30.64 to 31.07, while the Y-axis rose from 11.11 to 11.87, indicating that east-west diffusion intensity exceeded north-south expansion by 63.5%. This reflects the deep-rooted gradient between capital-intensive agriculture in eastern coastal regions and smallholder economies in central-western China. In contrast to international experiences, the SDE area for fertilizer intensity in the U.S. Corn Belt grew by only 1.2% between 2000 and 2020, whereas China recorded an 11.9% increase over a similar period— highlighting the compounded challenges of agricultural intensification and green transition in developing countries.
The orientation angle peaked at 62.2° in 2017, directly linked to the implementation of the Northeast Black Soil Protection Plan, which restructured fertilization behavior by shifting high-intensity zones towards the northwest dryland agricultural belt through zoned arable land management.
Moreover, the short-axis standard deviation in 2023 increased by 7.3% compared to 2011, significantly outpacing the long-axis growth of 1.4%, indicating accelerated north-south spatial divergence. This is attributed to fragmented farmland in southern hilly areas limiting technology diffusion, while large-scale operations in northern plains promoted fertilization standardization—creating structural contrasts. This phenomenon echoes Japan's agricultural transition in the 1990s, characterized by east-west convergence and north-south divergence, underscoring the moderating role of geographic conditions on policy effectiveness.
The study further reveals that the spatial evolution of fertilizer application intensity in China has transcended the traditional core-periphery diffusion model, emerging as a multi-polar, dynamic spatial structure, thereby posing greater challenges for the design of differentiated governance mechanisms.
Discussions
The spatiotemporal evolution of fertilizer application intensity in vegetable production reflects not only the spatial manifestation of China's agricultural green transition under specific institutional frameworks but also the policy responses shaped by the interplay between regional resource endowments and production logics. From the multidimensional analytical perspective constructed in this study, this evolution demonstrates a clear trend of "reduction—convergence— intensification." More importantly, it reveals a critical insight: green agricultural policies do not advance uniformly but undergo phased restructuring under the tension between structural inertia and policy traction, leading to an orderly reconfiguration of spatial clustering patterns and gravity centers.
Temporally, the introduction of the Rural Revitalization Strategy established a new paradigm of agricultural development, prioritizing green orientation and quality-driven growth, with 2017 marking a pivotal point for spatial restructuring [18, 19]. The sharp decline in the Theil index represents more than a numerical drop; it signifies a systemic transition from a regionally dominated phase to a coordinated governance phase in fertilizer management. The leftward shift and narrowing of the kernel density curves superficially indicate reduced fertilizer intensity but, in essence, reflect the diffusion of green fertilization concepts through institutional reforms and technological dissemination. Policy interventions have not only altered total fertilizer usage but have also fundamentally reshaped its spatial distribution.
Spatially, the clustering pattern of fertilizer application intensity has undergone a dynamic process characterized by high-value contraction, boundary solidification, and northward gravity center migration. The previously prominent High-High clusters (e.g., Fujian, Guangdong, Jiangxi) identified in LISA analyses have gradually transformed into peripheral high-value zones, suggesting that high-input practices are being selectively replaced [20, 21]. The persistent stability of Low-High outlier regions highlights a significant "spatial lag" in green transformation, where low-intensity areas remain adjacent to high-intensity zones.
The findings from gravity center migration and standard deviation ellipse analyses further illustrate that the pathway of green transition exhibits clear spatial selectivity. Several interacting factors have contributed to the northwestward shift in the fertilizer application center—chief among them are regional economic gradients, agricultural restructuring, and differential policy responsiveness. Specifically, policy components under the Rural Revitalization Strategy, such as the promotion of organic fertilizer substitution in western provinces (e.g., the "Green Planting Program" in Yan’an) and the national incentive framework for ecological agriculture in ecologically fragile areas, have contributed to this spatial transition. Conversely, the consolidation of high-intensity zones in the eastern region is closely tied to greenhouse facility agriculture policies, digital agriculture infrastructure investment, and stricter nitrogen use regulations that emerged after 2018 as part of rural modernization priorities. The central region, benefiting from both industrial scale and geographic accessibility, has emerged as a new core zone for intensive and standardized fertilization practices, indicating that China's green agricultural transition is not a passive diffusion process but is actively shaped by regional attraction capacities and institutional embedding strength.
It is important to emphasize that, despite the overall decline in fertilizer intensity, significant intra-regional heterogeneity persists, even as inter-regional disparities have narrowed. This indicates that while national-level policy efforts have effectively promoted broad regional alignment, local variations in infrastructure, governance capacity, and input structures within each region— especially in the west—continue to drive internal fragmentation. In certain western and peripheral regions, low fertilizer levels are not necessarily driven by green development concepts but are instead the result of weak infrastructure and poor market connectivity. This underscores that green transition should not be equated solely with reduced input levels but must also consider the underlying institutional drivers and capacity alignment.
Furthermore, the "Fertilizer Intensity—Regional Typology—Spatial Mechanism" framework proposed in this study offers a novel lens for understanding spatial coordination mechanisms within agricultural green transitions. On one hand, green transformation is a dynamic process shaped by the interaction between policy directives and regional absorptive capacities. On the other hand, fertilization behaviors across regions exhibit both spatial path dependence and institutional diffusion tensions. Future research could incorporate variables such as institutional networks and policy coupling degrees to explore how spatial synergies in green agricultural governance can be effectively formed.
However, it should be acknowledged that the estimation of vegetable fertilizer use in this study is based on an area-weighted method assuming uniform application rates across crops within each province. While commonly used in empirical research, this assumption may not fully capture crop-specific fertilization differences and thus represents a methodological limitation.
In summary, changes in fertilizer application intensity represent not merely a reallocation of agricultural inputs but the outcome of a complex interplay among spatial structures, policy frameworks, and regional response capacities. Since the implementation of the Rural Revitalization Strategy, the evolution of fertilization practices has followed a distinct trajectory of policy traction—spatial response—structural reconfiguration, providing both empirical foundations and a conceptual paradigm for developing a green transition model tailored to China's agricultural context.
Policy Recommendations
The implementation of China’s Rural Revitalization Strategy has significantly promoted the spatial convergence and regional coordination of fertilizer application intensity in vegetable production. However, the heterogeneity challenges identified in this study call for systematic responses through refined policy design. Based on the multidimensional analytical findings and insights from international experiences, this study proposes the establishment of an integrated policy framework for fertilizer reduction, centered on regional adaptation, technological empowerment, and spatial coordination.
First, it is essential to deepen region-specific governance mechanisms by formulating targeted intervention strategies aligned with the developmental stages of the eastern, central, and western regions. For high-intensity zones in the east (e.g., Guangdong and Fujian), China could draw lessons from the Netherlands' precision nutrient management practices in facility agriculture [22]. This includes mandating dynamic fertilization systems based on crop nutrient diagnostics, supported by real-time soil monitoring through IoT sensors [23], and establishing threshold standards for nitrogen, phosphorus, and potassium inputs in greenhouse vegetable production. In the central transitional regions (e.g., Henan and Hubei), reference can be made to the U.S. Cooperative Extension System by establishing provincial-level green technology transfer centers. These centers would focus on promoting mature technology packages such as integrated water-fertilizer management and organic substitution, while incentivizing adoption through machinery subsidies linked to carbon trading mechanisms [24, 25]. For the ecologically fragile western regions, Japan’s direct payment system for mountainous agriculture offers a valuable model [26]. Fertilizer reduction targets should be incorporated into ecological compensation frameworks, providing tiered subsidies for farmers adopting green manure rotations and biological pest control, alongside investments in cold-chain logistics infrastructure to reduce post-harvest losses and associated fertilizer dependency [27-29].
Second, strengthening spatial coordination networks is critical to addressing the "Low-High" outlier dilemma and bridging institutional gaps. Transitional zones like Hunan and Jiangxi, characterized by low fertilizer intensity but pressured by adjacent high-intensity regions, could benefit from adopting cross-regional governance models inspired by the EU’s transboundary river basin management. Establishing a Yangtze River Middle Reaches Green Agriculture Alliance, supported by cross-regional technology diffusion funds and ecological compensation transfers, would facilitate the flow of green production factors across administrative boundaries [30, 31]. At the spatial planning level, Germany’s Raumordnungsplan (spatial structure planning) provides a reference for integrating fertilizer intensity spatial differentiation into national land-use strategies [32]. This would involve delineating fertilizer control zones and ecological agriculture priority areas, coupled with differentiated arable land use regulations.
Third, the development of intelligent monitoring and service systems is vital for enhancing dynamic policy responsiveness. By integrating satellite remote sensing, ground-based sensors, and farmer survey data, a digital decision-support system akin to the USDA’s NRCS Nutrient Management Plan could be established [33], featuring provincial-scale fertilizer risk warning modules. On the technology dissemination front, India’s Agri-UDAAN model offers a blueprint for nurturing digital agricultural service providers targeting smallholders, delivering personalized fertilization solutions via mobile applications, and implementing blockchain-based traceability systems for green inputs [34, 35]. This would effectively link fertilizer reduction outcomes with premium pricing mechanisms for agricultural products.
Furthermore, innovative mechanisms for realizing ecological value should be introduced to stimulate market participation. Drawing on the EU’s Eco-schemes under the Common Agricultural Policy (CAP), dedicated green fertilization incentive funds could be allocated within Rural Revitalization programs, offering tax credits to new agricultural entities achieving annual fertilizer intensity reduction targets [36]. Additionally, Canada’s Clean Technology Fund provides a model for establishing a green technology venture fund to support R&D and commercialization of advanced inputs such as controlled-release fertilizers and microbial inoculants [37]. In the context of carbon market development, integrating fertilizer reduction-derived carbon sequestration benefits into China’s CCER trading system would allow facility agriculture operators to generate tradable carbon credits through decreased fertilizer intensity.
Finally, enhancing institutional safeguards is crucial to ensuring policy continuity and stability. Legislative efforts, embedding fertilizer intensity control targets within the implementation guidelines of China’s Rural Revitalization Promotion Law, thereby clarifying statutory responsibilities for non-point source pollution control at all government levels. In terms of regulatory frameworks, a comprehensive monitoring system similar to Japan’s eco-friendly agriculture direct payment scheme should be established, featuring integrated management of fertilizer sales and purchases, along with county-level total fertilizer input controls. Concurrently, capacity-building initiatives should focus on developing a professional cohort of "green agronomists" to ensure localized adaptation and continuous iteration of technical solutions.
Through the synergistic application of multidimensional policy tools, China can consolidate the achievements of fertilizer reduction under the Rural Revitalization Strategy while addressing governance bottlenecks arising from regional heterogeneity. This approach will contribute to shaping a uniquely Chinese pathway for agricultural green transition. It necessitates the establishment of cross-sectoral coordination mechanisms, integrating resources from agriculture, environmental protection, and science and technology sectors, while fostering international collaboration to align with global green development agendas. In doing so, China can offer valuable insights and solutions for optimizing fertilizer application intensity within sustainable agricultural frameworks worldwide.
Conclusions
This study, through the construction of a multi-scale spatiotemporal analytical framework, systematically reveals the dynamic evolution and driving mechanisms of fertilizer application intensity in China’s vegetable production from 2011 to 2023. The findings demonstrate that the implementation of the Rural Revitalization Strategy has significantly restructured the spatial trajectory of China’s agricultural green transition. Fertilizer application intensity exhibited a clear trend of reduction and convergence, with regional disparities progressively narrowing and spatial clustering patterns evolving from polarization towards coordination.
Kernel density estimation results indicate that, following policy implementation, the national distribution peak of fertilizer intensity shifted leftward with a contraction of the tail, and the proportion of high-intensity samples decreased by 26.8%. This confirms the systematic correction of extensive fertilization practices driven by green agricultural policies. The decomposition of the Theil index further reveals that the contribution of the western region to overall disparities declined from 54.3% prior to policy implementation to 38.7% in 2023, highlighting the effectiveness of technology diffusion and institutional coordination in mitigating spatial imbalances.
Spatial analysis shows a decrease in Moran’s I index from 0.2826 in 2011 to 0.1937 in 2023, while the narrowing of High-High clusters in LISA maps and the northwestward migration of the gravity center collectively validate the transition of fertilization behavior from geographic inertia to a multidimensional interaction driven by policy, technology, and spatial dynamics.
At the theoretical level, this study expands the paradigm of spatiotemporal analysis in agricultural environmental policy assessment. By integrating kernel density estimation, Theil index decomposition, and standard deviation ellipse methods, a comprehensive analytical framework of intensity evolution—disparity decomposition—spatial restructuring is established, offering methodological innovations for understanding the nonlinear processes of agricultural green transitions.
Empirically, the study uncovers the dynamic coupling mechanism between policy intervention and spatial response. The Rural Revitalization Strategy, through tools such as technological subsidies, ecological compensation, and spatial planning, has effectively broken the geographic lock-in effect of traditional fertilization patterns. However, persistent institutional lag in Low-High outlier regions underscores the necessity of cross-regional coordinated governance.
In comparison with international experiences, China’s agricultural green transition exhibits a distinctive pathway characterized by strong policy-driven momentum, rapid spatial restructuring, and challenges in regional adaptation. This contrasts sharply with the market-driven, gradual adjustment models prevalent in Western countries, providing empirical insights for developing nations seeking to balance food security and environmental sustainability.
Future research should further explore the transmission mechanisms between micro-level farmer behavior and macro-level policy effects, particularly focusing on threshold effects and spatial heterogeneity in technology adoption under fragmented landholding systems. Additionally, due to limitations in accessing crop-specific fertilizer input data, future studies could enhance spatiotemporal resolution by integrating multi-source remote sensing data with household surveys.
The conclusions of this study offer a scientific basis for optimizing agricultural non-point source pollution control policies and establishing differentiated green technology promotion systems. Moreover, it contributes theoretical perspectives and practical insights rooted in the Chinese context to the global agenda of sustainable agricultural development.

