

Introduction
The 2030 Agenda for Sustainable Development emphasized building resource-efficient cities as it supported and nurtured sustainable urban development [1]. However, the rapid development of cities has attracted more people [2], so fewer urban land resources carry more urban elements [3, 4], and human socio-economic activities are increasingly concentrated in a narrow space, leading to a great threat to the urban environment and sustainable development [5, 6]. Nowadays, the urbanization pattern has created a huge demand for land resources and caused serious problems such as waste of land resources [7], environmental pollution [8], mixing of multiple land uses [9], and urban sprawl [10], especially in recent years. In turn, these problems seriously constrain cities’ normal socio-economic activities and sustainable development [11]. In this context, people have gradually realized that intensive use of land resources and the construction of compact cities are necessary to achieve sustainable urban development.
The theoretical idea of intensive land use first originated from the study of the output efficiency of agricultural land by scholars such as David Ricardo. It was mainly summarized as obtaining higher efficiency through increasing capital and labor inputs, but excessive inputs would lead to unsustainable increases or even declines in land output [12]. In 1976, the Food and Agriculture Organization of the United Nations (FAO) issued the Outline of Land Evaluation, which researched land classification from the appropriateness perspective and promoted the construction of a worldwide land evaluation system. With the deepening of the research on intensive land use, the research object has gradually shifted from agricultural land to urban land. Currently, many scholars believe that intensive land use is an important goal of high-quality urban development, and its connotation includes the economic, social, and ecologically sustainable benefits of land output, reflecting the level of development and utilization of urban land resources [13].
The Urban Agglomeration on the North Slope of Tianshan Mountain (UANSTM) is a strip of oasis in the northern foothills of the Tianshan Mountains in Xinjiang, China. With abundant energy resources and a favorable geographical location, it is one of the 19 urban agglomerations to be promoted during the 13th Five-Year Plan period and the core area of the Silk Road Economic Belt in China. Under these circumstances, UANSTM has become the most urbanized, densely populated area with the highest concentration of socio-economic activities in Xinjiang [14]. However, the twin pressures of environmental resource constraints and urbanization have persisted over the years. On the one hand, it is located in an arid zone with a lack of water resources [15]. Constrained by limited water resources, the UANSTM has large areas of bare land, leading to fragmentation of land for construction and agriculture, which seriously threatens the development of oasis cities [16]. On the other hand, the rapid development of urbanization has made the overall quality of the UANSTM low. Rough land resource development has led to multiple problems, such as the occupation of arable land, land environment pollution, and the reduction of land production capacity.
Currently, in terms of research scales, the focus was on rural areas [17], counties [18], cities [19], urban agglomerations [20], and regions [21], but there were fewer studies on micro scales and macro comparisons between cities, targeting communities. In terms of research perspectives, various scholars have explored the field of intensive land use from various perspectives, such as urbanization [22], soil erosion [13, 23], and urban tourism development [24]. However, the dimensions of the ILU are relatively broad. Few studies have dealt with the driving force, degree of obstacles, and internal mechanism of intensive land use, while it was limited for us to interpret human-land relations in the context of urbanization. Therefore, enhancing the intensive use of urban land resources in the context of new urbanization remains an issue of concern, especially in arid zones. This will be conducive to optimizing land spatial allocation, alleviating urban land conflicts, and promoting sustainable urban economy, society, and ecology development.
Therefore, we have combed the existing articles on intensive land use (ILU) to understand its origin and research methods. On this basis, the comprehensive evaluation index system of intensive land use adapted to UANSTM was constructed from four subsystems. A comprehensive evaluation of intensive land use is made using the entropy weight method. According to the comprehensive evaluation results, the temporal and spatial distribution of UANSTM is analyzed in detail. Next, we use the Theil index to explain the regional differences in detail. By combining the existing research articles, we can see a theoretical correlation between the four subsystems of ILU. To explain their data correlation in detail, we use a structural equation model to analyze the subsystem’s measurement and structural models. In a word, the objectives of our study included: (1) revealing the spatial and temporal change characteristics of LIU; (2) analyzing the group differences in the ILU; (3) identifying the obstacle factors that constrain the enhancement of the ILU in the oasis cities; and (4) discussing the role relationships among the four subsystems and clarifying their connotative mechanisms. We can provide a useful reference for optimizing land space allocation, alleviating urban land conflicts, and promoting sustainable urban economic-social-ecological development.
Materials and Methods
Study Area
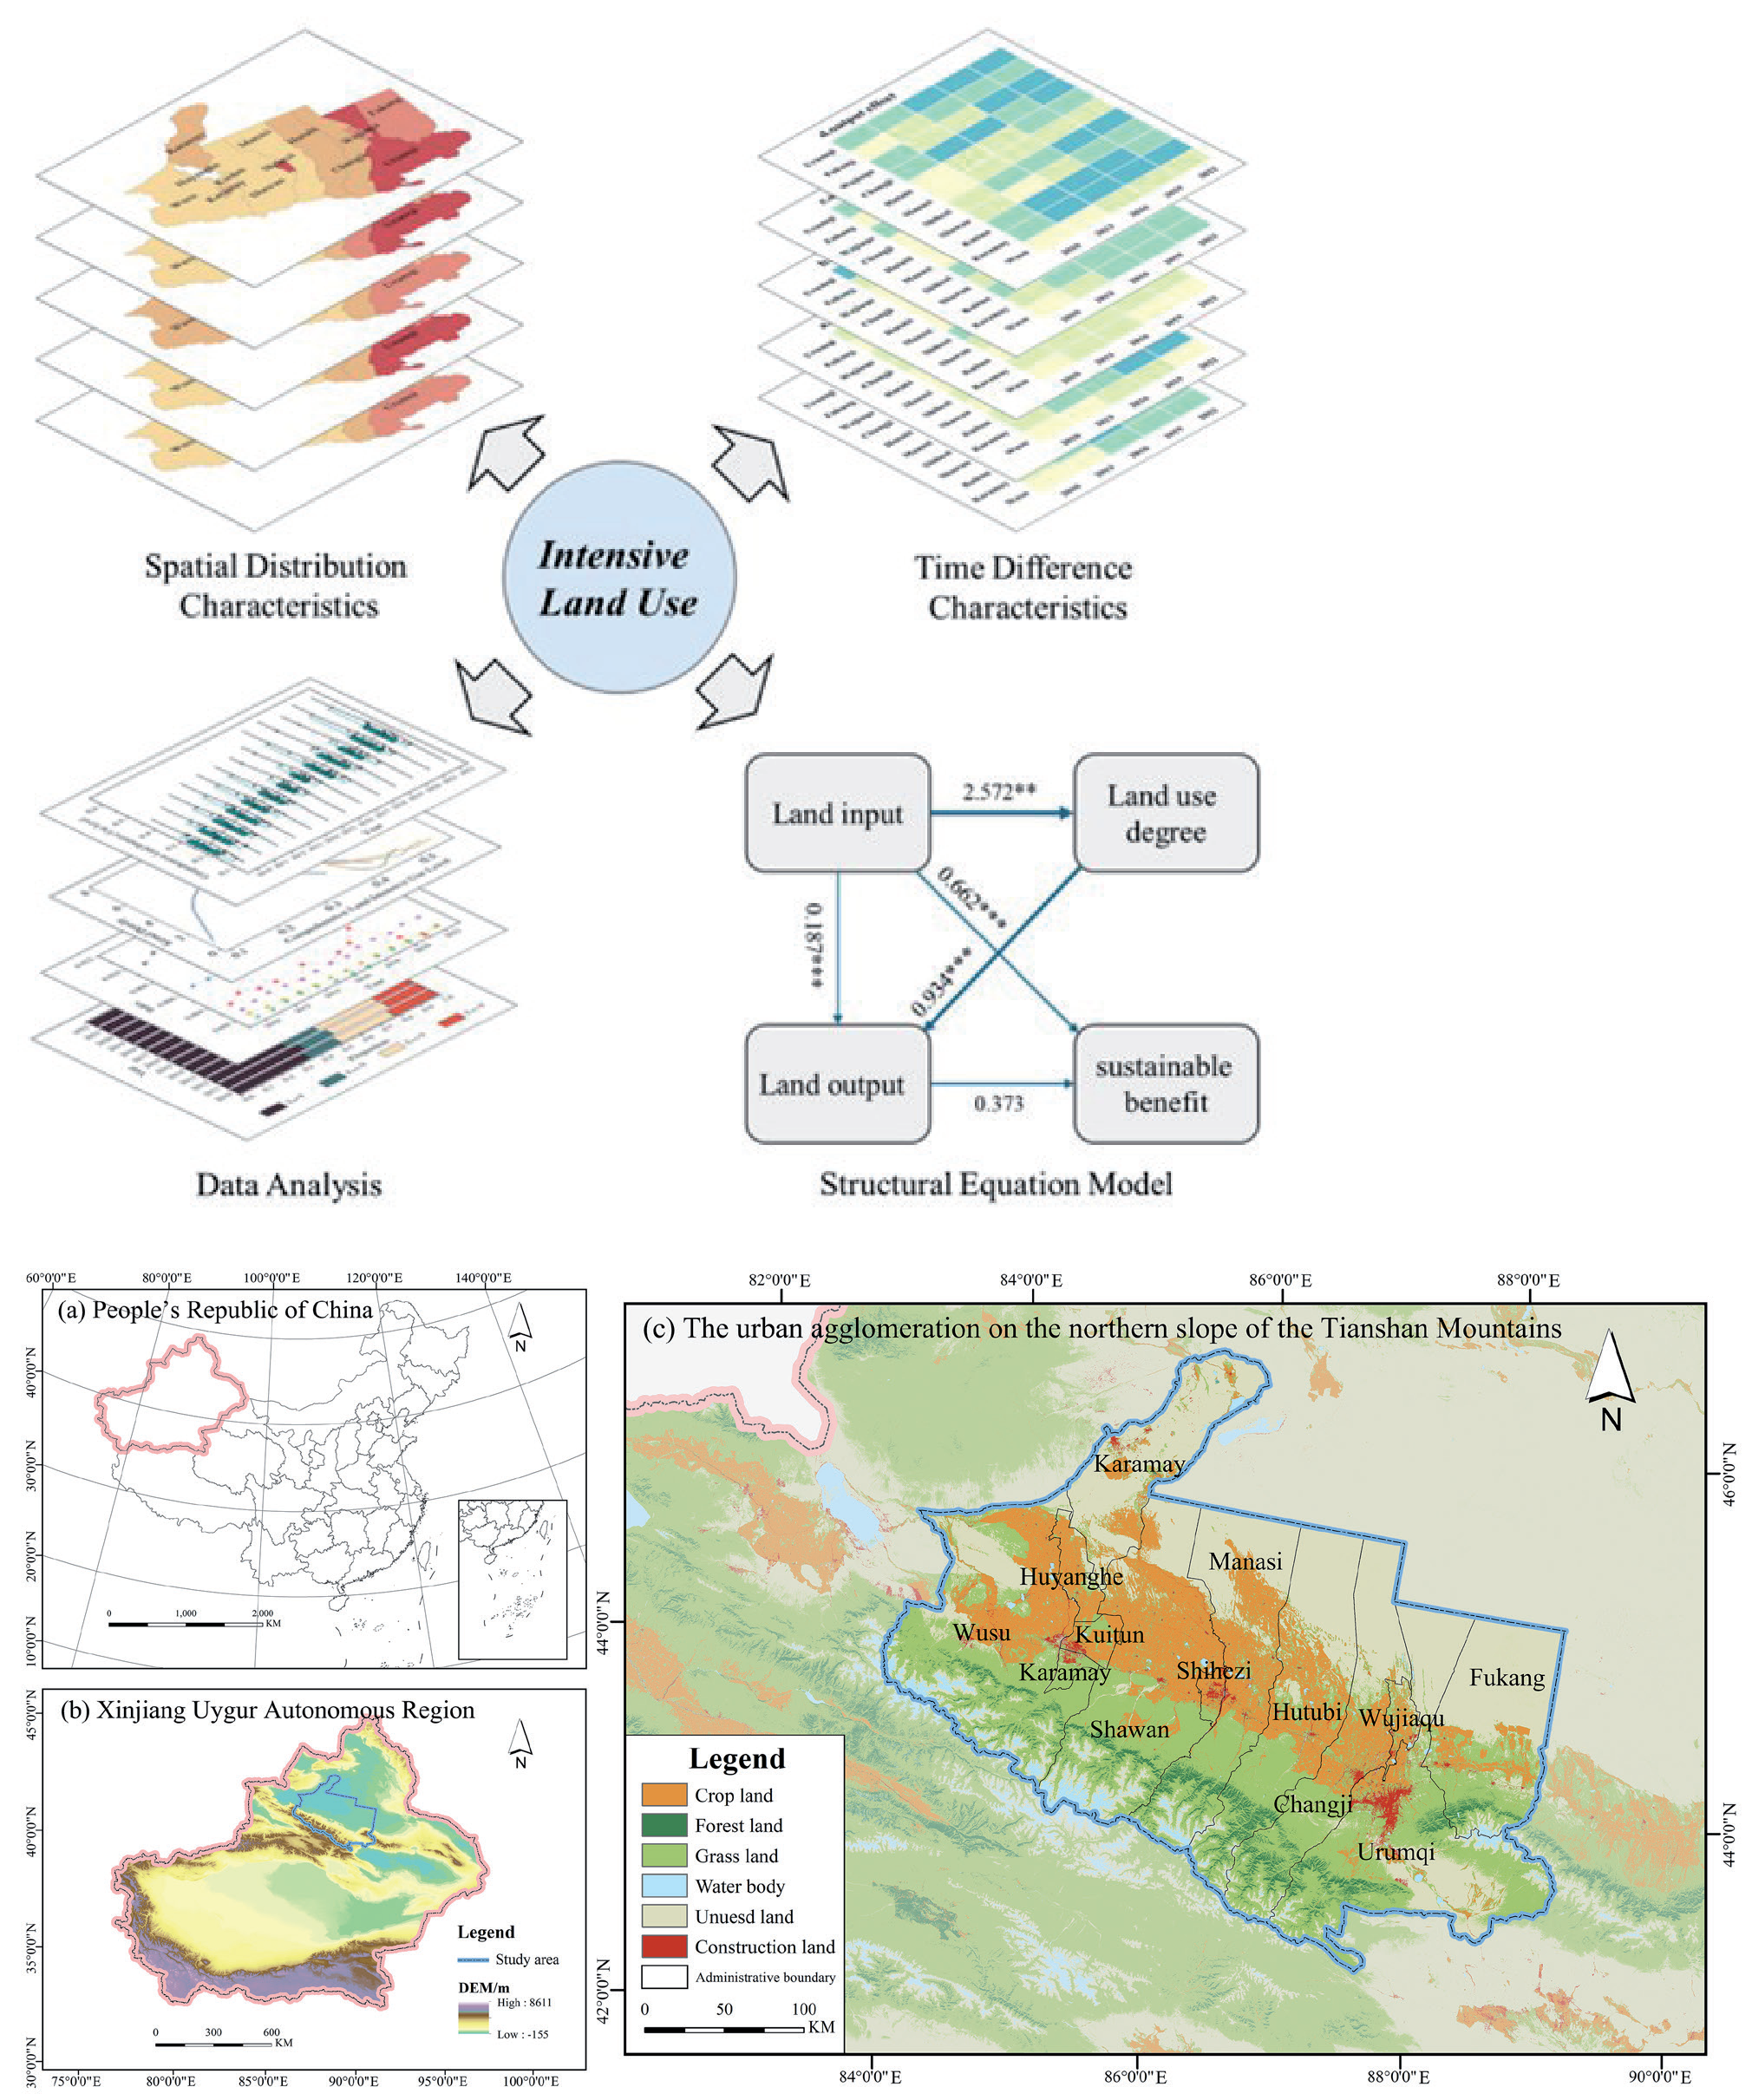
The UANSTM is located in Xinjiang, China, in the middle part of the northern slope of the Tianshan Mountain and the southern edge of the Junggar Basin (42°45′–45°59′ N,84°33′–88°54′ E). The total area of the study area is 95,400 km2, accounting for 5.8% of the total area of Xinjiang. The region gathers 6.53 million people, accounting for 25.24% of Xinjiang’s total population and 48.10% of Xinjiang’s total GDP, and includes the counties and cities of Urumqi, Fukang, Wujiaqu, Changji, Hutubi, Manasi, Shihezi, Shawan, Kuitun, Keramay, Wusu, and Huyanghe (Fig. 1). With the implementation of the Great Western Development Strategy in China, UANSTM has become an important hub of the Silk Road Economic Belt and one of the key urban agglomerations in China’s 13th Five-Year Plan. However, due to rapid development, UANSTM will face a series of real problems, including blind exploitation of land resources and ecological degradation, which may seriously constrain intensive land use and sustainable development. Given the short history of individual cities, we will not include them in the study, such as Huyanghe.
Data Source
The period of this study is from 2010 to 2022. The raw data for all indicators involved in intensive land use (ILU) are from the China Urban Statistical Yearbook, China County Statistical Yearbook, Xinjiang Statistical Yearbook, statistical yearbooks of Xinjiang Uygur Autonomous Region and Statistical Bulletins on National Economic and Social Development of relevant cities from 2010 to 2022. Administrative boundary data was obtained from the China National Center for Basic Geographic Information (https://www.ngcc.cn/ngcc/). Land use data was from the Resource and Environment Science and Data Center of the Chinese Academy of Sciences with a resolution of 30 meters (https://www. resdc.cn/). Topographic data was from Geospatial Data Cloud with a resolution of 30 meters (https://www. gscloud.cn/).
Constructing the Intensive Land Use Evaluation Index System
Intensive land use (ILU) is an important means to achieve sustainable urban land development, emphasizing eliminating the rough use of land resources and promoting high-quality urban development [25]. The ILU evaluation methods mainly include the indicator standard value and comprehensive evaluation methods [26, 27]. Previous studies have mostly used land-based economic output to measure the level of intensive land use. However, they may have neglected factors such as social welfare and urban ecology, resulting in less than comprehensive and systematic considerations. Academics have widely recognized the latter studies for considering the dynamics and multidimensionality of the ILU from the perspectives of land input level, land use degree, land output effect, and land sustainable benefit [28]. Therefore, we assessed the ILU level of the cities in the UANSTM based on the existing studies [29, 30]. The ILU is a giant and interacting system consisting of four subsystems: land input level, land use degree, land output effect, and land sustainable benefit (Table 1).
Evaluation Methods
As an objective assignment method, the entropy method can avoid the influence of artificial difference factors in the subjective assignment method. To eliminate the positive or negative influence of different dimensions and magnitudes on the indicators, we conducted the dimensionless processing of the indicators of LIU as follows:
Positive indicators:
Negative indicators:
where i is the study city, j is the indicator item, X'ij is the standardized value of the j-th indicator in the i-th city, Xij is the original data value of the j-th indicator in the i-th city, max (Xj) is the maximum value of the j-th indicator, and min (Xj) is the minimum value of the j-th indicator.
where pij is the share of the j-th indicator in the i-th city; m represents the number of counties and cities; k is a constant; and ej is the information entropy of the j-th indicator.
where gj is the information entropy redundancy of the j-th indicator; wj is the weight of the j-th indicator; and Ui is the composite score of the ILU.
The Theil index allows for the decomposition of a region to reveal the direction and magnitude of change in intra-group and inter-group variation, the importance of each in the total variation, and its impact. A Theil index close to 0 indicates a small degree of differentiation; a more significant value of the Theil index indicates more differentiation. The specific calculation steps are as follows:
Table 1.
Intensive land use level evaluation index system in the UANSTM.
where Tbe is the difference between regions, Twr is the difference within regions, Yij is the score of an indicator in evaluating the j-th unit of the i-th region, Yi is the sum of the scores of this indicator in the i-th region, and Y is the sum of the scores of this indicator in all counties and cities; ai is the proportion of the land area of the i-th region to the total study area, and aij is the proportion of the land area of the j-th unit in the i-th region to the i-th region.
The obstacle degree model clarifies the key factors affecting the development of the research object by calculating the obstacle degree of categorized indicators and single indicators. It is mainly analyzed through factor contribution, indicator deviation, and obstacle degree, and the specific calculation steps are as follows:
where Iij is the indicator deviation, X'ij is the standardized value of the indicator; Mij is the barrier degree of the j-th indicator in the i-th unit; Fij is the factor contribution, expressed in terms of the weight of the wj indicator; Nij is the barrier degree of the guideline layer.
The structural equation model comprises a measurement model and a structural model, which is a method to establish, estimate, and test causality and can analyze the relationship between variables based on the covariance matrix of variables. The measurement model reflects the relationship between observed variables and their corresponding latent variables, while the structural model reflects the relationship between exogenous latent variables and endogenous latent variables. Amos 28.0 was used to analyze the relationship between the measurement and structural models. This study regarded the four intensive land-use subsystems as the latent variables. We also take the measurement index of intensive land use as the observation variable of the model. Based on the model results, the causality of the relevant variables was continuously adjusted to find the optimal model and clarify the path of action and the effect of action between the four subsystems.
Results
Temporal Evolution of the ILU in the UANSTM
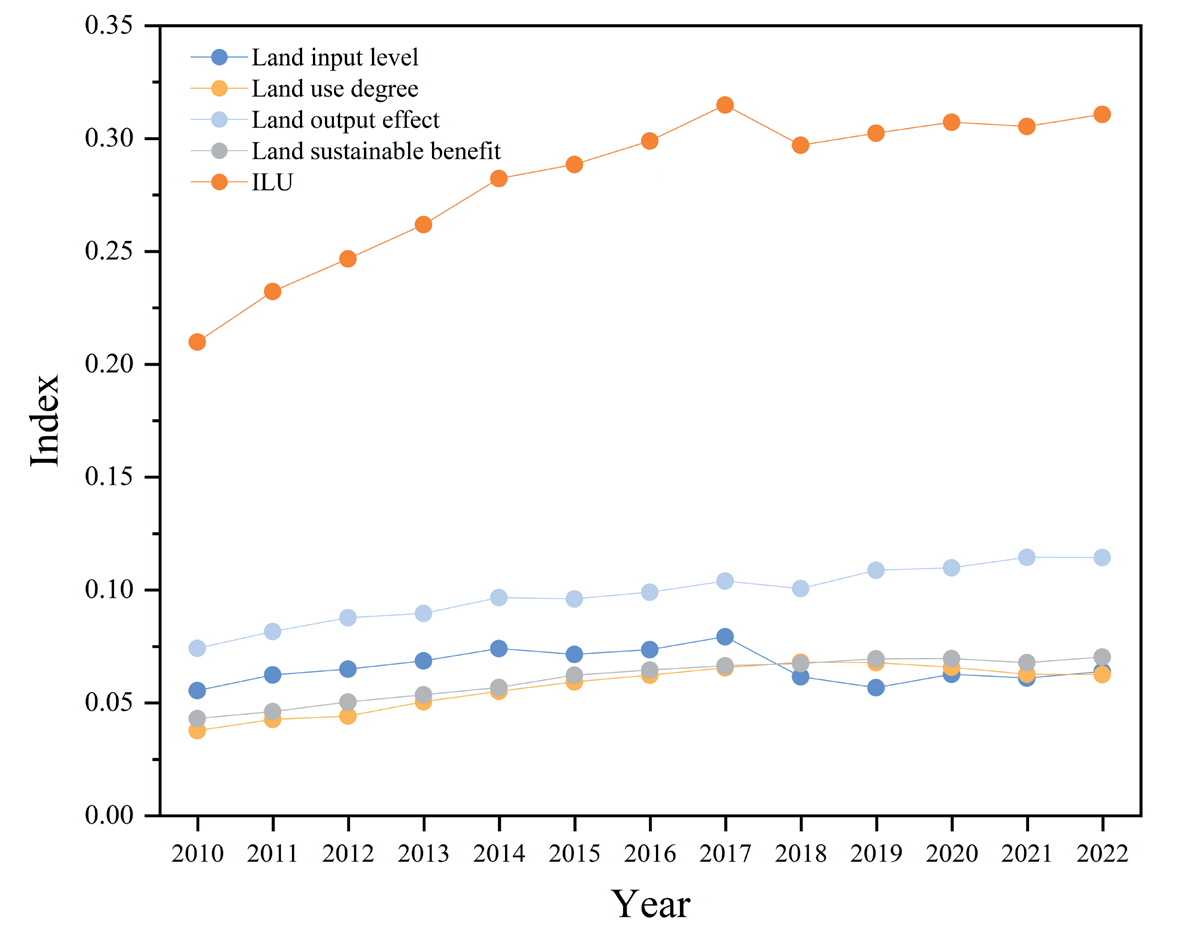
In the UANSTM, the average level of the ILU gradually increased from 0.2097 in 2010 to 0.3105 in 2022, with an average annual growth rate of 3.324% (Fig. 2). The subsystems of land use degree, land output effect, and land sustainable benefit maintained an increasing trend with an average annual growth rate of 4.329%, 3.683%, and 4.172%, respectively, with decreasing only in individual years. Land input level had declined sharply since 2018, which was mainly affected by financial deleveraging and the strengthening of local fiscal constraints and was also related to the significant decline in investment in infrastructure construction, which was dominated by local government investment, and investment in real estate development, which was dominated by social investment [31]. In particular, the land output effect and land input level were relatively high before 2017 and contributed significantly to the ILU. Impacted by declining land input levels, the ILU fell briefly in 2018 before rising slowly. In addition, the scores for land use degree and land sustainable benefit were relatively higher, and both have high average annual growth rates with great potential for future development.
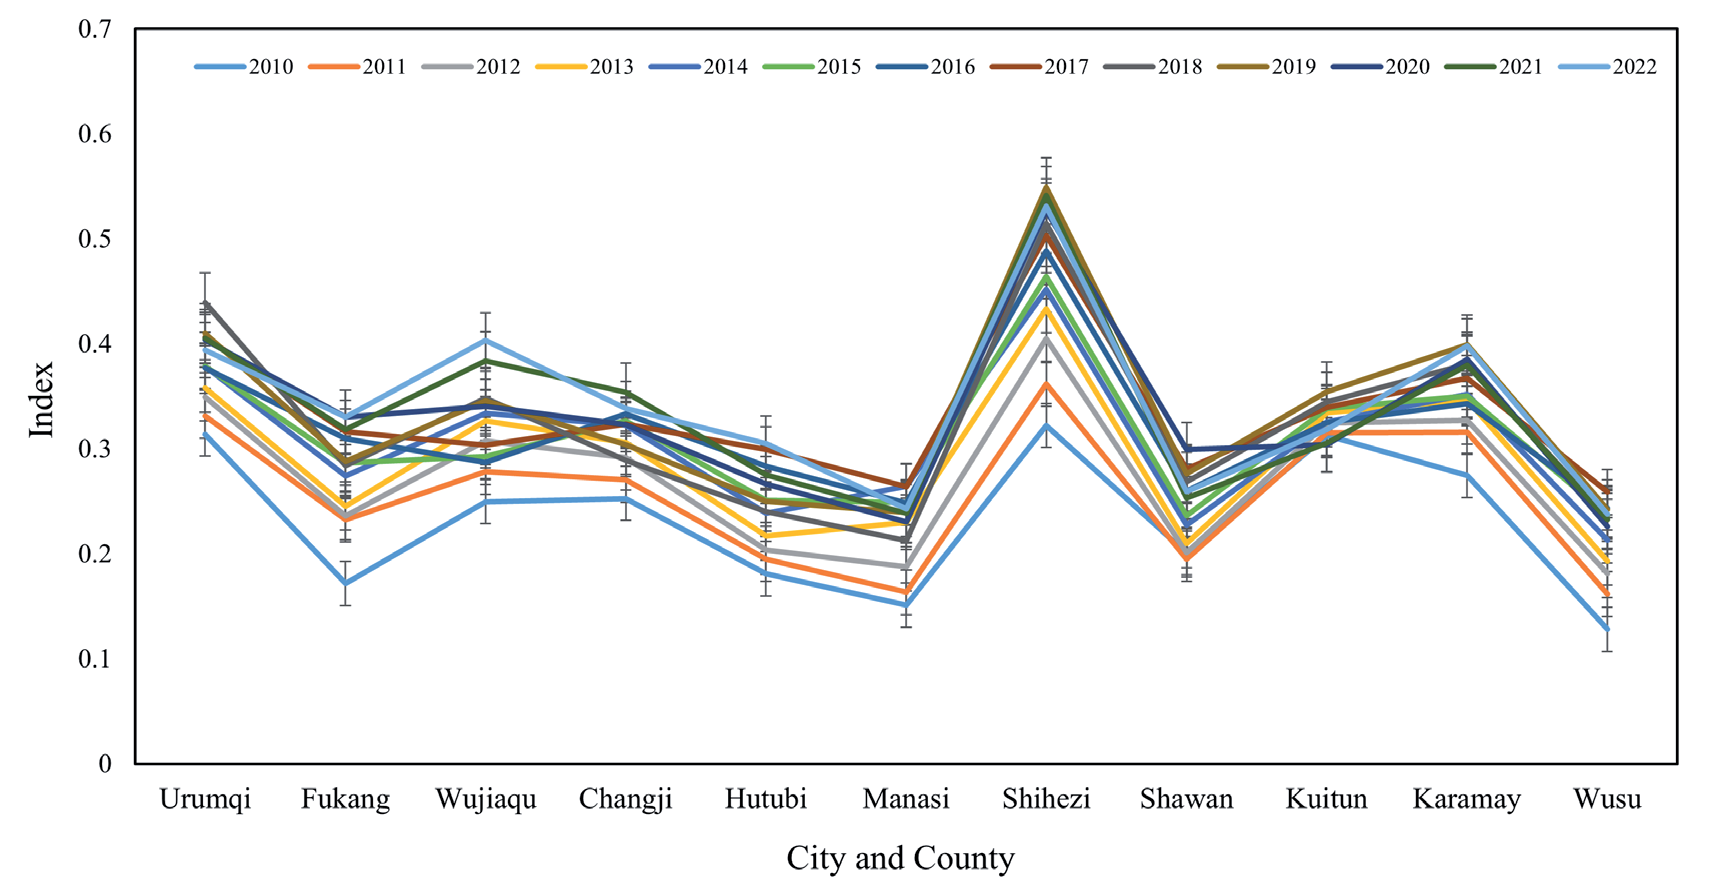
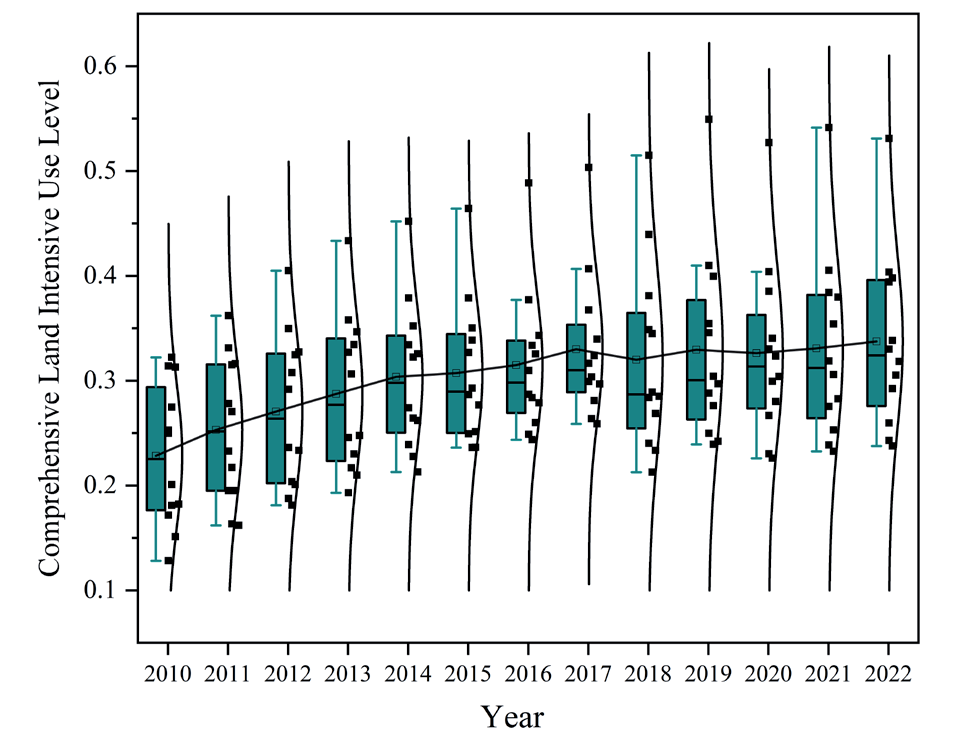
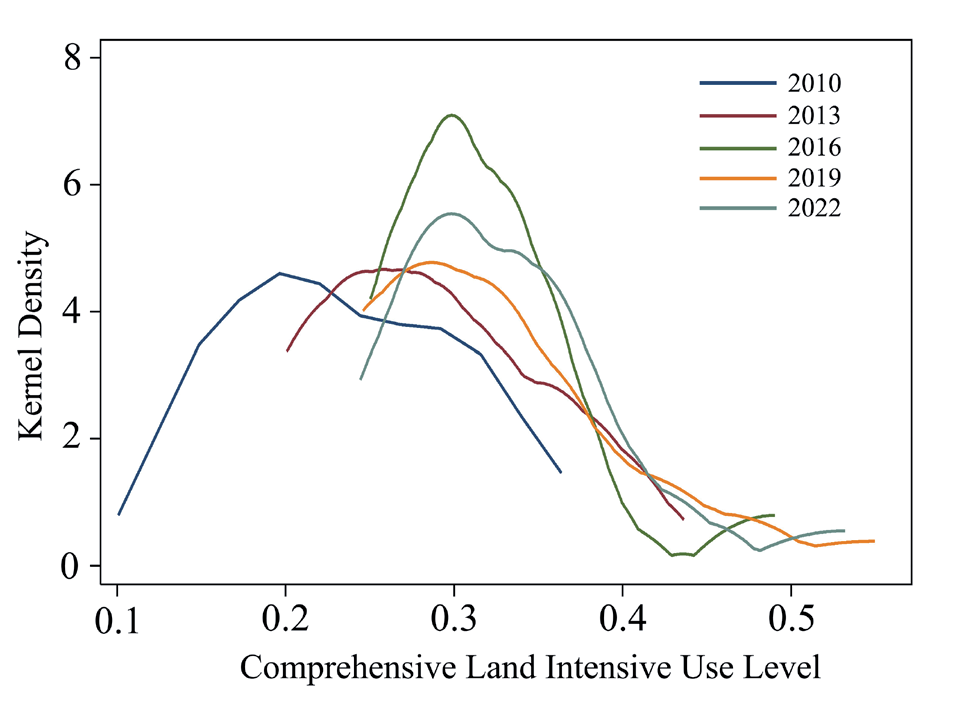
In each county and city, the ILU overall increased in fluctuation from 2010 through 2022 (Fig. 3). Among them, Urumqi, Shihezi, and Karamay, which had high ILU scores, were the core cities of the UANSTM. As can be seen from the boxplot (Fig. 4), the change in the mean of the ILU from 2010 to 2022 was roughly characterized by a U-shape, with the mean reaching a maximum value of 0.3416 in 2022 and only 0.2326 in 2010. Overall, the differences in ILU among counties and cities showed a continuous trend of expansion, while the maximum difference in the ILU reached 0.3099 in 2019. To more clearly characterize the time-series evolution of the ILU, we selected five years of data from 2010, 2013, 2016, 2019, and 2022 to draw the kernel density map (Fig. 5). From the trend of curve shifting, the kernel density curve gradually shifted to the right from 2010 to 2022, indicating that the level of ILU is increasing. From the change of the peak value of the curve, the peak value of the curve experienced rise-fall-rise, indicating that the denseness of the distribution of ILUs in counties and cities undergoes the process of aggregation-dispersion-aggregation. The trailing tail on the right side of the curve from 2010 to 2022 was essentially a lengthening feature, suggesting that the differences in ILU across counties and cities were widening and will continue to do so in the future.
Spatial Distribution Characteristics of the ILU in the UANSTM
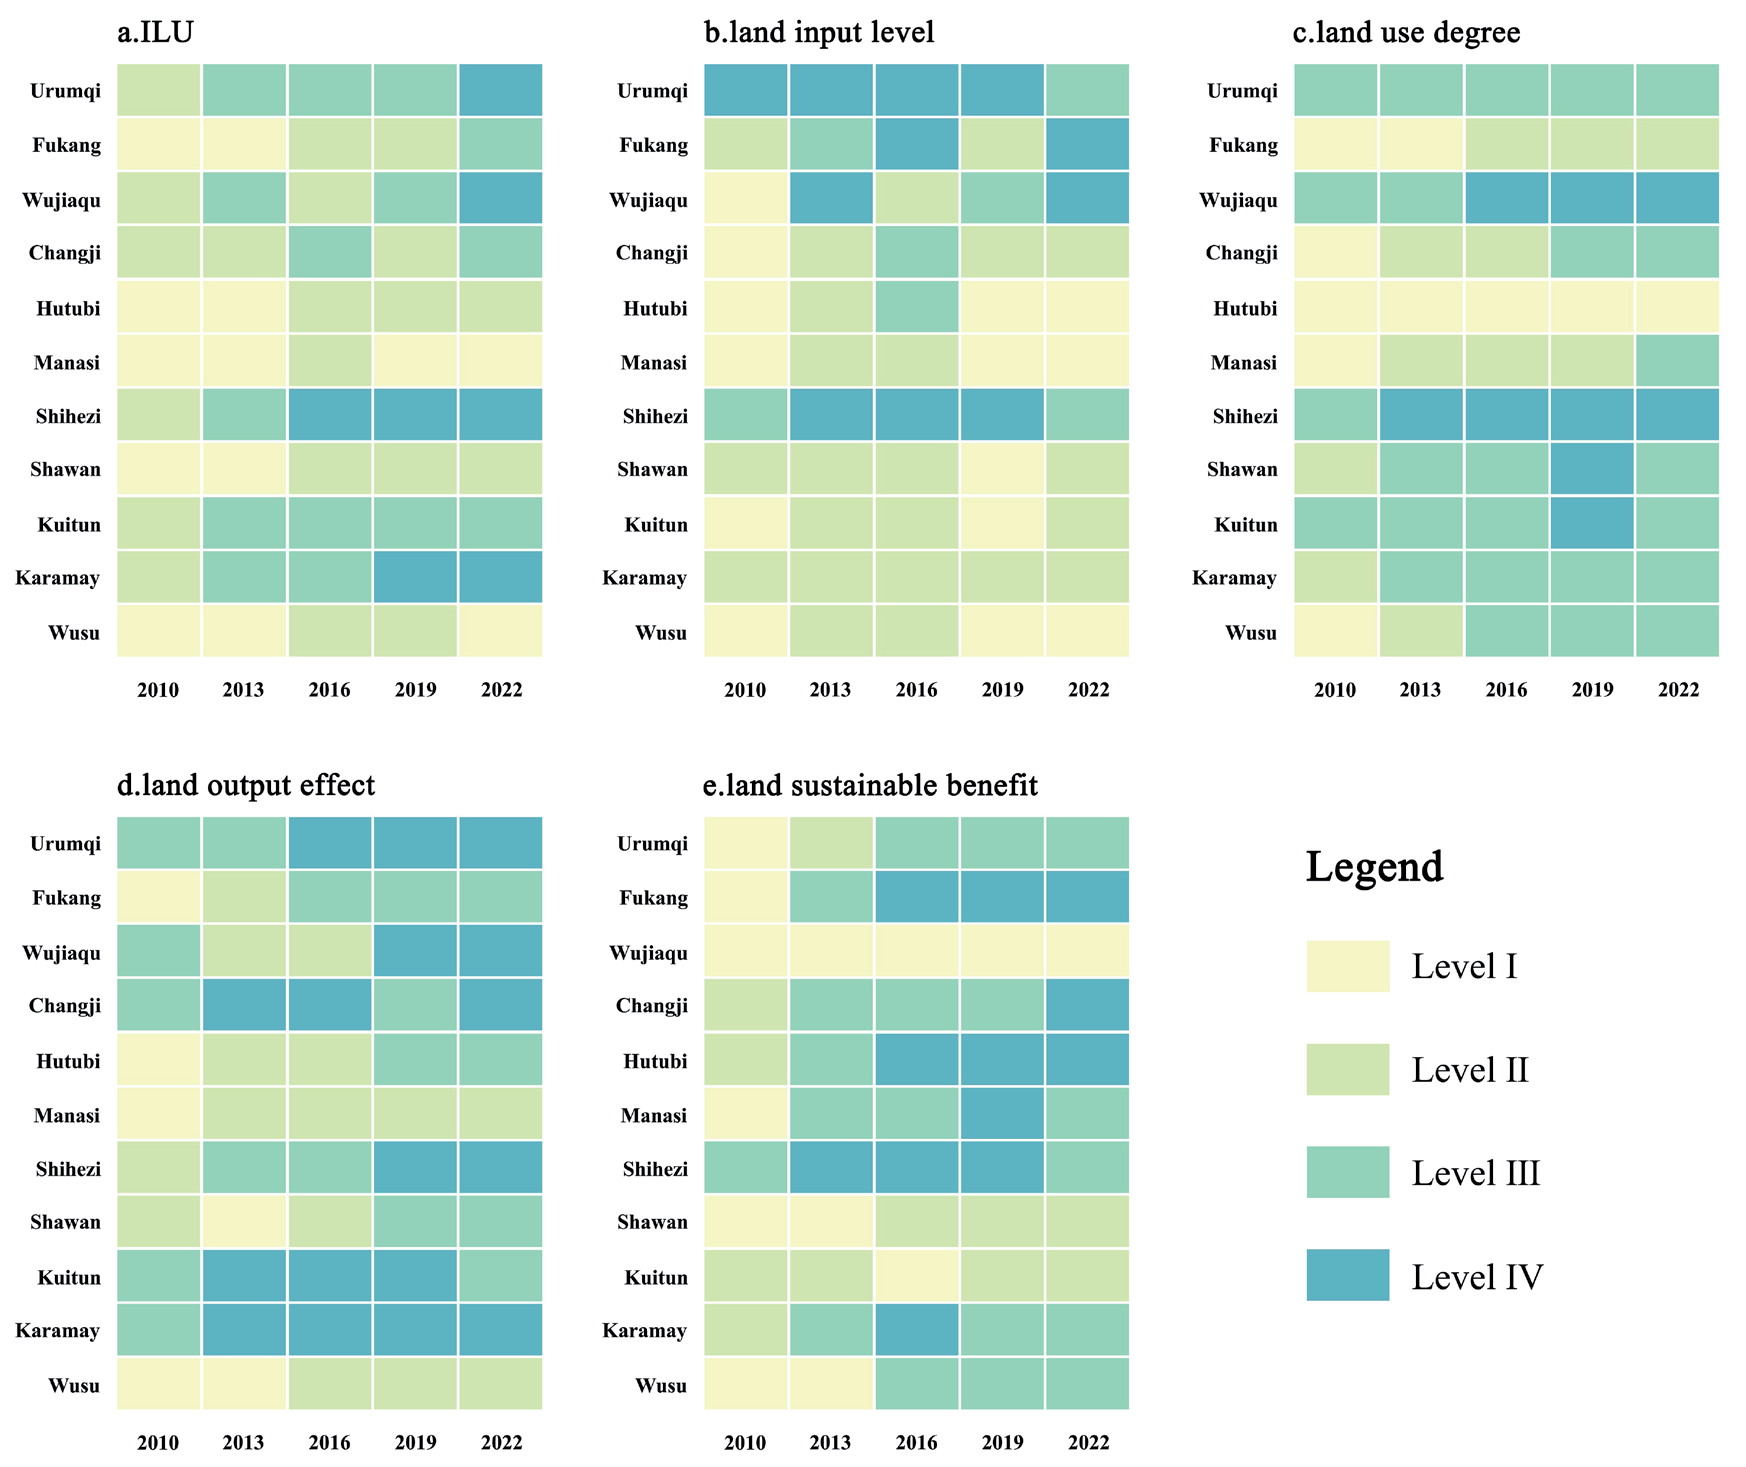
From 2010 to 2022, the ILU and subsystems were categorized into four levels: low to high (I low-level, II lower-level, III higher-level, and IV high-level). We conducted a spatial distribution pattern on the multi-year average of the five indexes for all cities and counties during the research period (Fig. 6). High-level (Shihezi) and higher-level cities (Urumqi, Wujiaqu, Kuitun, and Karamay) were dispersed in the center and ends of the study area. These are important cities of the UANSTM, accompanied by dense populations and frequent socio-economic activities. The lower-level cities (Changji, Fukang) were mainly located in the eastern part of the study area. The low-level counties and cities (Hutubi, Manasi, Shawan, Wusu) were scattered in the central and western parts of the study area. To analyze the evolution of subsystems in each city and county, we selected the data from 2010, 2013, 2016, 2019, and 2022 for study (Fig. 7). In 2010, no county or city was ranked among the high-level and higher level, while the proportion increased to 63.64% in 2022 (Fig. 7a)). The spatial distribution patterns of the four subsystems in these cities and counties were basically consistent with ILU, except for a few cities (Fig. 7 (b-e)). For example, Wujiaqu performed poorly in terms of sustainable benefits, while the good performance of Shawan and Wusu in this subsystem had a significant uplifting effect on the overall ILU. In 2010, the proportion of counties and municipalities with high and relatively high levels of the four subsystems was 18.18%, 36.36%, 45.45%, and 9.09%, respectively. Correspondingly, in 2022, this percentage becomes 36.36%, 81.82%, 81.82%, and 72.73%, indicating that most cities have made significant progress in all four subsystems.
Nowadays, Urumqi, Shihezi, and Karamay have become the important growth poles of the UANSTM in terms of socio-economic aspects, which significantly drive the development of neighboring cities [32, 33]. Therefore, we took these three cities as the core to divide the UANSTM into three regions and explore their role in influencing LIU, respectively. The first region included Urumqi, Fukang, Wujiaqu, Changji, and Hutubi and was called the Urumqi group. The second region included Manasi, Shihezi, and Shawan and was called the Shihezi group. The third region included Kuitun, Wusu, and Karamay and was called the Karamay group. We calculated the Theil index and the contribution of each group from 2010 to 2022. From Fig. 8, T declined overall, with an average annual growth rate of -1.85% and the following characteristics: (1) In the UANSTM, the ILU had the characteristics of non-equilibrium spatial distribution, and the differences between groups are obvious. (2) The change in T was not smooth and was characterized by significant phases. T gradually decreased from 2010 to 2014, fluctuated repeatedly from 2015 to 2019, and then showed a decreasing trend from 2020 to 2022. (3) In the long term, the relative difference in terms of the three intervals showed a decreasing trend, which indicated that the level of intensive land use was increasing in the UANSTM.
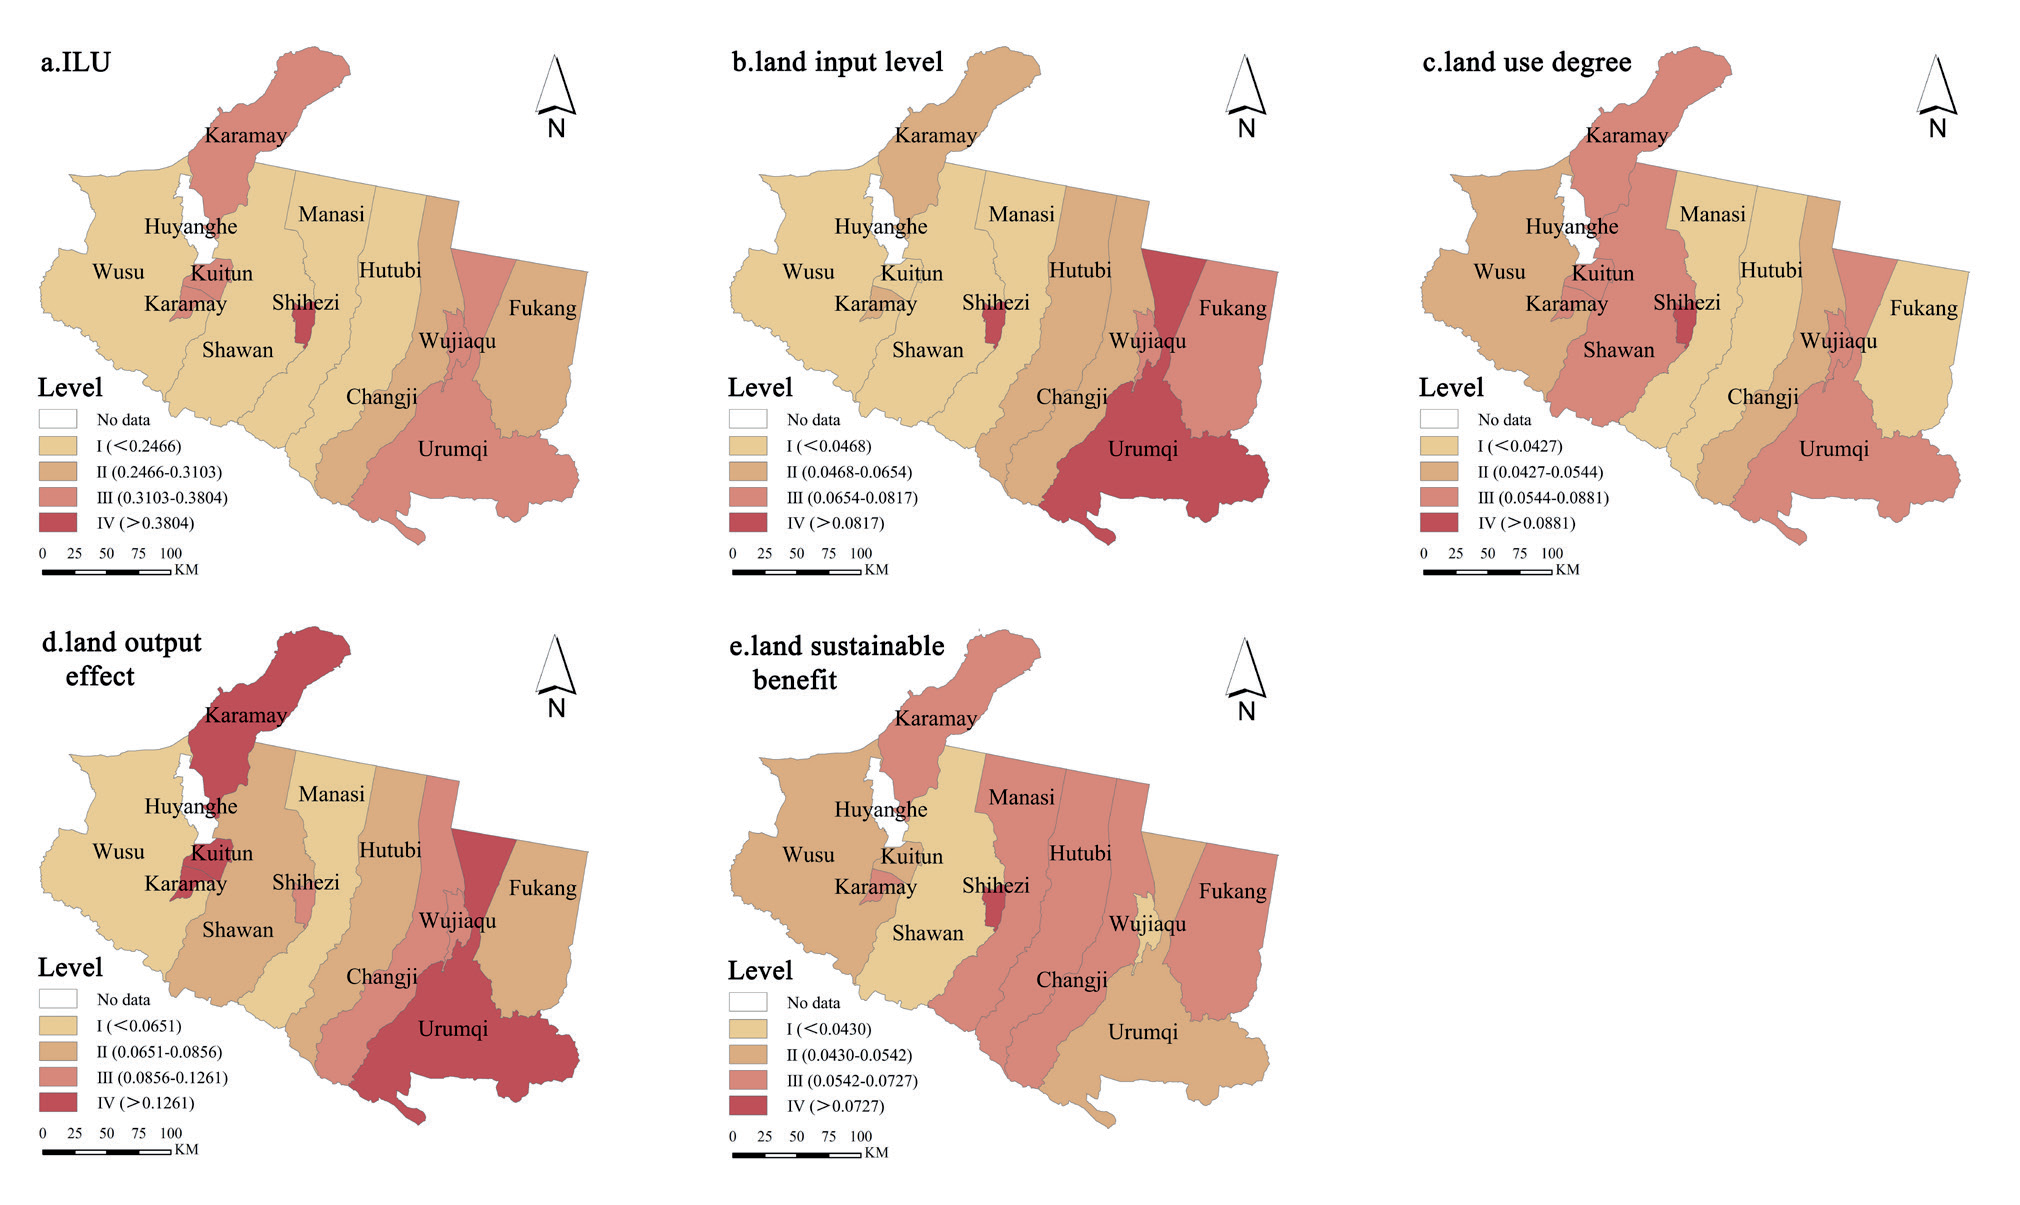
Fig. 7.
The level changes in ILU and four subsystems of cities and counties in the UANSTM from 2010 to 2022.
TBP, the difference in the between-group component, declined overall with an average annual growth rate of -6.28%, as did the characteristics of changes in T. From 2010 to 2019, TBP showed repeated fluctuations at higher levels. In 2020, TBP began to decline rapidly, fluctuating at a low level with the possibility of maintenance. The multi-year contribution of TBP to T ranged from 17.69% to 43.52%, showing a slow decline in fluctuation, with an average value of 33.36%, indicating that the differences in LIU among the three groups were decreasing. TWP, the difference in the within-group component, evolved more steadily than TBP, with an average annual growth rate of only -0.08%, and its contribution to T ranged from 56.48% to 82.31%, with a mean value of 66.64%, indicating that there was little variation in the three within-group variations. Obviously, TWP was greater than TBP in all years, and the average annual contribution of TWP to T was 1.99 times that of TBP, suggesting that the UANSTM within-groups component was the dominant force in T.
As can be seen from the TWP decomposition (Fig. 9), the mean values of the Urumqi group, Shihezi group, and Kelamayi group were 0.001449, 0.002807, and 0.001711, and the mean values of the contribution rate to T are 16.19%, 31.42%, and 19.03%, in that order. Among them, the within-group component of the Urumqi group (TWP1) showed constant fluctuation at a low level, with a relatively low contribution rate to T. This indicated that the level of intensive land use within the Urumqi group is balanced and that Urumqi had a significant driving effect. Secondly, the within-group component of Shihezi (TWP2) ranked the highest, with an annual average growth rate of 0.954%, which was much higher than the other two groups. Twp2, whose contribution to T ranged from 26.98% to 40.34% and remained largely high, is an important factor in T composition. The development of ILU in the Shihezi group was extremely unbalanced, which may continue to expand in the future. In addition, the within-group component of the Karamay group (TWP3) had been decreasing and changing very gently year by year, with an average annual growth rate of -2.327% and a contribution to T ranging from 15.36% to 21.60%, which had a relatively small impact on the overall variation of ILU in the three groups.
Analysis of the ILU Obstacle Degree
To further explore the influencing factors of ILU in the UANSTM, we used the obstacle degree model to measure and analyze the criterion layer and index layer obstacle degrees of ILU from 2010 to 2022.
From Table 2, the obstacle degree of the four indicators at the criterion layer varied considerably from 2010 to 2022. In general, the obstacle degrees of land use and land sustainable benefit basically remained unchanged, and the obstacle degree of the land input level showed an upward trend in fluctuation, while the obstacle degree of the land output effect was slowly decreasing. In terms of the obstacle degree value, land use degree was the largest in 2010, followed by land output effect, land input level, and land sustainable benefits. In 2022, the obstacle degree of the four indicators is the land use degree, land input level, land output effect, and land sustainable benefit in descending order. Obviously, enhancing intensive land use in the UANSTM must start with improving the land’s input level and focusing on land output and sustainable land benefits.
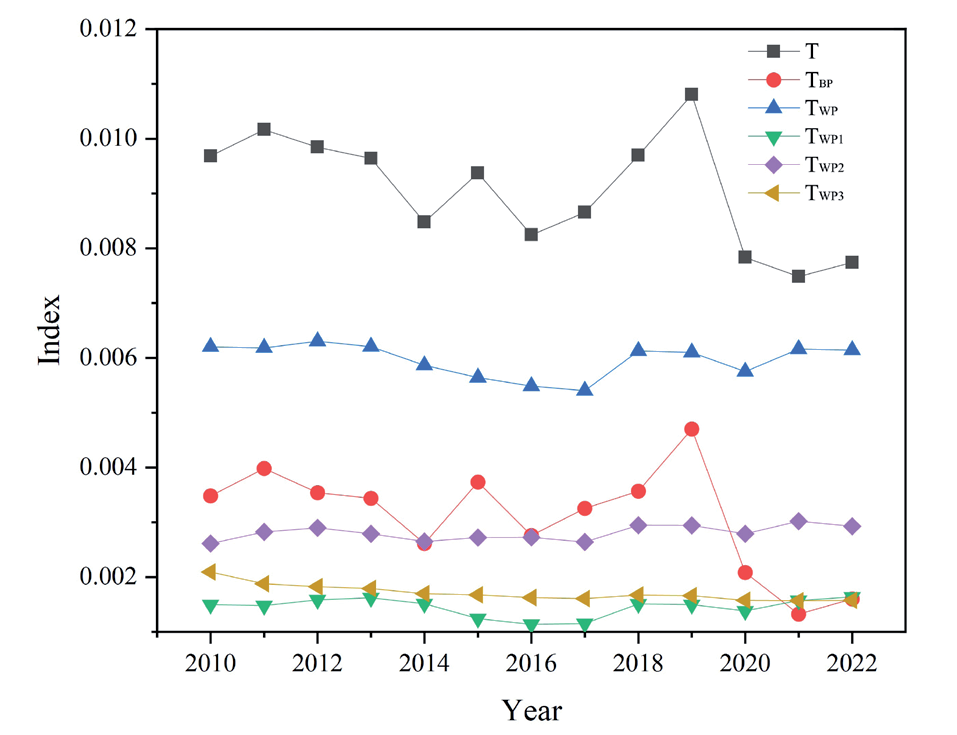
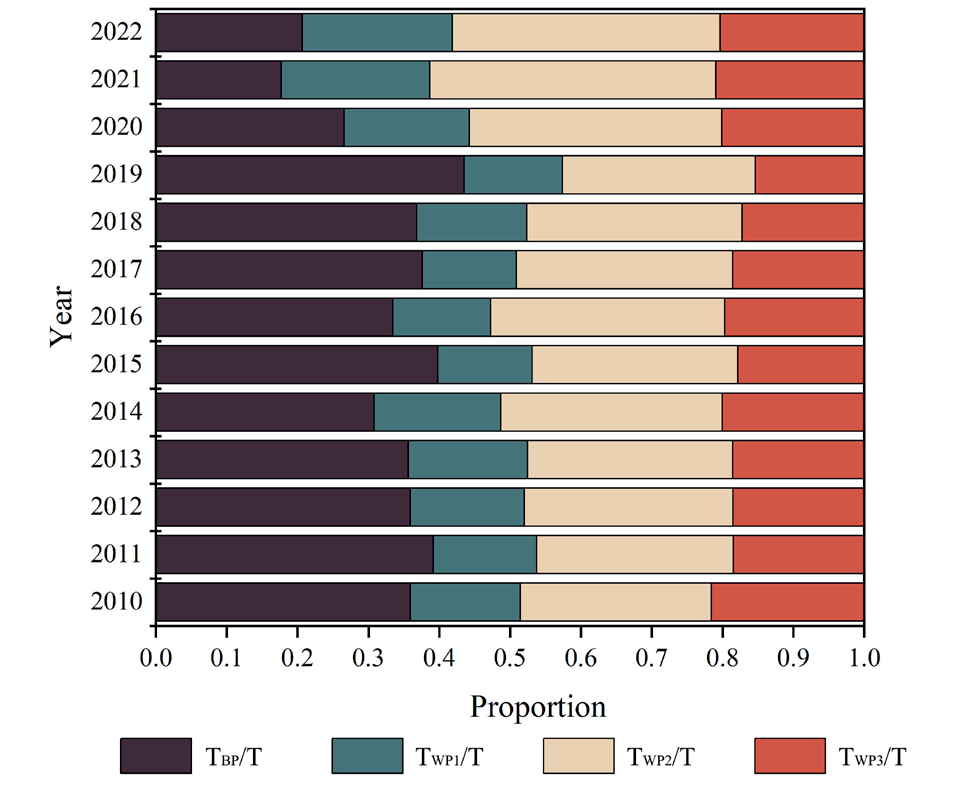
Table 2.
Obstacle degree in criterion layer.
From 2010 to 2022, land input level, land use degree, and land sustainable benefit increased at an average annual rate of 1.40%, 0.21%, and 0.24%, respectively, while land output effect decreased at an average annual rate of 1.85%. Obviously, in the long run, land use degree will be the primary factor affecting ILU. In the UANSTM, since water sources mainly influence urban development, it is difficult to improve the land use degree by expanding cities and cultivating land. Therefore, improving the breadth and depth of ILU will be the inevitable choice for the UANSTM development. The obstacle degree of the land input level showed a slowly rising trend and may continue to rise, mainly due to the weak foundation of the UANSTM and insufficient infrastructure, coupled with financial deleveraging and strengthening of local financial constraints and other factors.
We ranked the obstacle degree and obtained the ranking of the obstacle degree of the UANSTM from 2010 to 2022 (Table 3). The obstacle factors ranked in the top five with a high frequency of occurrence were the proportion of construction land (X6), per capita cultivated land area (X5), labor input per unit of cultivated area (X2), and the per capita green space area (X16). Among them, the proportion of construction land (X6) was always in the first place in the ranking of obstacle factors, indicating that most counties and cities generally had small building sites that needed to be developed in depth. The per capita cultivated land area (X5) was always in second place, ranging from 0.0174 to 1.33 hm2, which is obviously a huge difference. With abundant land resources in the UANSTM, but due to the arid and low rainfall climatic characteristics, agricultural arable land was more dependent on water resources, coupled with the fact that urban expansion and industrial development will take up a large amount of land, which was likely to further reduce the area of arable land. Labor input per unit of cultivated area (X2), reflecting the level of land cultivation, also appeared more frequently. However, with the agglomeration effect of cities on the population, the number of agricultural laborers will likely continue to decline, which is not conducive to the high quality of cultivated land. In addition, the per capita public green space area (X16) was a major obstacle affecting the UANSTM. Combined with the Evaluation Standard for Urban Landscaping and Greening (GB/T50563-2010) issued by China in 2010, only three counties and cities had per capita public green space areas reaching the Class I standard in 2010. They were also much lower than the average level of 11.18 m2 per person in China in the same year. However, X16 did not appear among the top five factors in 2022, which indicated that the land ecological benefit was promoted significantly by X16. It is worth mentioning that the forest coverage rate (X17) often appeared in the top five factors. In the arid zone, forest cover was already low, and urban expansion and tourism development increased disturbances in virgin forests, resulting in the protection and development of forest resources that are not optimistic for the future.
We sorted the obstacle factors by city and county for 2010 and 2022 and found that the main obstacle factors in each place are mainly focused on land use degree, land input level, and land sustainability benefits (Table 4). Apparently, the proportion of construction land (X6) and the per capita cultivated land area (X5) ranked among the top two obstacle factors for most counties and cities, which was consistent with the overall situation of the UANSTM. From 2010 to 2022, the proportion of construction land (X6) increased in all counties and cities, while the per capita cultivated land area (X5) decreased year by year only in Urumqi and Wujiaqu. This suggested that the rapid development of Urumqi was likely to have taken away some arable land, resulting in X5 declining year on year. Wujiaqu, considered a satellite city of Urumqi, has a development trend that is largely in line with that of Urumqi. In addition, in 2022, the ranking of the obstacle degree of land sustainable benefit indicators in some cities has increased, indicating that the negative impacts of the rapid development of the UANSTM on the ecological environment have gradually appeared. In particular, the proportion of construction land in 2010 (X6) was the first obstacle factor in Shihezi but no longer the main obstacle factor in 2022, while LIU had been increasing during this period, indicating that improving X6 played an important role in promoting ILU. In 2012, the concept of building an ecological civilization was put forward in China. Subsequently, a series of measures, such as optimal allocation of resources, green development of the industrial economy, and ecological protection, were proposed in Xinjiang, where the fragile ecological environment has been improved. However, at present, there is still much room for improvement in the construction of ecological civilization in counties and cities.
Table 3.
The rank of obstacle factors in the UANSTM.
Table 4.
The rank of obstacle factors in each city and county for 2010 and 2022.
Structural Equation Model Analysis of the Four Subsystem Layers
The structural equation model is a statistical method of validation analysis using a covariance structure, which can analyze the measurement model’s consistency and the structural model’s causal relationship. We regarded the four subsystem layers of land-intensive utilization evaluation as potential variables of the model and clarified the action paths and action effects among the potential variables according to the model path coefficients. First, land, as a resource and asset, is put into social production, whose progress is mainly manifested in increased land use. With an increase in land use, the city’s construction has been enhanced in many aspects, such as the population agglomeration effect, the scale effect of the economy, and the dividend effect of the society, which promoted the sustainable development of the land. Therefore, we put forward the following theoretical hypotheses: H1: Land input level has a positive and significant effect on the land use degree; H2: Land input level has a positive and significant effect on the land output effect; H3: Land input level has a positive and significant effect on the benefits of sustainable development; H4: Utilization degree has a positive and significant effect on the output effect; H5: Output effect has a positive and significant effect on the benefits of sustainable development.
We selected the panel data of the UANSTM from 2010 to 2022, and each observation possesses 143 sample data, which can ensure the stability of the results of the evaluation model. We imported the standardized panel data into Amos 27.0 and used the maximum likelihood estimation method for calculation. The results showed that the ratio of the chi-square value to the degrees of freedom(χ2/df) was less than 3, the incremental fit index (IFI), the Tucker-Lewis index, and the comparative fit index (CFI) were all greater than 0.8, and the parsimony goodness-of-fit index (PGFI) was greater than 0.5, which indicated that the overall fit of the model met the criteria. Based on the SEM results (Table 5), H1 was significant at the 0.01 level, and H2, H3, and H4 were significant at the 0.001 level; hence, they hold. H5 did not reach a significant level, and it did not hold. Therefore, we consider the level of land inputs as the fundamental driving force of the whole system. Increasing the land input level had a very strong positive impact on the extent of land use, the effectiveness of land outputs, and the benefits of sustainable land development. Therefore, we considered the land input level as the fundamental driving force of the whole system. It is worth noting that a possible reason why hypothesis H5 did not hold is that the land output effects, including population agglomeration, economic growth, and social dividend enhancement, were a greater threat to the ecological environment and land sustainability.
Table 5.
Results of the action path and the effect of the four subsystems in the UANSTM.
Discussion
Comparative Analysis with Related Studies
In our study, ILU and the subsystems, including the land use degree, land output effect, and land sustainable benefit, except for the land input level, showed an increasing trend in the UANSTM. Under the background of the Western Development Strategy and the “Belt and Road” Initiative, UANSTM has attracted various funds, talents, and technologies. Meanwhile, in the UANSTM, the new advantages of the open economy are being strengthened to promote regional economic development. Consistent with our findings, Wang and Ma [34], from sorting out the relationship between urbanization and resources and the environment, pointed out that the level of land urbanization had increased in all cities, suggesting that they had achieved some results in infrastructure development and ecological conservation. Zhao et al. launched the ILU study from four cities: Urumqi, Changji, Shihezi, and Kelamayi, noting that their scores showed an overall upward trend from 2008-2016 [35], which was generally consistent with our results. However, compared to the studies in other urban agglomerations in China [27, 36], the magnitude of change in ILU was relatively weak in the UANSTM. This may be because the development of urban land use in arid regions was severely constrained by oasis land resources, especially water resources [37].
In terms of cities, Urumqi, Shihezi, and Karamay, with higher LIU, were distributed at the ends and in the middle of the study area, presenting a spatial pattern of three peaks. These cities had a generally high integrated urban carrying capacity, which provided a good impetus to promote the ecological transformation of the city’s socio-economy. It is worth mentioning that the ILU of Shihezi has been steadily increasing, mainly due to the rapid growth in larger weighted economic indicators, such as economic density and per capita retail sales of consumer goods, masking the decline in other smaller weighted indicators, such as per capita industrial wastewater emissions and per capita sulfur dioxide emissions. Obviously, the rapid socio-economic development in Shihezi has sacrificed the ecological environment to a certain extent. In recent years, Shihezi has insisted on such behaviors as returning farmland to forests, returning farmland to grassland, and industrial waste management so that the ecological quality has been significantly improved [38]. However, due to the harsh conditions of the arid zones, the urban areas of Hutubi, Manas, and Wusu, with their extensive mountainous and bare land areas and scarcity of vegetation, have a limited potential to absorb the population, making it difficult to be upgraded for ILU [39]. In the UANSTM, urban socio-economic activities rely heavily on the distribution of oases, which are influenced by topography, vegetation, and water sources [40]. Therefore, there is no doubt that the fragile natural environment in arid zones constrains the enhancement of intensive land use, affecting sustainable land development benefits.
Implications
The focus of this study is to construct the evaluation system of intensive land use in the UANSTM and use the Theil index, obstacle model, and structural equation model, thus exploring the main barriers affecting land intensification in urban agglomerations. From the perspective of practice, each city should pursue sustainable development paths based on its own features and advantages. In the UANSTM, Urumqi, Shihezi, and Karamay have become central cities, which will likely strengthen their own radiation role and drive the utilization of land resources in the surrounding cities. Xinjiang’s 14th Five-Year Plan proposes to cultivate the Urumqi metropolitan area and strengthen the integration of Urumqi as the center to drive the development of the surrounding cities in terms of infrastructure, industrial development, public services, and ecological environment. Currently, cities with lower ILU, such as Hutubi, Manas, and Wusu, have rich coal reserves under their jurisdiction, but the mines cover a large and scattered area, which has a certain impact on the city’s land-intensive situation. With the continuous strengthening of infrastructure and ecological civilization construction, driven by the radiation of cities such as Urumqi, they give full play to their advantages in economy, industry, and resources and achieve sustainable development of social economy, which provides a strong guarantee for the economical, intensive, and efficient use of urban land resources.
Limitations and Prospects
This study provides a scientific basis for analyzing the ILU evaluation in the UANSTM and other similar urban agglomerations, but there are still some shortcomings. On the one hand, due to limited data, the evaluation indicators of ILU may not be comprehensive enough. For example, the study did not include real estate development investment and agricultural machinery power that can reflect the progress of the level of land inputs, which may lead to a certain bias in the level of adaptability of ILU. In addition, due to the regional differences caused by the location conditions or economic development, the contribution of each indicator varies from city to city, and the uniform assignment may bias the study results. On the other hand, since the intensive use of land is a relatively macro concept, we have made a preliminary exploration of theoretical research and empirical analysis, but the demonstration process may need to be further systematized. In addition, the broad guidance and practicality of the findings and conclusions of the study need to be followed up with extended research. In future research, we will explore the coupling of land intensification research with other research areas to help the UANSTM achieve more effective sustainable development.
Conclusions
Conducting research on urban land-intensive utilization is of great significance for realizing high-quality urban development and sustainable development. Taking 11 cities and counties in the UANSTM as research objects, the intensive land use evaluation index was constructed from four subsystems, which can comprehensively evaluate the situation of intensive land use and was superior to the existing evaluation system. We also used the Theil index, obstacle model, and structural equation model to explore the inter-area differences, the obstacle factors, and the role of the four subsystems in relation to each other. The results showed that (1) in the UANSTM, ILU showed an overall upward trend from 2010 to 2022. The subsystems, including the land use degree, land output effect, and land sustainable benefit, except for the subsystem of land inputs, showed an increasing trend, and the promotion of economic efficiency indicators was relatively large. Urumqi, Shihezi, and Karamay have higher ILU and have formed efficient land utilization patterns, which are worthwhile for other cities and counties to learn from. (2) The between-group component of the UANSTM differed significantly and basically showed a gradual decline in fluctuation, indicating that the difference in ILU between cities and counties was gradually decreasing.
(3) Due to the limited oasis land resources in arid zones, most cities and counties have high barriers to construction land and cultivated land-related indicators, which, to a certain extent, restrict the improvement of ILU. (4) Among the four subsystems, the level of land inputs had an important role in promoting the other three subsystems and was the fundamental driving force of the whole system from the results of the structural equation model. However, the rapid increase in the effect of land output, including population agglomeration, economic growth, and social dividends, posed a greater threat to the ecological environment and sustainable land development.
This study innovatively used structural equation models to analyze the relationship among the four subsystems, providing new insights for studying intensive land use. The results of this study had a wide application potential, especially for the government and policy-making departments to provide excellent reference, which was expected to realize the sustainable development of urban land.

