

Introduction
Since the initiation of the reform and opening-up policy, urbanization construction in China has entered a stage of rapid development. However, this process is often accompanied by issues such as excessive resource consumption and ecological environment pollution caused by urban spatial expansion. These problems have severely disrupted the balance and stability of regional ecological environments and further led to a series of issues, including the “resource curse” [1] and widening urban-rural disparities [2]. The strategy of China’s new urbanization is based on the premise of not sacrificing agriculture, resources, and the environment. It aims to promote the integration of urban and rural infrastructure and equalization of public services, achieving coordinated and sustainable development between urban and rural areas. At its core, new urbanization emphasizes human-centered development, focusing not only on the increase of urban population and scale but also on the enhancement of urban quality and equal development for all individuals. The underlying principle of new urbanization is to follow a path of resource conservation and environmental friendliness. It emphasizes the importance of ecological environment protection in the construction of new urbanization. As the material foundation and spatial support of human economic and social activities [3], the ecological environment plays a crucial role in the coupled and coordinated development of new urbanization. Accurately understanding the intrinsic connection and constraint relationship between the ecological environment and new urbanization, and achieving the coordinated development between new urbanization and the ecological environment, are important issues in the context of China’s new development paradigm.
Currently, research in the academic community on the coupled coordination of new urbanization and ecological environment mainly encompasses two aspects: firstly, theoretical exploration of the coupled coordination of new urbanization and ecological environment, primarily manifested in the analysis of coordination mechanisms and the exploration of coordination pathways. In terms of coordination mechanism analysis, scholars believe that the ecological environment exerts a constraining effect on new urbanization, while new urbanization poses stress on the ecological environment [4]. In the process of the coupled coordination development of these two systems, the construction of new urbanization is driven by the intrinsic motivation and important guarantee of ecological environment protection, while ecological environment protection serves as the main carrier and implementation pathway for new urbanization [5]. Regarding the research on coordination pathways, scholars suggest that exploring ecological development channels and models [6], harnessing ecological economic benefits, transforming the economic development mode, strengthening the construction of the ecological environment institutional system, and fostering environmental protection awareness are methods to promote the coordinated development of the two systems [7]. Secondly, there is research on the measurement of the coupled coordination of new urbanization and ecological environment, as well as the influencing factors. Scholars employ methods such as Analytic Hierarchy Process [8], Coupling Coordination Degree Model [9], Comprehensive Response Model [10], etc., to measure the coupled coordination of the two systems. They conduct research at various levels, including national [11], provincial [12], and municipal [13] levels, to study the interactive relationships [14], spatiotemporal evolution [15], and influencing factors [16] of the coupled coordination between the two systems. Although scholars have varied research methods and results concerning the development of the coupled coordination of new urbanization and ecological environment, they all highlight the importance of the coordinated development of new urbanization and ecological environment. Existing literature has revealed the fundamental theories and patterns of the coordinated development of new urbanization and the ecological environment. However, there are still certain limitations. Firstly, most of the existing studies are based on the national or provincial level, with recent expansions to major strategic regions such as the Beijing-Tianjin-Hebei region and the Yangtze River Economic Belt. Nevertheless, there is still a lack of research on the regional coordinated development of China’s eastern, central, and western regions. Secondly, previous research has mainly focused on measuring and evaluating the level of coordination in the development of new urbanization and the ecological environment, as well as characterizing their spatial distribution patterns. However, there is relatively limited research on the spatiotemporal evolution patterns and mechanisms of the coupled coordinated development between the two. Lastly, comparative analysis of the development characteristics and driving factors of new urbanization and ecological environment coordination in different regions is relatively insufficient.
Based on this, this study has the following marginal contributions: Firstly, clarifying the coupled and coordinated mechanisms between new urbanization and the ecological environment in China and scientifically constructing an indicator system for the coupled and coordinated development, providing a reference for subsequent research. Secondly, quantitatively assessing the degree of coupled and coordinated development between new urbanization and the ecological environment, capturing the spatiotemporal characteristics of the coupled and coordinated development, and providing a basis for implementing differentiated development strategies. Thirdly, empirically examining the regional heterogeneity of the effects of different driving factors on the coupled and coordinated development between new urbanization and the ecological environment, exploring the synergistic effects of various driving factors on the degree of coupling and coordination, and providing support for the formulation of development strategies for coupled and coordinated development.
In the following part, we first explain the coupling coordination mechanism of new urbanization and ecological environment. Secondly, the research methods, data sources and indicator system of the article are introduced. Furthermore, the temporal and spatial evolution characteristics and driving factors of the coupling and coordinated development of China's new urbanization and ecological environment are analyzed. Finally, the research conclusions are summarized, and targeted development suggestions are put forward from the aspects of adapting measures to local conditions and regional cooperation.
Experimental
Analysis of the Coupling Coordination Mechanism of New Urbanization and Ecological Environment
The construction of new urbanization and the protection of the ecological environment are significant strategies and important tasks in the process of socialism with Chinese characteristics in the new era. They exhibit a high degree of compatibility and unity in terms of development goals and inherent requirements. The coupled and coordinated development between them has become a major logic and trend in the new era. The coupling and coordination mechanism is illustrated in Fig. 1.
The construction of new urbanization requires promoting the protection of the ecological environment. Firstly, based on a full consideration of the regional carrying capacity of resources and the environment, the construction of new urbanization relies on natural resources, geographical landforms, and cultural history to achieve a scientifically reasonable spatial layout. By strictly controlling the scale of urban construction land, delineating ecological red lines, rationalizing the allocation and efficient use of production factors, optimizing the spatial layout and structure of urban areas, and improving the efficiency of land use, the vision of “promoting intensive and efficient production space, providing livable and moderate living space, and creating beautiful ecological space” in urban development can be realized. Secondly, the new urbanization model abandons the traditional development mode that emphasizes speed over quality, and integrates ecological environment protection into the entire process of urbanization construction. This approach achieves intensive and efficient resource utilization, efficient utilization of human resources, technology, and capital, promotes the aggregation of industries, technologies, and markets, and concentrates the supply of infrastructure. It effectively avoids the high cost of decentralized pollution treatment and the low efficiency of dispersed energy utilization, eliminates the spatial transfer effects of traditional urbanization on the ecological environment, and realizes green, low-carbon, circular, and sustainable development between humans and nature.
Fig.1.
Coupling and Coordinated Development Mechanism of New Urbanization and Ecological Environment. Source: own elaboration.
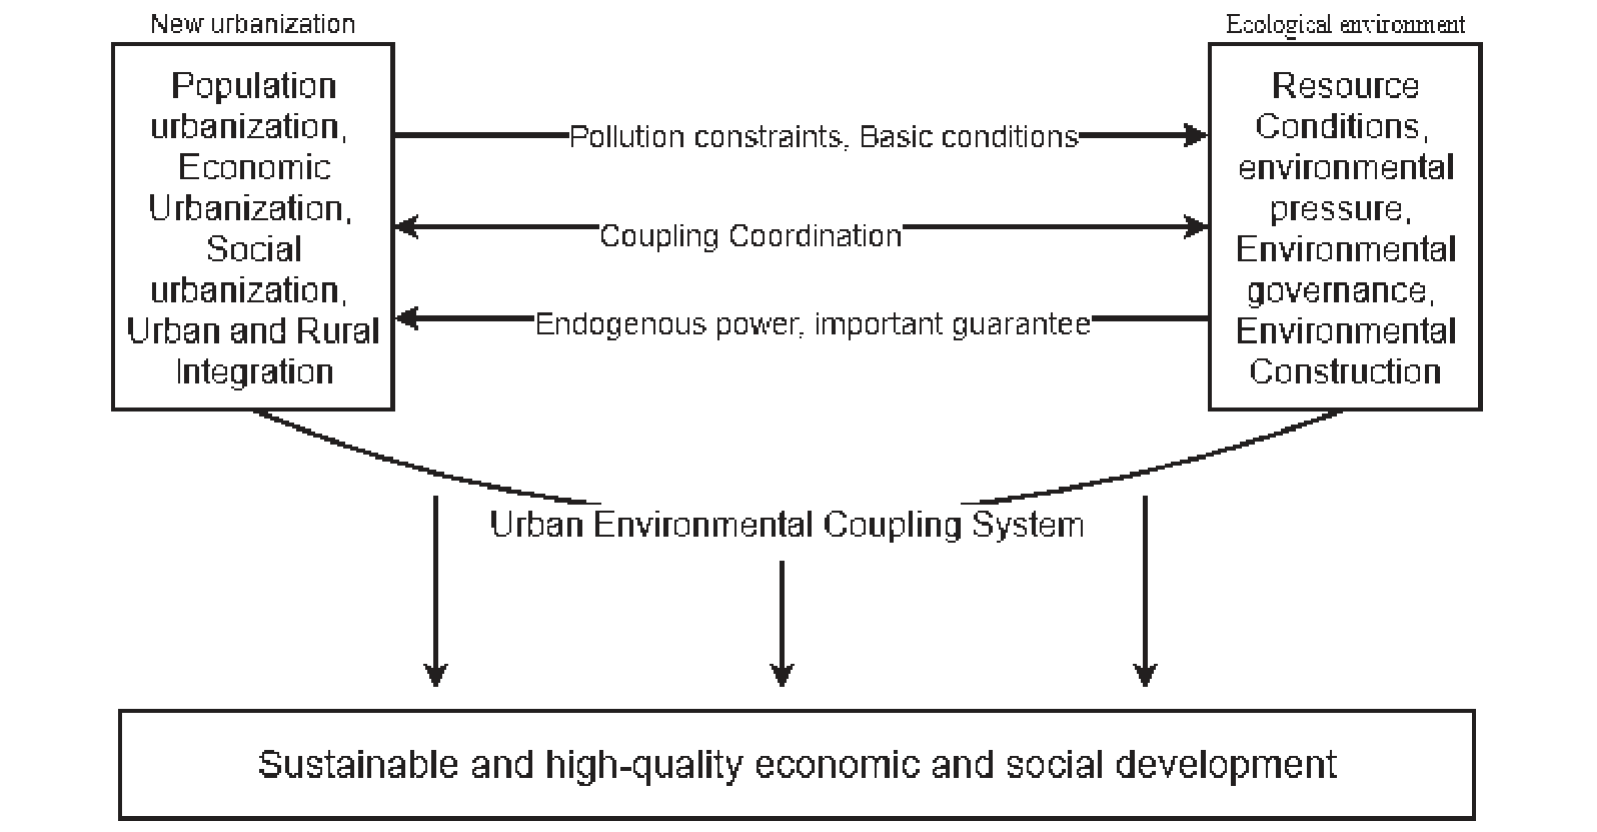
Ecological environment protection contributes to the improvement and efficiency enhancement of new urbanization construction. Firstly, ecological environment protection necessitates a transformation of the existing economic development mode by adjusting industrial structures and promoting green technological innovation. This approach drives the development of regional environmental protection and new energy industries, guiding the concentration of more green production factors in urban areas. By reducing resource consumption and minimizing pollution emissions, it seeks to achieve maximum economic, ecological, and social benefits. It provides inherent motivation and a sustainable source of development for new urbanization, ultimately realizing the sustainable development of urban areas. Secondly, the green transformation of urban production and lifestyle brought about by ecological environment protection not only promotes resource-intensive and efficient social utilization through the cultivation of industries and enterprises with green, low-carbon development capabilities, but also alleviates natural resource scarcity and ecological environmental pressure. It continuously optimizes urban natural systems, population systems, and social systems. Additionally, it fosters resource conservation and environmental protection awareness, cultivates a favorable ecological culture, promotes the construction of green cities, low-carbon cities, and beautiful towns, and enhances the resilience of urban development. It provides vital support for the sustainable development of urban areas.
Study Design
Entropy Method
The entropy method possesses the advantage of objective weighting, which can eliminate the inaccuracy caused by subjective weighting in indicator assessment [17]. Taking into account the inconsistency in indicator magnitudes and units, the indicator data is first standardized before calculation, using the following formula: Positive indicators:
Negative indicators:
After standardization, the entropy method is employed to assign weights to each indicator. Firstly, the weight proportion Pij of the i-th assigned object’s indicator value under the j-th indicator is calculated:
Next, the information entropy Ej is calculated according to the formula:
Among
Finally, the weights Wj of the indicators are calculated using the following formula:
Comprehensive Evaluation Model
Calculate the evaluation index of new urbanization and ecological environment, using the following formula:
μj represents the weights of each indicator, xij’ denotes the standardized values of each indicator, and Uj represents the evaluation value of individual subsystems.
Coupling Coordination Model
The degree of coupling reflects the degree of interaction between systems and focuses on the synchronicity between systems. However, it is difficult to capture the overall level of coordinated development among systems. Consequently, when the comprehensive evaluation values of systems are relatively low, the degree of coupling tends to be higher. To overcome the limitations of the degree of coupling model and effectively measure the strength of interactions between systems, a coupling coordination model that reflects the quality of coordination between systems has been constructed [18]. The calculation of the coupling coordination degree between new urbanization and the ecological environment is represented by the following formula:
In the equation, C represents the degree of coupling, T denotes the coordination index between new urbanization and the ecological environment, α1 and α2 are undetermined weights assigned to the two systems. In the evaluation process, the importance of the two systems is considered to be equal, thus α1 = α2 = 0.5 [12, 14]. D represents the degree of coupling coordination. The coupling coordination degree between new urbanization and the ecological environment is categorized into 10 types [8,12], as shown in Table 1.
Table 1.
Grading of coupling coordination degree between new type of urbanization and ecological environment.
Kernel Density Function
The advantage of the Kernel density function lies in its ability to avoid the subjectivity associated with specifying the form of parameter models, allowing for the study of the distributional characteristics of numerical values based on the data itself [19]. Its formula is as follows:
In the equation, "n" represents the number of observations, "x" represents the mean, "h" represents the smoothing parameter, and "K()" denotes the Kernel function.
Geodetector
Geodetector is a statistical method that can explore the spatial heterogeneity of the coupling and coordination level between new urbanization and ecological environment. It reveals the underlying driving factors and has the ability to overcome the issue of multicollinearity by considering multiple factors simultaneously [20]. The formula for Geodetector is as follows:
In the equation, q represents the influence strength of the influencing factors on the coupling and coordination degree between new urbanization and ecological environment, with a value range of [0, 1]. A higher q value indicates stronger explanatory power. N represents the number of provinces or cities. L represents the stratified data of the influencing factors. σ2 denotes the variance of the coupling and coordination degrees between the two systems across all provinces or cities in the study area, while σi2 represents the variance of the coupling and coordination degrees at the secondary level of regions. The dual-factor enhancement representation states that q(X1X2)> Max(q(X1), q(X2)), where Max(q(X1), q(X2)) represents taking the maximum value between q(X1) and q(X2). The nonlinear enhancement representation states that q(X1X2)>q(X1) + q(X2), where q(X1) + q(X2) represents the sum of q(X1) and q(X2).
Data Sources and Construction of Indicator System
Data Sources
The data for various indicators in this study primarily came from the ‘China Statistical Yearbook’ (2012-2021), ‘China Environmental Statistical Yearbook’ (2012- 2021), ‘China Energy Statistical Yearbook’ (2012-2021), ‘China Rural Statistical Yearbook’ (2012-2021), and the ESP database. Indicators such as population density and per capita road area were calculated based on data from the yearbooks and the database. The classification of the three major regions in China (Eastern, Central, and Western) followed the ‘China Statistical Yearbook 2021.’ It is important to note that this analysis does not include data from Hong Kong, Macao, and Taiwan regions of China.
Construction of Indicator System
By employing bibliometric methods and drawing on relevant scholarly research achievements, this study selects indicators for the two systems of new urbanization and the ecological environment, guided by principles of data availability, scientific validity, comprehensiveness, and rationality. The core of new urbanization lies in the urbanization of people, which extends beyond a simple increase in urban population and instead emphasizes the indiscriminate development of individuals. Therefore, the construction of the indicator system should encompass the urbanization of population, economy, and society. Additionally, the ‘National New Urbanization Plan (2014-2020)’ emphasizes the integrated development of urban and rural areas. Hence, this study innovatively introduces indicators for urban-rural integration and selects four primary indicators (population urbanization, economic urbanization, social urbanization, and urban-rural integration) and fifteen secondary indicators to construct the evaluation indicator system for new urbanization [8, 9, 12, 21, 22]. The existing comprehensive evaluation indicator system for the ecological environment is based on the Pressure-State-Response (PSR) framework, which selects ecological environmental pressure, state, and response as primary indicators for the comprehensive assessment of ecological environmental quality. In this study, based on the 'Opinions of the CPC Central Committee and the State Council on Accelerating Ecological Civilization Construction' and in combination with existing literature [9, 10, 13, 16, 23, 24], a CPDP ecological environment indicator evaluation system is constructed. This system comprises four primary indicators (resource conditions, environmental pressure, environmental governance, and environmental construction) and thirteen secondary indicators. The indicator system is presented in Table 2. Larger values of the indicators denote positive impacts on the coordinated development of the system, while negative values indicate negative impacts. Some indicators are derived through calculations involving other indicators. After determining the characteristic values, the data is normalized and positively transformed. Using the entropy method, development coefficients are calculated for the two systems in each province and city in China. Assigning equal weights, the coupled coordination degree values for the two systems in each province and city are calculated using a coupling coordination model.
Table 2.
Evaluation index system of new type of urbanization and ecological environment. Source: own elaboration.
Results and Discussion
The Spatiotemporal Characteristics of the Coupling and Coordination between New Urbanization and the Ecological Environment
From Table 3, it can be observed that the overall coupling and coordination degree of the two systems in China declined in 2013 and then showed a consistent upward trend. It increased from 0.385 (mildly imbalanced state) in 2011 to 0.508 (marginally coordinated state) in 2020, with a growth rate of 31.85%, indicating the achievement of coordinated development. The changing characteristics are primarily attributed to China’s inclusion of ecological civilization construction in its overall development framework since the 18th National Congress. Ecological civilization construction has been elevated to the same level as economic, political, cultural, and social development, with environmental protection integrated into all aspects of social progress. Additionally, in 2014, China released the “National New Urbanization Plan (2014-2020)” to promote new urbanization through policy measures, facilitating a steady rise in the level of new urbanization. It is evident that China’s high level of attention and the use of policy measures to promote the development of both systems are key factors contributing to the continuous improvement of the coupling and coordination level between the two systems.
When looking at different regions, the temporal evolution and internal disparities of the coupling and coordination degree between the two systems in China’s three major regions are evident. The average coupling and coordination degrees of the two systems in the eastern, central, and western regions are 0.511, 0.420, and 0.402, respectively, exhibiting a stepwise decreasing distribution pattern of “east-central-west”. The eastern region shows a year-on-year increase in the coupling and coordination level of the two systems, rising from 0.457 (approaching an imbalanced state) in 2011 to 0.552 (marginally coordinated state) in 2020, with a growth rate of 20.79%. The eastern region, characterized by economic prosperity and rapid urbanization, although constrained by resource and environmental limitations, is less significantly affected by projects such as the West-East Gas Transmission and West-East Power Transmission, and its coupling and coordination degree between the two systems is much higher than that of the central and western regions. The central region demonstrates an upward trend in the coupling and coordination level of the two systems, increasing from 0.335 (mildly imbalanced state) in 2011 to 0.499 (approaching an imbalanced state) in 2020, with a growth rate of 48.96%. The central region actively undertakes the layout of emerging industries and strengthens the co-governance of ecological environment while actively developing its economy. The inland highlands, which exhibit coordinated development between new urbanization and ecological environment, are rapidly rising. The western region shows an upward trend in the coupling and coordination level of the two systems, rising from 0.352 (mildly imbalanced state) in 2011 to 0.473 (approaching an imbalanced state) in 2020, with a growth rate of 34.38%. Supported by the “Western Development” strategy and the “Belt and Road” initiative, the western region has accelerated urban infrastructure construction while experiencing rapid economic development. Although there is a gap between the coupling and coordination levels of the western region and the eastern and central regions, it also demonstrates a steady growth trend.
Looking at various provinces and cities in China, there are significant disparities in the coupling and coordination degree between the two systems. In 2011, four provinces and cities, namely Liaoning, Shandong, Jiangsu, and Guangdong, all located in the eastern region, reached a state of coupling and coordination. Among them, Guangdong had the highest coupling and coordination degree of 0.563, indicating a marginally coordinated stage. Additionally, seven provinces and cities were in a moderately imbalanced state, with Ningxia having the lowest coupling and coordination degree of 0.21. In 2020, a total of 19 provinces and cities achieved coupling and coordination status, with the eastern region having the highest proportion at 81.82%. Jiangsu had the highest coupling and coordination degree of 0.721, indicating a state of moderate coordination, while Ningxia had the lowest coupling and coordination degree of 0.291, still in a moderately imbalanced state. There are significant differences in the coupling and coordination degree between provinces and cities in China, with a prominent phenomenon of dual-level differentiation and a notable “Matthew effect” among them. This necessitates that provinces and cities with lower coupling and coordination levels recognize the gaps compared to those with higher levels, draw lessons from development experiences, engage in top-level design for systematic development, integrate their own advantageous resources, adaptively choose development paths based on local conditions, and avoid further exacerbating the imbalance between the two systems.
Table 3.
Coupling coordination degree between new type of urbanization and ecological environment.
Dynamic Evolution of Coupling and Coordination between New Urbanization and Ecological Environment
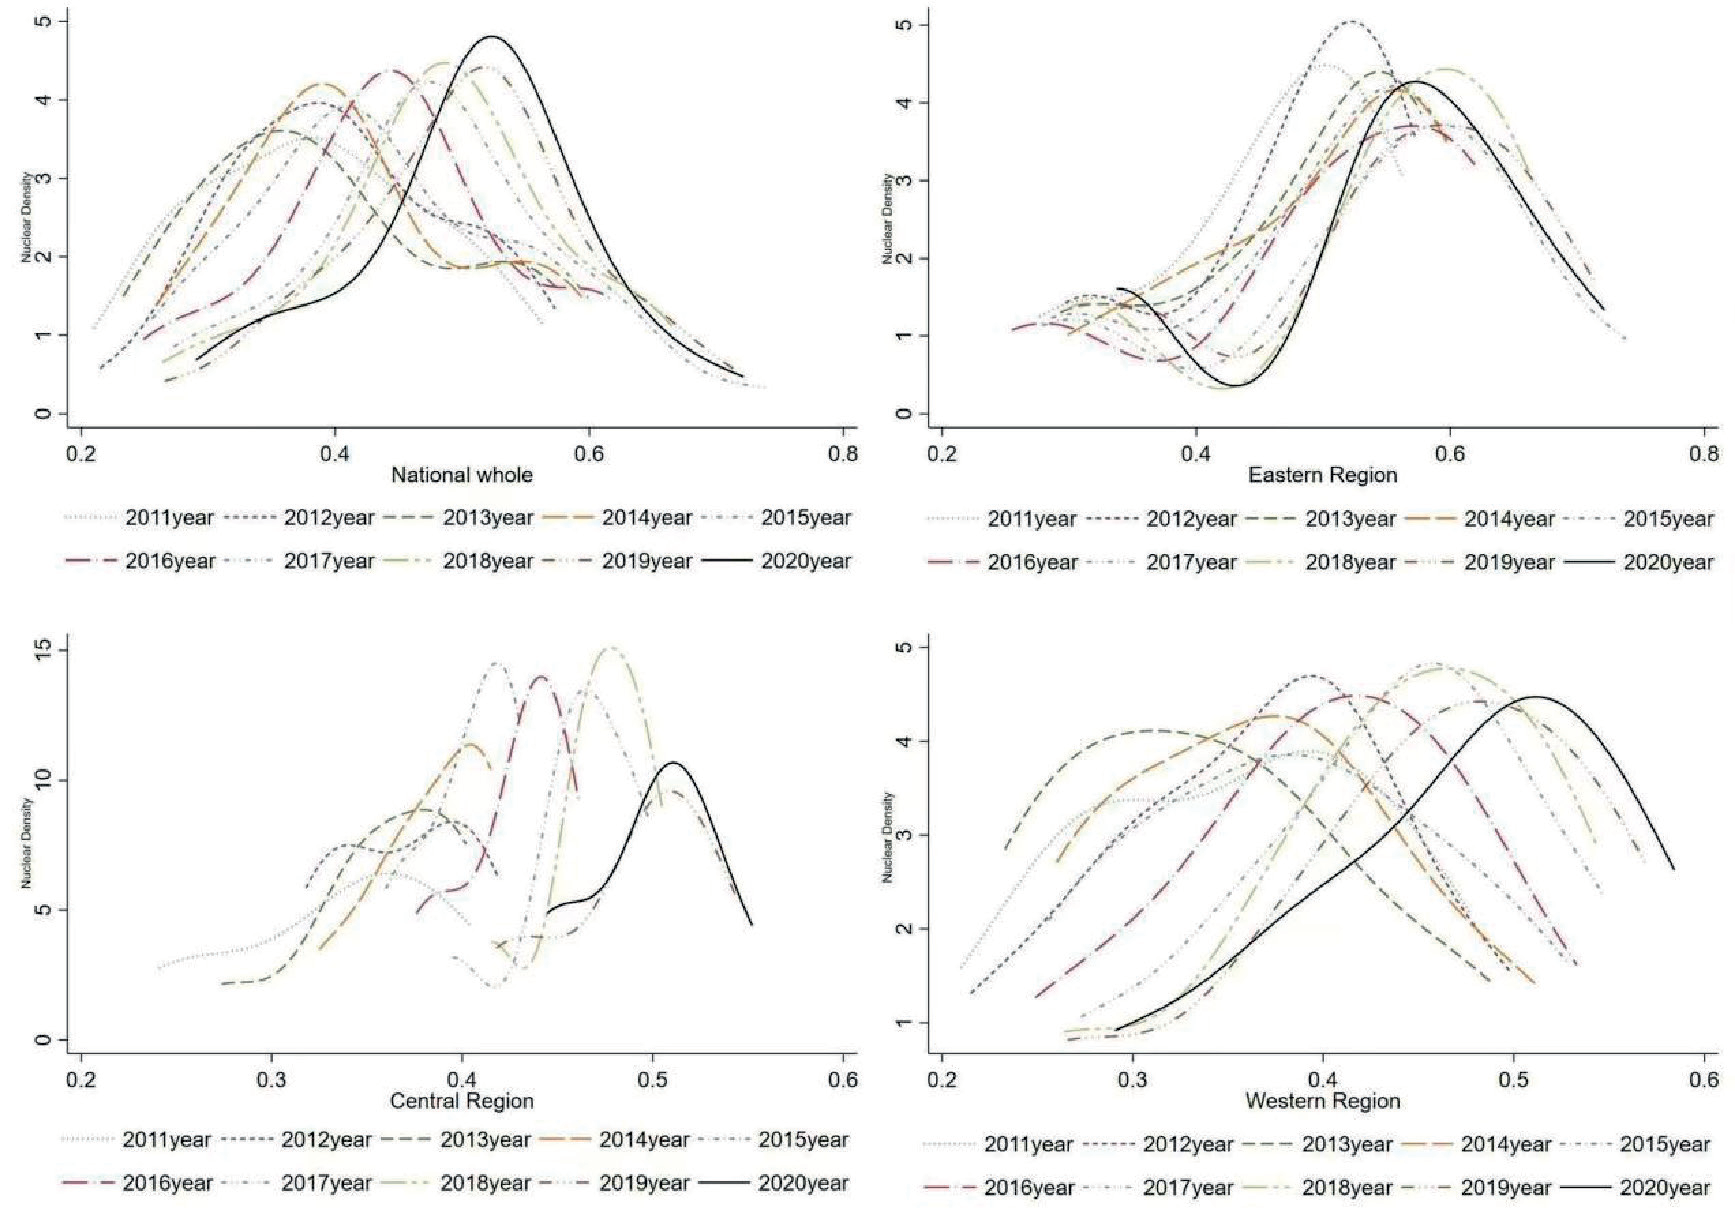
The above research analyzed the spatial and temporal variations of the coupling and coordination degree between new urbanization and ecological environment in 31 provinces and cities in China. In the following, the non-parametric kernel density estimation method is applied to further analyze the distribution, trends, and polarization dynamics of the coupling and coordination degree between new urbanization and ecological environment in these 31 provinces and cities. Due to the small number of groups, the Gaussian kernel function is preferred over other kernel functions. Therefore, the Gaussian kernel function is used to estimate the coupling and coordination degree, with automatic bandwidth selection. Kernel density estimation is conducted for the entire country, as well as for the eastern, central, and western regions, and the density distribution graphs are plotted as shown in Fig. 2.
Overall, the kernel density center of the coupling and coordination degree during the study period shifted to the right, with an increasing and then decreasing magnitude of movement. The peak height gradually increased, while the peak width initially expanded and then contracted. The kernel density curve exhibited a weak bimodal pattern from 2012 to 2016, and subsequently, the right tail of the peak gradually shortened. This indicates that the coupling and coordination degree between new urbanization and ecological environment has been gradually increasing during the study period, but with a decreasing rate of improvement. The degree of regional imbalance initially increased and then decreased, and the polarization phenomenon was more prominent from 2012 to 2016, with a gradual reduction in low-value areas and an aggregation of high-value areas.
In terms of regional variations, the movement patterns of the kernel density centers for the coupling and coordination degree between the two systems (new urbanization and ecological environment) in the eastern, central, and western regions are generally similar to the overall trend, but there are certain differences in the shape of the curves. In the eastern region, the kernel density curve exhibits an initial increase and then a decrease in the magnitude of movement, accompanied by a "wave-like" downward trend in peak height. The peak width slightly contracts, accompanied by a left tail, and shows a weak bimodal pattern. This indicates a decreasing trend in the magnitude of improvement in the coupling and coordination degree between the two systems in the eastern region, with a reduction in regional imbalance. However, the polarization phenomenon is prominent, with a significant "high-low" disparity (more high-value areas and fewer low-value areas) between regions. In the central region, the kernel density curve shows an initial increase in the magnitude of movement, followed by a slowdown. The peak width contracts, and the peak height initially increases and then decreases. The left tail gradually shortens, with a clear bimodal pattern in 2012 and a weak bimodal pattern in other years. This indicates a decreasing trend in the magnitude of improvement in the coupling and coordination degree between the two systems in the central region, with a reduction in regional imbalance. In 2012, the polarization was severe, and low-value areas of the coupling and coordination degree gradually decreased. In the western region, the kernel density curve shows a gradual increase in the magnitude of movement. The peak height gradually increases, and the peak width expands. The left tail elongates, and there is a tendency to evolve into a bimodal pattern. This indicates an increasing trend in the magnitude of improvement in the coupling and coordination degree between the two systems in the western region, but with an increasing degree of regional imbalance. It mainly exhibits a "high-low" disparity, and the polarization phenomenon intensifies. In light of this, each region should have a profound understanding of the evolving trends in the coupling and coordination between the two systems, enhance interregional cooperation capabilities, strengthen the demonstrative role of regions with a high level of coupling and coordination, reinforce the catch-up effects in regions with a low level of coupling and coordination, and narrow the regional disparities.
Analysis of Driving Factors for the Coupling and Coordinated Development between New Urbanization and Ecological Environment
The development of the coupling and coordination between new urbanization and ecological environment is influenced by multiple factors. Zhang argues that the level of economic development, upgrading of industrial structure, and degree of government intervention significantly impact the coupling and coordination between new urbanization and green development [25]. Meanwhile, Zhao suggests that government capacity, technological investment, degree of openness to the outside world, and level of industrialization exhibit regional heterogeneity in their effects on the coupling and coordination between new urbanization and ecological environment, with different influences in different regions [16]. Therefore, this study draws upon existing research findings [9] and combines them with the actual situation of China's development in new urbanization and ecological environment coupling and coordination. Ultimately, seven indicators including economic development, social security, and technological innovation are selected as detection factors. Referring to the division of coupling coordination degree levels, various factors were classified into six levels using ArcGIS 10.6. The geographic detector analysis method was employed to conduct factor detection and interaction detection analyses separately for the years 2011, 2015, and 2020. The specific factor settings are shown in Table 4.
According to Table 5, during the study period, economic development (x1), social security (x2), technological innovation (x3), industrial structure (x4), market environment (x5), government capacity (x6), and openness to the outside world (x7) all have significant influences on the coupling and coordination between the two systems. The development of new urbanization and ecological environment coupling and coordination is the result of the interaction among these factors. Specifically, the findings can be summarized as follows:
Economic development-driven: Economic development serves as the foundation for the coupling and coordination between the two systems. The level of regional economic development is closely linked to the construction of new urbanization and the protection of the ecological environment. The improvement of regional economic level not only provides the basic conditions for new urbanization construction but also ensures material support for ecological environment protection. The influence of economic development level on the coupling and coordination in the eastern region is gradually decreasing, while its impact on the central and western regions is gradually increasing. This implies that although economic development level is a fundamental condition for the development of coupling and coordination between the two systems, it is not the sole driving factor. In economically developed regions, while emphasizing the role of economic development in promoting coupling and coordination, attention should also be paid to other factors such as social security.
Table 4.
Setting of Driving Factors for the Development of Coupling and Coordination between New Urbanization and Ecological Environment. Source: own elaboration.
Social security-driven: Social security capability plays a significant role in the development of coupling and coordination between the two systems. Moreover, with the passage of time, the influence of social security capability on the coupling and coordination between the two systems in the three major regions gradually strengthens. The enhancement of social security capability signifies the improvement of social infrastructure and the enhancement of public service capacity, both of which are emphasized in the context of new urbanization. The improvement of social security capability is a long-term and fundamental task, representing a higher level and deeper degree of urbanization.
Technology innovation-driven: The level of technological innovation serves as a crucial pillar for the development of coupling and coordination between the two systems, providing impetus for urban construction and vitality for environmental protection. The impact of technological innovation on the coupling and coordination between the two systems is gradually strengthening in the eastern and central regions, while it is gradually diminishing in the western region. This suggests that compared to the eastern and central regions, the supportive role of technological innovation in the development of coupling and coordination between the two systems in the western region has not yet fully manifested. The western region should abandon the extensive urban development model characterized by high energy consumption and high emissions, actively introduce advanced technologies and equipment, undertake green revolution, promote industrial transformation and upgrading, and pursue a low-energy, low-emission urban development model.
Industrial structure-driven: The transformation of industrial structure serves as a direct driving force for the development of coupling and coordination between the two systems. The upgrading of industrial structure can enhance the resilience of urban development and improve the depth and breadth of coupling between new urbanization and ecological environment. The impact trend of industrial structure-driven and technology innovation-driven is generally similar in the three regions, indicating that the western region should promote industrial structure transformation through technological innovation and achieve balanced allocation of urban resources and reduced over-reliance on ecological resources through industrial structure transformation.
Market environment-driven: The market environment is the dominant force driving the development of coupling and coordination between the two systems. A sound market environment can effectively allocate resources and interests and guide demand to meet the needs of regional green development. The impact of the market environment on coupling and coordination in the eastern region is gradually diminishing, while it is gradually increasing in the central and western regions. This indicates that compared to the eastern region, the central and western regions should fully leverage the invisible hand of the market in resource allocation, promote the maximization of interests and the optimization of efficiency in resource allocation, and meet the requirements of green urban development and ecological environment protection.
Government capacity-driven: Government’s macroeconomic regulation and control serves as a crucial safeguard for the coupled and coordinated development of the two systems. It enables intervention and control over urban construction and ecological environment protection when they are in a disordered state, and supervision and incentives when they are in an ordered state. The impact of government capacity on the coupling and coordination in the western region is gradually diminishing, while it is gradually increasing in the eastern and central regions. This suggests that the eastern and central regions should emphasize the government’s macroeconomic regulation and control over new urbanization construction and ecological environment protection, in order to minimize the negative impact of market failure on urban development and environmental protection.
Openness-driven: Openness to the outside world also exerts significant influence on the coupled and coordinated development of the two systems, although its impact is gradually diminishing. Foreign investment can bring in abundant technology and capital, driving regional industrial development and new urbanization construction. It is an important component for establishing a dual-cycle development pattern between domestic and international markets. However, it may also lead to the phenomenon of a „pollution haven,” resulting in the continuous deterioration of regional environmental quality and reducing its apparent impact on the coupled and coordinated development of the two systems.
The driving factors of the coupling and coordinated development between new urbanization and the ecological environment do not exist independently but are the result of multiple factors acting in synergy (Table 6). The interaction among these factors is primarily characterized by bi-factor enhancement and supplemented by linear enhancement. The interaction between pairs of factors is stronger than the individual impact of each factor, with some interaction factors reaching a q value of 1.000, indicating consistency between their interactions and the degree of coupling and coordinated development between the two systems. Therefore, it can be inferred that adopting a diversified and differentiated combination of development strategies is conducive to enhancing the degree of coupling and coordinated development between new urbanization and the ecological environment.
Table 5.
Measurement of the Influence of Driving Factors on the Coupling and Coordinated Development of New Urbanization and Ecological Environment. Source: own elaboration.
Discussion
The coordinated development of China's new urbanization and ecological environment exhibits an upward trend in coordination degree, with a spatial pattern of decreasing gradients from the eastern and central regions to the western region, which is generally consistent with previous research findings [9, 25]. However, different regions demonstrate distinct characteristics in the coordinated development of new urbanization and the ecological environment. In the Yellow River Basin, there is a changing trend of initially increasing and then decreasing coordination degree [16], while the Yangtze River Economic Belt shows an overall increasing trend in coordination degree [9]. Additionally, in the process of the coordinated development of new urbanization and the ecological environment, scholars have predominantly focused on the spatial effects of coordination degree [10, 12, 15, 21], neglecting the dynamic evolution trend. This study provides supplementary analysis from the perspective of dynamic evolution.
Regarding the analysis of driving factors in the coordinated development of new urbanization and the ecological environment, previous research has primarily focused on the impact of specific variables on coordination degree within a certain time period [11, 12, 15, 25], overlooking the temporal variations in influence. In this study, a geographical detector model with multiple time points is utilized to analyze the driving factors, capturing the temporal heterogeneity of these factors and exploring their interactive driving effects on coordination degree. Furthermore, the driving effects of economic development, social security, technological innovation, industrial structure, market environment, government capacity, and openness to the outside world on coordination degree are generally consistent with previous studies [9, 12, 16]. However, the study also reveals the heterogeneity in the changing driving effects of different factors across regions, suggesting the need for tailored transformation paths and management measures to alleviate structural contradictions and regional imbalances in each area.
Conclusions
Based on the newly constructed index system of new urbanization and ecological environment, coupled with the coupling coordination degree model, the coupling coordination degree of new urbanization and ecological environment in 31 provinces and cities in China from 2011 to 2020 was calculated. The spatiotemporal evolution and driving factors of the coupling coordination level between the two systems were analyzed using non-parametric kernel density estimation and geographical detector models. The following conclusions can be drawn:
Table 6.
Results of Interactions among Driving Factors. Source: own elaboration.
(1) The coupling coordination degree of new urbanization and ecological environment shows an increasing trend. The overall level in the country rose from 0.385 (mildly imbalanced state) in 2011 to 0.508 (barely coordinated state) in 2020, but it still remains at a low level of coupling coordination. In terms of regional distribution, the coupling coordination degree between the two systems exhibits a "East-Central-West" pattern with a decreasing stepwise distribution. The temporal evolution and internal differences of the coupling coordination degree between the two systems in the three major regions are evident. During the study period, the number of provinces and cities achieving coordinated development between the two systems has significantly increased, but they are mostly concentrated in the eastern region, showing significant disparities among provinces and cities.
(2) The overall coupling coordination degree of new urbanization and ecological environment in the country is gradually increasing, but the rate of improvement in the coordination level is decreasing. The degree of regional imbalance initially increases and then decreases, with a prominent polarization phenomenon from 2012 to 2016. The coupling coordination levels between the two systems in the three major regions (East, Central, and West) show an overall increasing trend. The rate of improvement in the coupling coordination level and the degree of regional imbalance in the Eastern and Central regions exhibit a decreasing trend, while the Western region shows an increasing trend in both the coupling coordination level and the degree of regional imbalance. There is a pronounced dual differentiation phenomenon between the Eastern and Western regions.
(3) Economic development, social security, technological innovation, industrial structure, market environment, government capacity, and openness to the outside world all have significant impacts on the coupling coordination between the two systems. The influence of each factor on the development of the coupling coordination between the two systems varies significantly across different periods and regions, indicating heterogeneity. While promoting the improvement of the coupling coordination level through individual factors, greater attention should be paid to the cumulative effects of multiple factors on the development of coupling coordination between the two systems. Adopting a diversified and differentiated combination of development strategies would be more conducive to promoting the coordinated development of the two systems.
Based on the characteristics of the coordinated development of new urbanization and ecological environment, targeted development suggestions are proposed from the perspectives of adapting to local conditions and regional cooperation:
(1) Tailor measures to local conditions to promote the coordinated development of the two systems. Based on regional differences in the development stages and relative development types of the two systems, formulate differentiated measures for new urbanization development and ecological environment protection policies. In the eastern region, strict control of ecological redlines, alleviating the conflict between human and the environment, nurturing green spaces, enhancing the self-regulation capacity of the ecological environment, accelerating breakthroughs in innovation leadership, and driving regional new urbanization construction while leading the development of emerging industries and modern services. In the central region, efforts should focus on consolidating the pattern of ecological and green development, quickly phasing out outdated production capacity, accelerating the transformation of high-carbon industries, emphasizing the synergistic effects between industrial transformation and new urbanization construction, and promoting urban-industrial integration. In the western region, precision and effectiveness in strategy implementation should be emphasized, with increased investment in urban infrastructure, addressing shortcomings in people’s livelihood, improving urban functions, and leveraging regional resources to achieve the multifunctional and sustainable development of resource-based urban industries [26].
(2) Strengthen regional cooperation to enhance interregional complementary advantages. To address the issue of regional development imbalances, it is necessary to break free from the constraints of traditional administrative divisions, coordinate regional interdependence, and leverage urban clusters and metropolitan areas to promote the coordinated linkage between large, medium, and small cities and small towns. Accelerate the construction of urban-rural interconnection systems, gradually promote the establishment of a urban development model where regional costs are jointly shared, benefits are shared, and public services are shared, and comprehensively establish a ‘two-horizontal and three-vertical’ urbanization pattern. Enhance the ecological security barrier system, accelerate the development of ecological barrier areas in the Qinghai-Xizang Plateau, key ecological areas along the Yellow River, key ecological areas along the Yangtze River, as well as ecological barrier zones in the northeastern forest belt, northern sand control belt, southern hilly mountainous areas, and coastal zones. Improve the ecological protection compensation mechanism, increase funding for key ecological functional areas, important water source areas, and natural conservation areas, and encourage beneficiary areas, protected areas, and upstream and downstream areas within watersheds to engage in horizontal ecological compensation through various forms such as financial support and industry assistance.
(3) Balance internal and external factors to fully leverage the cumulative effects of various drivers. Based on the heterogeneity of the driving factors for the coordinated development of the two systems, in the eastern region, there should be a continued emphasis on enhancing the collaborative role of technological innovation and industrial structure in promoting the coordinated development of the two systems. This involves refining the green technology innovation system and mechanisms, optimizing the green technology innovation financing system, supporting various forms of social capital involvement in green technology innovation, accelerating the construction of green technology infrastructure, and promoting integrated allocation of resources in key ecological areas, projects, bases, talents, and funds. Advancing the high-level and modernization of the green industrial chain supply chain and building a modern green industrial system that synergizes real economy, technological innovation, modern finance, and human resources development. Leveraging the advantages in the scale, complementary aspects, and certain pioneering areas of the green industry to consolidate and enhance the competitiveness of the entire industry chain in less developed sectors.In the central region, further optimization of the market environment and increased openness to the outside world are required. This includes establishing a high-standard market system, promoting high-quality development of private enterprises, further stimulating the positive roles of private enterprises in urban construction, innovation promotion, job creation, and environmental improvement, advancing factor market reform, and invigorating the vitality of various market entities. It also entails persistently implementing broader, wider, and deeper opening-up policies, accelerating the transfer of domestic and foreign industries, supporting the establishment of inland open economic pilot zones and key border development and opening-up experimental zones in provinces like Jiangxi, Jilin, Heilongjiang, and advancing trade liberalization and facilitation in the central region. In the western region, efforts should focus on improving economic development, social security, and government management levels, continually innovating economic growth models, and shifting from a ‘resource-driven’ to an ‘innovation-driven’ urban economy, with a focus on the digital economy as the lead and high value-added sectors as the core. This involves deepening the household registration system reform, accelerating the urbanization of rural migrant populations, enhancing supporting policies related to the urbanization of rural migrant populations, and effectively improving the actual sharing levels of basic public services such as urban compulsory education, housing security, and healthcare. During the population transfer process, there should be a strong emphasis on enhancing citizens’ awareness of ecological environmental protection, strengthening ecological environmental protection education, implementing ecological environmental governance goals, delineating responsibilities at all levels, and linking ecological environmental governance to party and government performance assessments [27]. Additionally, support for green enterprises and green industries should be provided, fully harnessing the ‘model’ role of green corporate and industrial transformation and development.

