

Introduction
Ecosystem services (ES) refer to the natural environmental conditions and benefits that ecosystems create and maintain for human beings’ survival. They mainly include provisioning, regulating, supporting, and cultural services [1]. The Union Nations Millennium Ecosystem Assessment found that more than 60% of ecosystem services are continuously degraded by socioeconomic development and global change impacts. The phenomena have led to research concerns about the correlation between ESs and susceptible factors. Due to the diversity and spatial heterogeneity of ESs [2], there are complex interactions among ESs. The interactions manifest as trade-offs or synergies relationships [3, 4], which change dynamically along with external forces such as natural conditions and human activities. Therefore, it is necessary to study the interactions and formation mechanisms between ESs. It contributes to reducing the negative impacts of the relationships between ESs and improving human well-being for sustainable economic-social-ecological development [5].
In recent years, many studies have been conducted on the trade-off and synergy relationships among ESs. Zhao et al. [6] revealed the ESs trade-off/synergy relationships of the Yangtze River Delta region in China by trade-off/synergy indicator, which provided useful information for regional trade-off decision-making and effective implementation of ES management. Li et al. [7] applied Pearson correlation analysis and bivariate spatial auto-correlation to explore the trade-offs and synergistic relationships in the Hexi region. Li et al. [8] measure the tradeoff/synergy relationships between ESs in the Xin’an River Basin from 1999 to 2019 using the Ecosystem Service Change Index, correlation coefficient, and spatial autocorrelation method. Chen et al. [9] studied the spatiotemporal dynamic of trade-offs and synergies between ESs on the Qinghai-Tibet Plateau using pixel-by-pixel correlation analysis. Zheng et al. [10] explored the trade-offs/synergies between ecosystem services at county and grid scales in the Three-River Headwaters region (TRH), revealing the linkages between ecosystem services at multiple scales. Bivariate spatial autocorrelation and ecosystem Services trade-off degree methods, are widely used in identifying tradeoffs and synergies between ecosystem services, and have been proven effective in exploring these relationships in forests and mountain regions [11, 12].
The ESs trade-off/synergy studies mentioned above are all based on historical data, and it is difficult to propose corresponding response strategies to ES changes caused by human activities or climate change due to the lack of attention to change in ecosystem functions trade-off/synergy in future scenarios. Scenario analysis, as an effective tool for the scientific management of ESs [2], applies the results of human selection preference to ES optimization decisions, providing aid to decision-making on the sustainability of ESs. Meanwhile, the simulation of ES trade-off/ synergy relationship, integrating a variety of factors including natural and social, can enhance understanding of ecosystem changes under different scenarios [13, 14] and thus effectively improve the management of ecosystem services. Land use change simulation is the research basis for ESV scenario analysis. Current simulation methods for land use change mainly include cellular automata(CA), CA-Markov, CLUE-S, and FLUS models [15-17], but the above models are difficult to simulate patch-level changes in land use types [18]. The Patch-generating Land Use Simulation (PLUS) model contains a new multi-class seed growth mechanism that can better simulate land use patch changes [19] and has shown good simulation results in existing studies [20-22].
Current research on island ecosystem services has mostly focused on the measurement of ESV [23], the expression of spatial relationships [24], and the influence of human activities [25, 26]. However, few studies have focused on the trade-off/synergy relationships between ecosystems in tropical island regions. Hainan Island is a large tropical island with integral and independent ecosystems [27]. With climate change and increasing human activities, the island ecosystem is strongly disturbed and the ecosystem services are highly susceptible to damage and degradation and difficult to recover [28, 29], so it is essential to quantify the spatial and temporal changes in trade-offs and synergies among ecosystem services on Hainan Island. At the same time, the trade-off synergistic relationship between ecosystem services needs to be continuously approached to the "Pareto optimal" state in the ecological domain through the game, to realize the sustainable supply of ecosystem services in Hainan Island. Furthermore, scenario simulation based on this can provide governance solutions for conserving and managing ecosystem functions in tropical islands. In addition, we used a hexagonal grid for the ecosystem service evaluation due to its ability to finely characterize the distribution of ESV [30].
Therefore, this paper calculates the ESV of Hainan Island based on land use data combined with the value equivalent factor method, simulates the island-wide land use and its ESV changes under different scenarios through the PLUS model, and analyses its trade-off/synergistic relationships. This study intends to address the following questions: firstly, to explore the spatial and temporal changes of ESV in Hainan Island and the reasons for them. Secondly, to focus on depicting the spatial trade-off/synergy relationships of ESVs on tropical islands. Thirdly, to study the future trade-off/synergy relationships among ecosystem functions through scenario simulation, and to provide a scientific basis for the management model of sustainable development in tropical island regions.
Materials and Methods
Overview of the Study Area
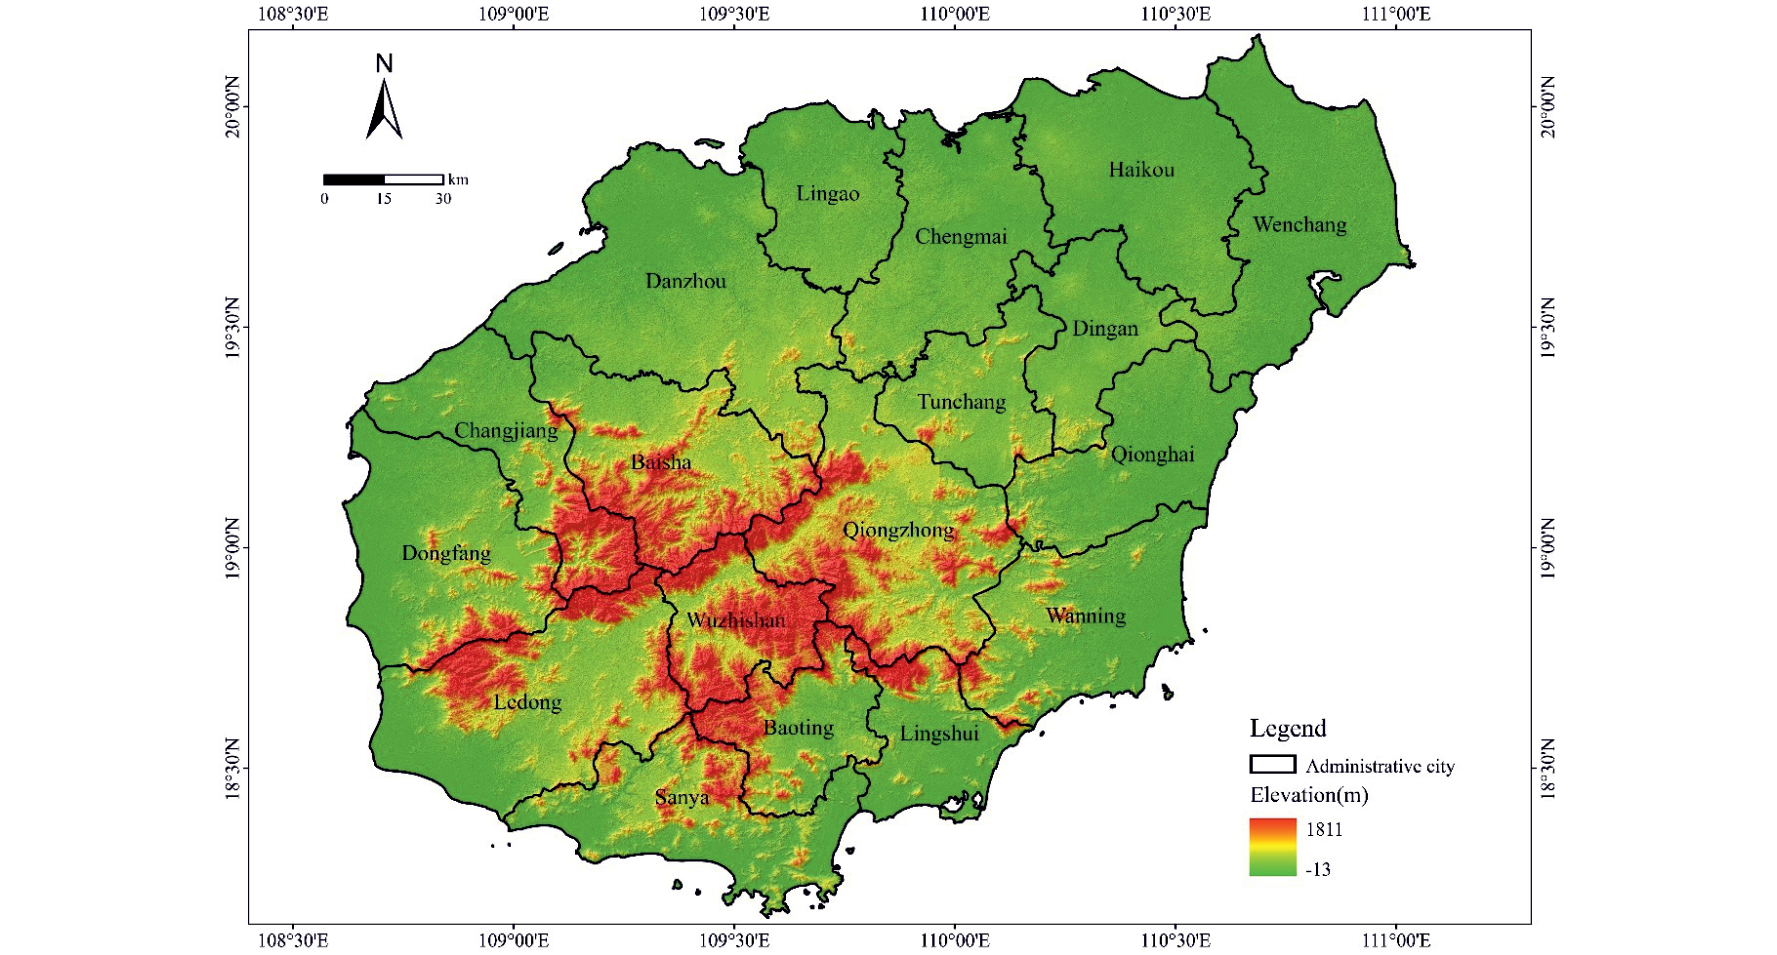
Located in the southernmost tip of China’s mainland, Hainan Island (18.80°~20.10°N, 108.37°~111.03°E) covers an area of about 34,000 km2. It is influenced by the tropical monsoon climate, with long summer and no winter, and abundant rainfall. The overall topography of Hainan Island is low around and high in the middle (Fig. 1), constituting a circular stratified landform with an obvious gradient structure.
The administrative area includes 18 cities and counties. In the last two decades, with the implementation of policies such as Hainan International Tourism Island and Hainan Free Trade Port, Hainan Island has experienced rapid urbanization and huge changes in land use patterns, which have had a profound impact on the island’s ecosystem services [31].
Data Sources and Processing
The land use data used in the study were obtained from the Resource and Environmental Science and Data Center, Chinese Academy of Sciences with an accuracy rate of over 90% [32]. According to the national land-use, remote sensing monitoring classification system and the Classification of Land Use Status GB/T21010- 2017, Hainan Island land-use data was reclassified into six categories: arable land, forest land, grassland, water area, built-up land, and unused land.
A total of 15 driving factors including natural, accessible, and socio-economic drivers were listed in Table 1. Among them, elevation data were derived from the National Geomatics Center of China, and slope data were extracted from elevation. Annual precipitation and annual average temperature are obtained by interpolation weather stations in Hainan; Accessible factors were obtained by Euclidean distance in ArcGIS 10.2; Socioeconomic data were obtained from yearly statistics data of cities and counties in Hainan Province.
Methods
Ecosystem Services Evaluation
The ESV was estimated mainly concerning the value equivalent factor method based on the unit area [33]. Based on the equivalent coefficient table developed by Xie et al., the economic value of one ecosystem value standard equivalent factor in China has been determined to be 3406.50 yuan/hm2. According to the ratio of the average actual grain yield per unit area in Hainan Province (4350.53 kg/hm2) to the national average (4982.00 kg/hm2) from 2000 to 2018 , a revised factor was calculated for ESV of Hainan Island [30, 34]. Therefore, the ESVs for one standard equivalent factor of Hainan Island equals the revised factor multiplied by the one ecosystem value standard equivalent factor of 2974.72 CNY∙hm-2. Considering the actual land-use patterns of Hainan Island, a table of ES equivalent value per unit area for different land-use types was obtained (Table 2).
Based on the above variables, the value of ESs in Hainan Island was estimated follow:
Table 1.
Data source table.
Table 2.
Factor table of ecosystem services value per unit area in Hainan Island (CNY∙hm-2).
where ESV is the total value of ESs in Hainan Island; Ak is the area of the k-th land-use type; VCk is the ES value equivalent factor of the k-th land-use type; ESVf is the f-th value of ES; VCfk is the f-th ES value coefficient of the k-th land-use type; ECf is the f-th ES value equivalent factor of land-use types; Eα is one standard equivalent factor of ES value.
Methods for Trade-off/Synergy Analysis between ESV
(1) Calculation of Ecosystem Services Trade-off Degree(ESTD)
To evaluate the trade-off/synergy relationship of ES values across the island, this paper uses ESTD to measure the interactions of ES variation [35], and ESTD is estimated as follows:
where ESTDij is the ESTD between i-th and j-th ES value; ESCit1, ESCit2 is respectively the change of i-th ES value variation at the moment of t1, t2 respectively; ESCjt1, ESCjt2 is the change of j-th ES value variation at the moment of t1, t2 respectively; the positive/negative of ESTDij similarly represents the trade-off/synergy relationship between the i-th and j-th ESVs, and the magnitude of its absolute value represents the change relative to the j-th ESV, and the strength of the change of the i-th ESV.
(2) Estimation of bivariate spatial autocorrelation
To explore the spatial trade-off/synergy relationship among ESVs across the island, the Bivariate Local Moran’I index is selected for bivariate spatial autocorrelation analysis by GeoDA for the four first-level classes of ESVs, which can effectively describe the spatial association and dependence characteristics between two geographical elements [36] with the following equation:
where IB is the bivariate local Moran index, wij is the spatial weight between elements xi, yi, and n is the number of elements. Moran'I>0 means there is a positive correlation between variables, and the larger the value the more significant the spatial positive correlation; Moran'I = 0 means there is no significant relationship between variables; Moran'I<0 means there is a negative correlation between variables, and the smaller the value the more significant the spatial negative correlation.
PLUS model
The PLUS model integrates a rule-mining framework based on the land expansion analysis strategy (LEAS) and the CA model based on multi-type random patch seeds (CARS) [19]. LEAS was used to explore the relationships between driving factors and land expansion by employing a random forest classification (RFC) algorithm, while the CARS is a CA model that includes a patch-generation mechanism based on multi-type random seeds of land uses.
(1) PLUS model and validation
In this study, fifteen drivers including natural, accessibility, and socio-economic factors were used to calculate the growth probabilities of land use types based on two periods of land use data (2010-2018). In CARS, land use changes in 2018 were simulated by combining parameters such as future land demand, the suitability probability of land-use types, transition matrix, and neighborhood weight.
The future demand for land use can be derived from Markov chains. The neighborhood weights were determined by calculating the proportion of the expansion area of each land use type to the total land expansion area, using land use expansion maps from LEAS module during 2010-2018. Therefore, the neighborhood weights from from strong to weak: construction land was 0.478, unused land was 0.093, grassland was 0.063, water was 0.039, cultivated land was 0.023, forest land was 0.010. Patch generation threshold is a descending threshold for the model to generate new patches, ranging from 0 to 1. A higher threshold means that the cells with higher overall probabilities are usually most likely to change. Expansion coefficient is a parameter that adjusts the model to generate new land use patches, which ranges from 0 to 1. The higher coefficient means that the model has a higher probability to generate new patches. With reference to existing studies and land use characteristics of Hainan Island, the patch generation threshold and expansion coefficient were set to 0.9 and 0.1, respectively [19].
The 2018 data simulated by the PLUS model were compared with the actual 2018 land use data to calculate Kappa coefficients and overall accuracy, which were used to validate the model accuracy. The results show that the Kappa coefficient is 0.883 and the overall accuracy is 93.72%, indicating that the simulation results are reliable.
(2) Scenarios Settings
According to the actual situation of Hainan Province and current researches [37,38], three scenarios of Natural Development scenario (ND), Economic Development scenario (ED), and Ecological Protection scenario (EP) were set up to simulate the land use change in Hainan Province in 2034 in the future. The specific settings of each scenario were as follows:
(1) ND scenario: ND scenario entails a land-use change that follows the original development trend in Hainan Island. The land transition is not constrained and the value of transition matrix is set to 1.
(2) ED scenario: The development of Hainan Free Trade Zone (Port) is taken into consideration in the ED scenario, which raises the data on future demand for built-up land. ED scenario depicts a situation in which the local prioritized the development of built-up land for meeting the demand for economic development. The total demand for built-up land is set to a 25% increase on the original basis. The probability of transferring built-up land out of the transition matrix is 0.
(3) EP scenario: The scenario considers the implementation plan for the National Ecological Civilization Plot Zone (Hainan). In order to enhance the protection of the ecological environment, the EP scenario restricts ecological land development, including the transfer out of forest land, grassland and water. The transition matrix for ED and EP scenarios is shown in Table 3.
Table 3.
Land use transfer matrix of simulation scenarios.
Table 4.
Change rate of ESV in Hainan Island for each period.
Results
Spaciotemporal Change of ESV in Hainan Island
The ESV of Hainan Island from 2000-2018 first increased from 402.37×10⁹ CNY to 408.16×10⁹ CNY and then decreased to 403.19×10⁹ CNY, with a small overall increase of 0.20%. The value of regulating services (RS), supporting services (SS), and cultural services (CS) increased and the value of SS decreased from 2000 to 2018. The value of all four services increased during 2000-2010, with PS showing the largest increase of 5.26%, while the value of all four services showed a decreasing trend during 2010-2018.
Of the second-class types of services, seven types of services showed a decreasing trend in ESV during 2000-2018, and only four services received an increase in ESV. The service with the largest decrease was soil conservation, which fell by 1.77%. Water provision services (WSS) rose rapidly, rising by 22.03%. The increase in all of the above services was due to the rise in the total volume of water, which increased the island-wide ESV. From 2000 to 2010, 6 types of ESV rose, with WSS and hydrological regulation services (HRS) increasing faster, rising by 648 million and 4,798 million respectively. Between 2010 and 2018, all 11 types of ESV showed a declining trend, due to the implementation of the International Tourism Island Policy, with the expansion of construction land occupying arable land, forest, and water, which has led to a decrease in ESV across the island.
Hainan Island was divided into 13,746 hexagonal grids by ArcGIS and the ESV of each grid cell was calculated. The ESV results were then classified into 5 classes using natural breaks classification (Fig. 2): extremely low ESV(0-121.22×10⁸ CNY), low ESV(121.23×10⁸- 224.44×10⁸ CNY), medium ESV(224.45×10⁸-318.36×10⁸ CNY), high ESV(318.37×10⁸-462.05×10⁸ CNY) and extremely high ESV(462.06×10⁸-700.85×10⁸ CNY).
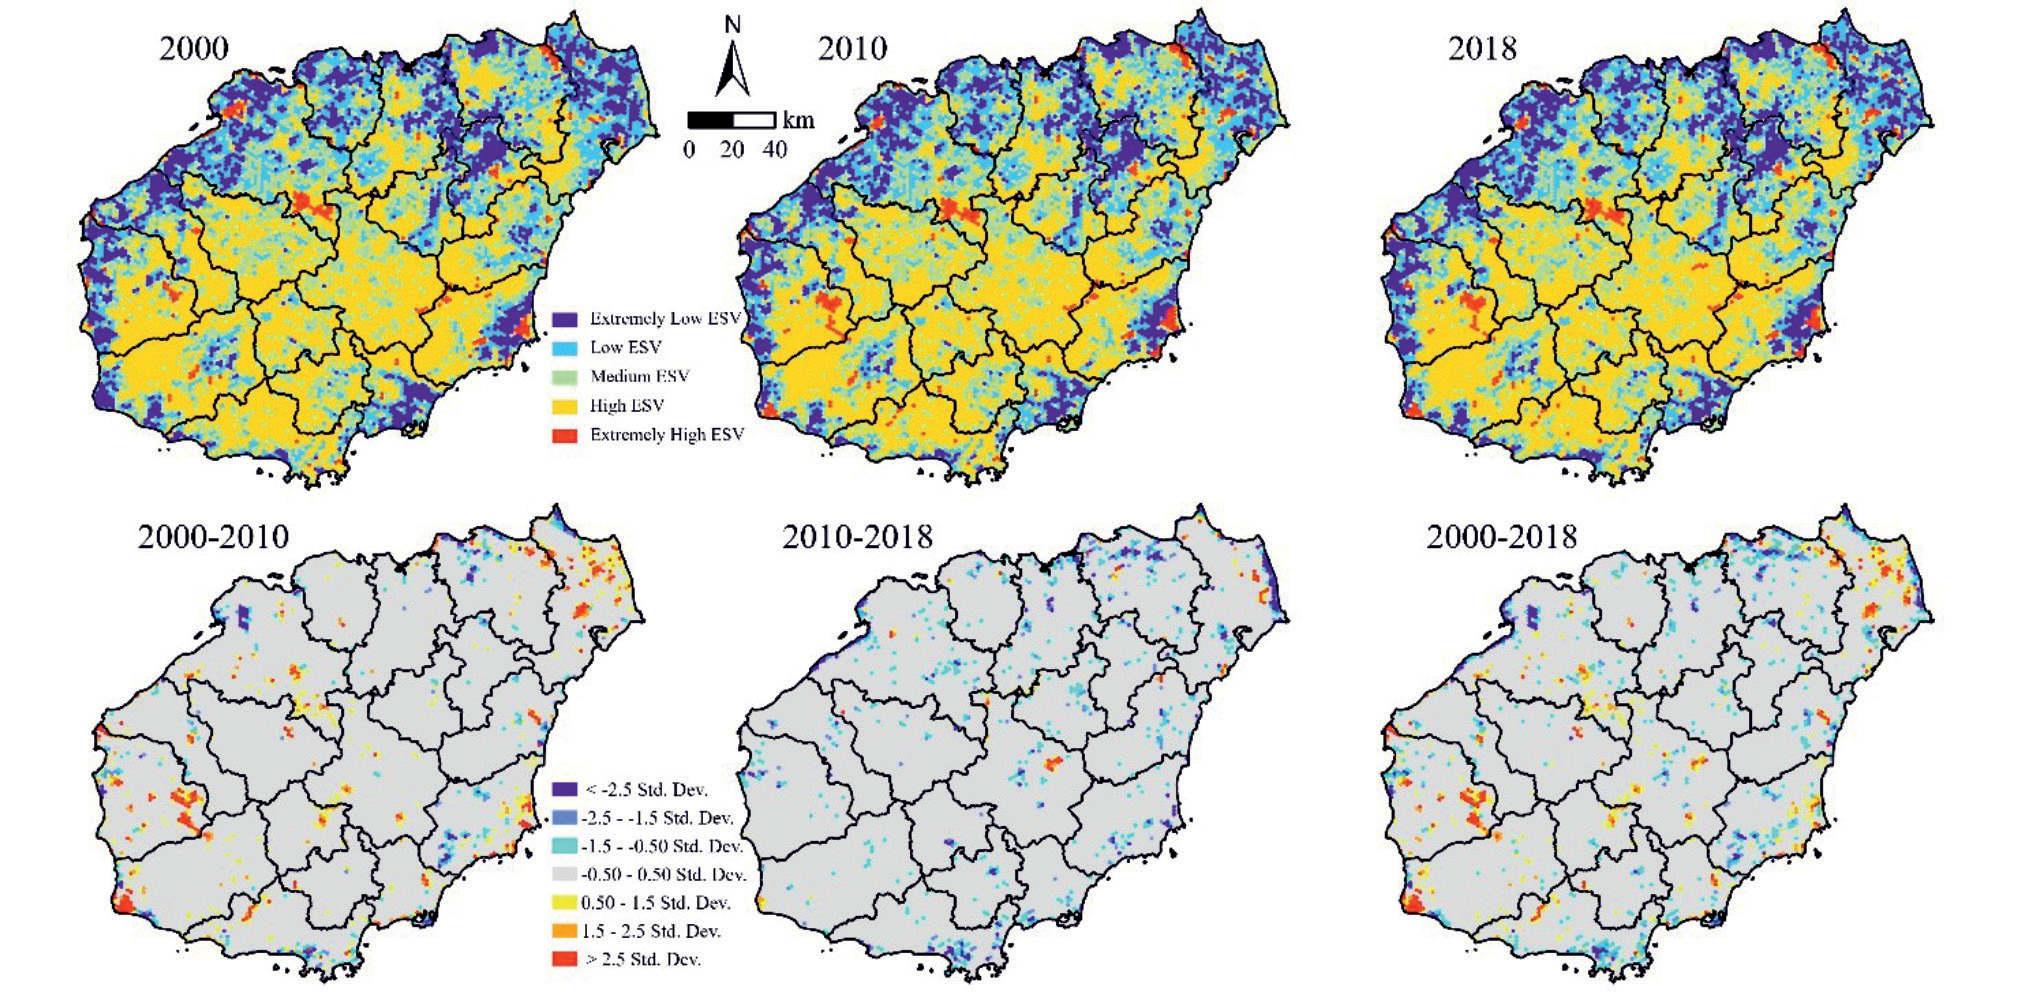
Spatially, the ESV of Hainan Island showed a distribution characteristic of high in the central part and low in the surrounding area. This was more related to the topography of Hainan Island. The central area was high in elevation, with a concentrated distribution of forested land and less impact from human activities, and was the core area of ecosystem service functions, so the ESV was higher; the surrounding area of Hainan Island was flat, with high intensity of human activities and mainly distributed with arable land and towns, so the ESV was lower.
The changes in ESV during 2000-2018 were calculated with the classification criterion of standard deviation. It was found that the ESV increase areas were mainly distributed in the middle and east of Wenchang City and the east of Dongfang City. It was caused by the protection of the water surface of pits and reservoirs, thus complementing the increase of ESV.
Trade-Off and Synergy Relationship of ESV in Hainan Island
Studies have proved that correlation coefficients are more suitable for long-time series data analysis [39], so in this paper, correlation coefficients were chosen to assess the association between the four primary classes of ESVs, and ESTD was used to calculate the relationship between the second-class ESVs.
The results of Spearman’s bivariate correlation coefficient analysis (by Kolmogorov-Smirnov normality test) for the four primary classes of ESVs from 2000- 2018 was described in Table 5 (by Kolmogorov-Smirnov normality test).
There was a significant synergistic relationship between all ESVs, indicating that the synergies were the dominant relationship. The strength of the relationship between them in descending order was: RS-CS>PS-CS>PS-RS>RS-SS>SS-CS>PS-SS.
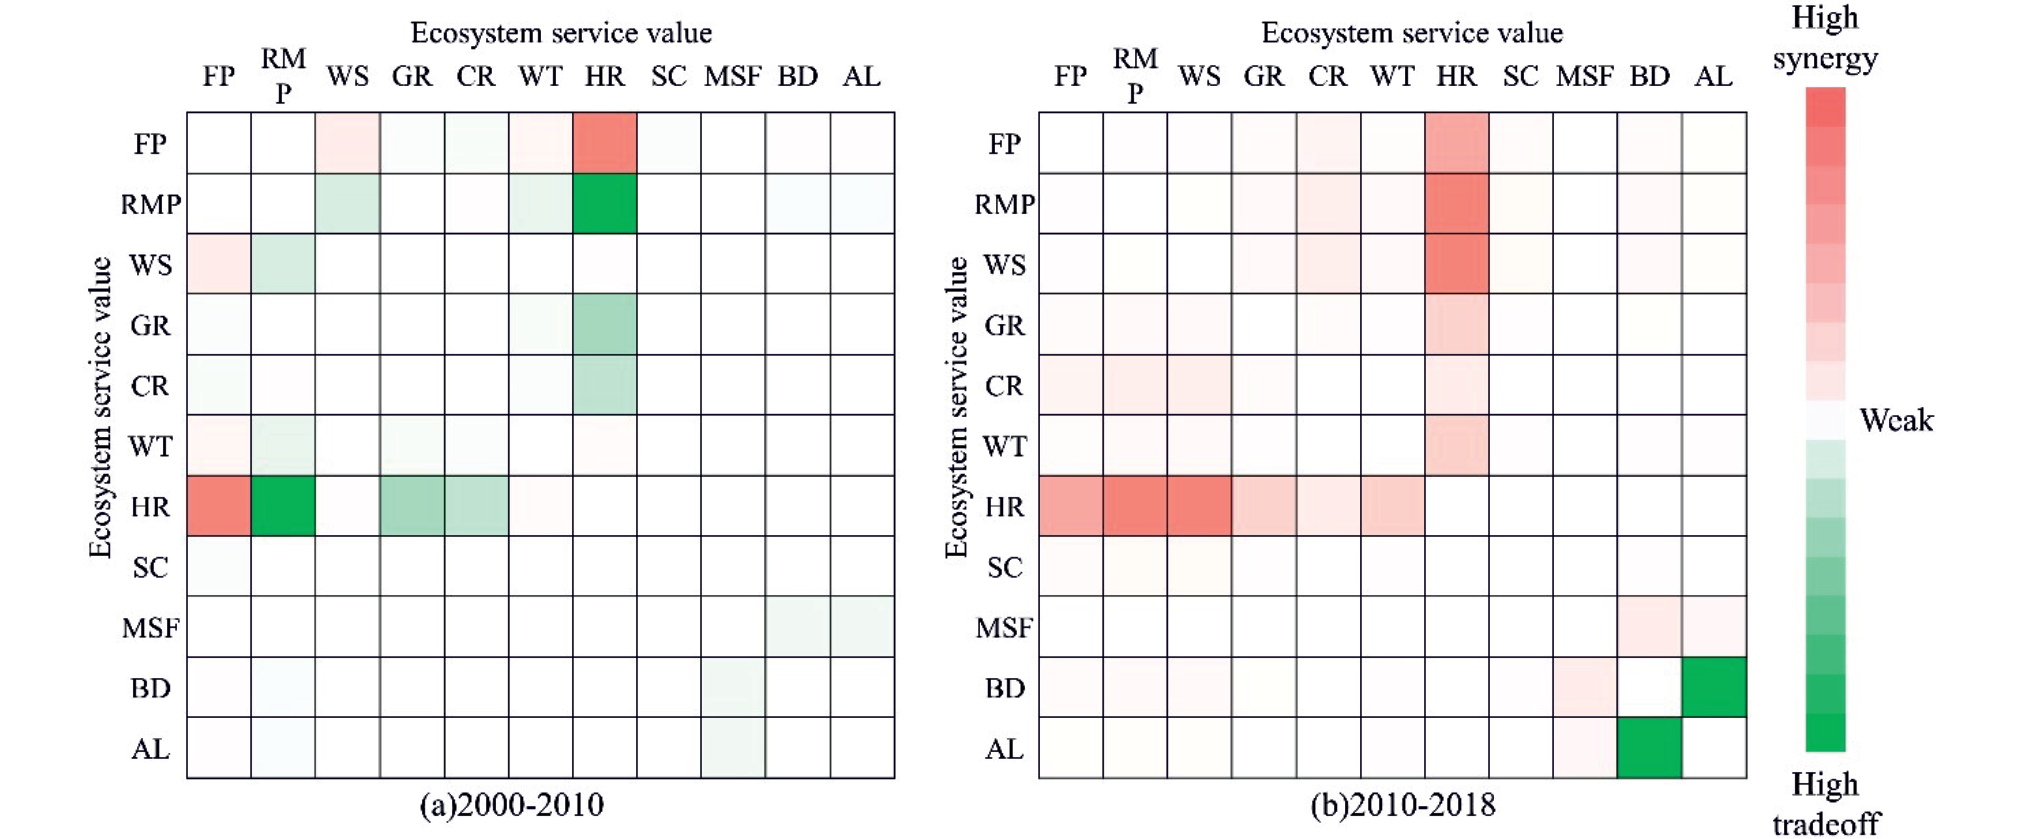
Based on ESTD, we analyzed the trade-off/synergy relationships among 11 second-class ecosystem services in the periods of 2000-2010 and 2010-2018, and the island-wide ESV trade-off-synergistic relationships consisted of 55 sets of values in each period, and the results are shown in Fig. 3.
Trade-off relationships were dominant across the island during 2000-2010, with the highest trade-off occurring between raw material production service (RMPS) and HRS. Among the synergistic relationships, food production services (FPS) had a high degree of synergy with HRS and WSS, at 400.62 and 54.08 respectively. The period 2010-2018 was dominated by synergistic relationships between the functions, with the highest value of synergy occurring between HRS and RMPS (60.83), followed by the synergy between HRS services and WSS (60.65). Overall, a shift from tradeoffs to synergies between ecosystem services on Hainan Island occurred between 2000-2018.
Table 5.
Correlation coefficients between first-class ESVs in Hainan Island from 2000 to 2018.
| Spearman | Provisioning service | Regulating service | Supporting service | Cultural service |
|---|---|---|---|---|
| Provisioning service | 1 | |||
| Regulating service | 0.879** | 1 | ||
| Supporting service | 0.703** | 0.840** | 1 | |
| Cultural service | 0.901** | 0.985** | 0.837** | 1 |
In this paper, a bivariate spatial autocorrelation analysis was conducted based on a hexagonal grid to explore the spatial characteristics of trade-off synergies among ecosystem services in Hainan Island.
The spatial synergy relationships were distributed as “High-High (HH)” and “Low-Low (LL)” clusters, representing “positive synergy” and “negative synergy” respectively. The spatial trade-offs were expressed as “High-High” and “Low-Low” clusters, representing “positive synergy” and “negative synergy” respectively.
As can be seen from Fig. 4, the spatial heterogeneity of trade-off/synergy relationships between ecosystem services was significant.
From 2000 to 2018, the number of grids of tradeoffs between PS and RS (Fig. 4(a-c)) and CS decreased from 5220 to 5066, due to the decline in the amount of arable land and the reduction of provisioning services, weakening their contradiction with ecological regulation functions and aesthetic landscapes.
The number of trade-off grids between provisioning services (PS) and support services (SS) increased from 6011 to 6031 and then decreased to 5938, mainly due to the trend of increasing and then decreasing water resources in the study area, which affects the trade-off between water provisioning service and biodiversity maintenance function.
RS, SS, and CS, which were dominated by synergy, were mainly distributed in the central mountainous areas of Hainan Island, indicating that the central mountainous region of Hainan Island played a pivotal role in ensuring the ecological security of Hainan Island.
From 2000 to 2018, the positive synergy relationships between RS, SS, and CS across the island shifted from a weakening to an increasing trend. As the central mountainous region was identified as a national key ecological function area in 2010, the overall service capacity of the ecosystem was enhanced thanks to ecological protection policies.
The negative synergy (LL) relationships between the various ESs were all located in flat areas such as the coastal and northeastern regions around Hainan Island, where the intensity of human activity was greater and the degree of agricultural development and urbanization is higher.
Simulation of ESV Trade-Off/Synergy Relationship in Multiple Scenarios
The results of the multi-scenario simulation reveal that the total ESV in 2034 under ND, ED, and EP scenarios is expected to be 396.12×10⁹ CNY, 393.53×10⁹ CNY, and 412.75×10⁹ CNY respectively. The strict ecological protection policies under the EP scenario enhance the total amount of forest and water in the study area, and the ESV is greater than that in 2018 and the highest among the scenarios, indicating that the scenario setting that considers the ecological environment is beneficial to the sustainable management and enhancement of ecological service functions.
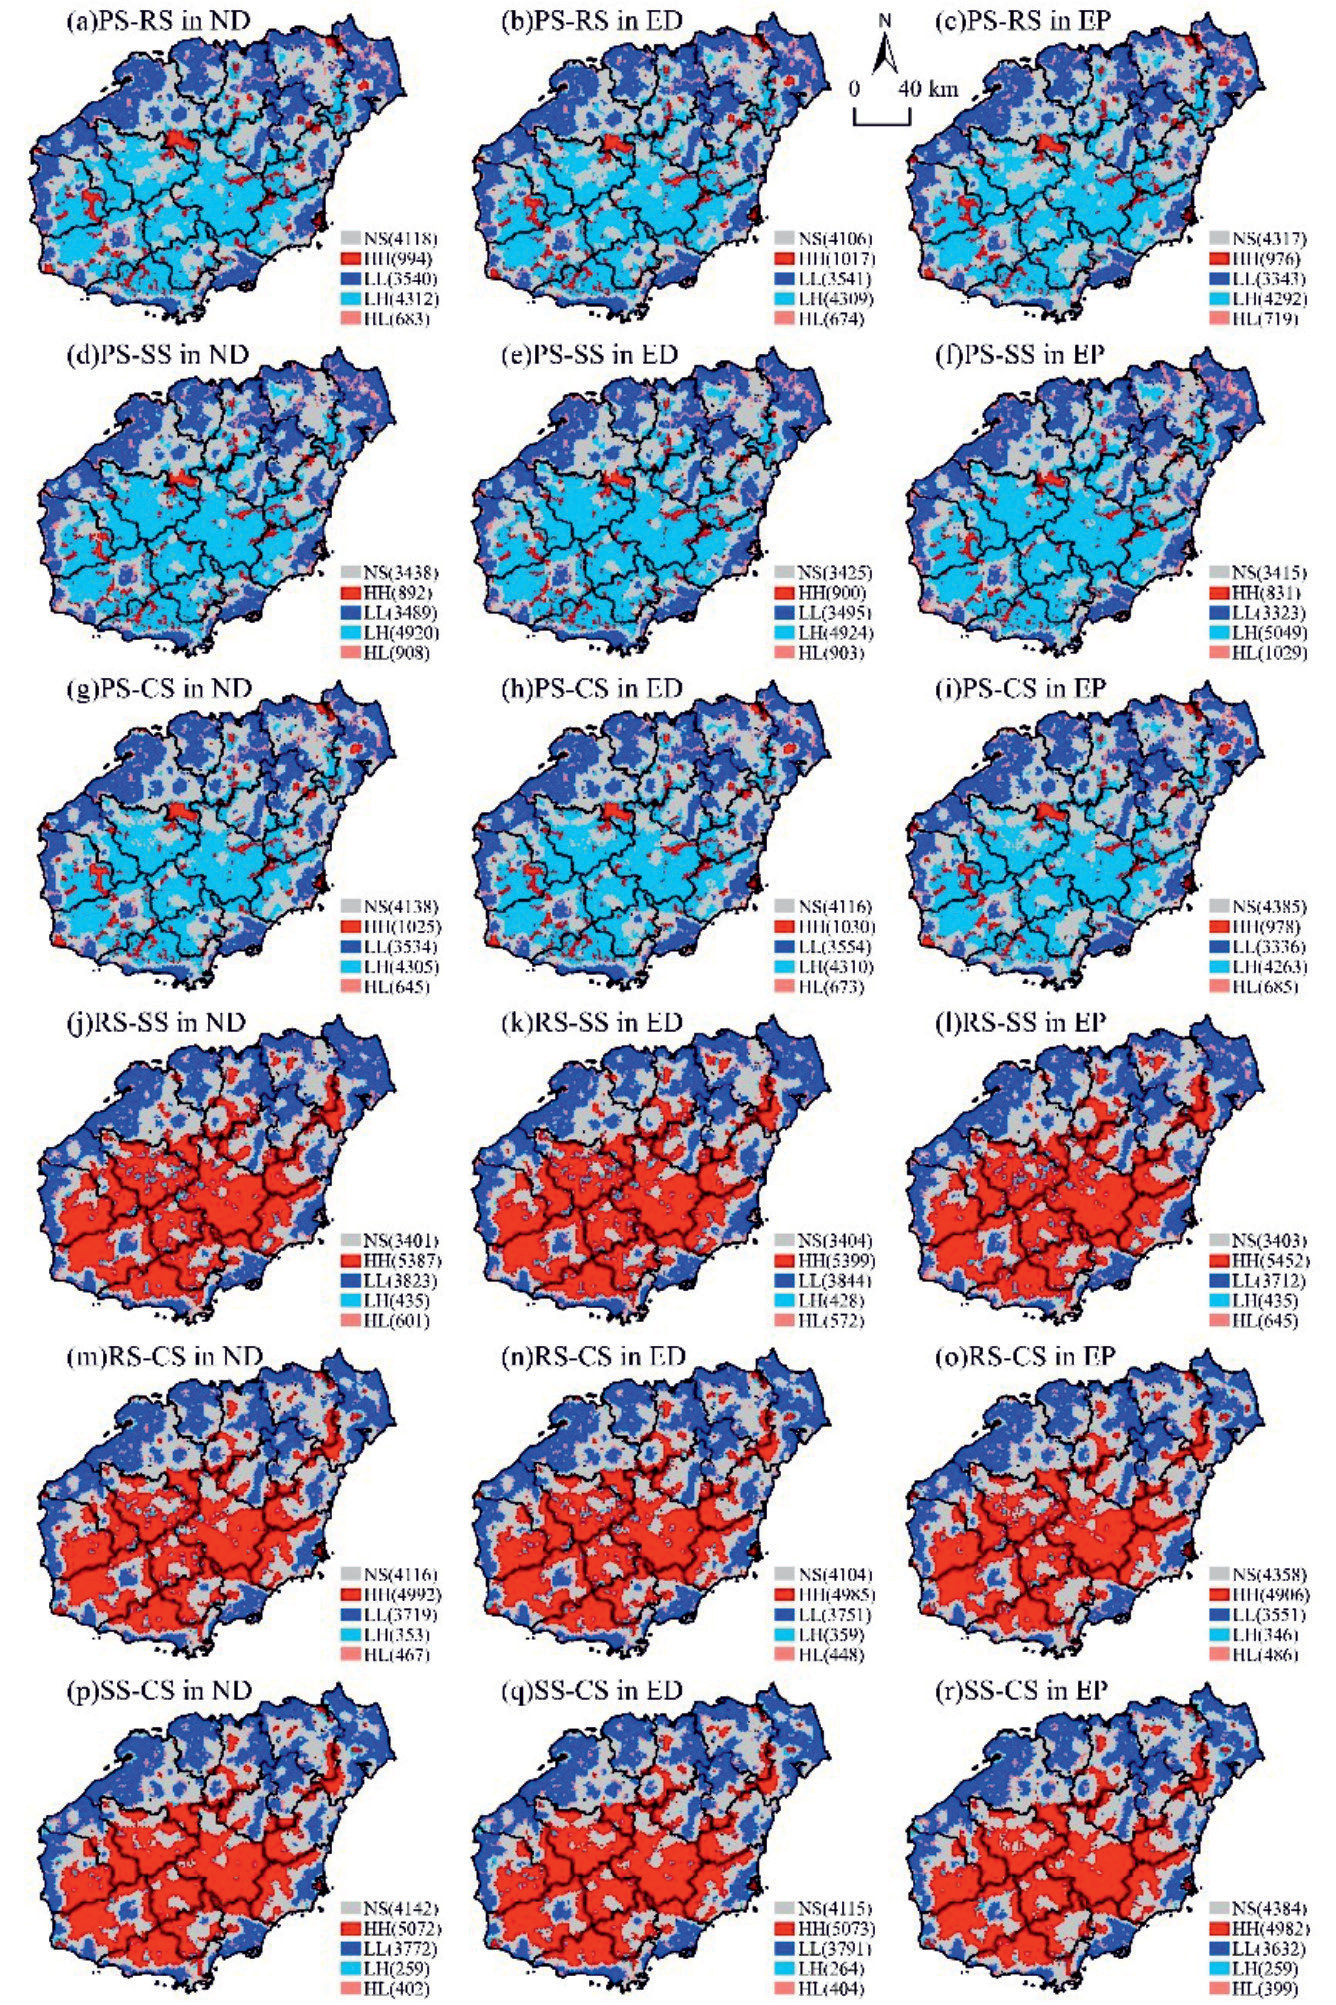
The spatial pattern of trade-offs/synergies of ecological service functions on Hainan Island in the three scenarios in 2034 is consistent with 2000- 2018.
Among them, the PS and RS, SS and CS are dominated by trade-off relationships (Fig. 5 (a-i)). The ED scenario has the lowest number of trade-off grids, which is lower than the number of grids in the ND and EP scenarios. The main reason for this is that the decline in the amount of arable land in the ED scenario weakens the trade-offs between the PS and the rest of the services.
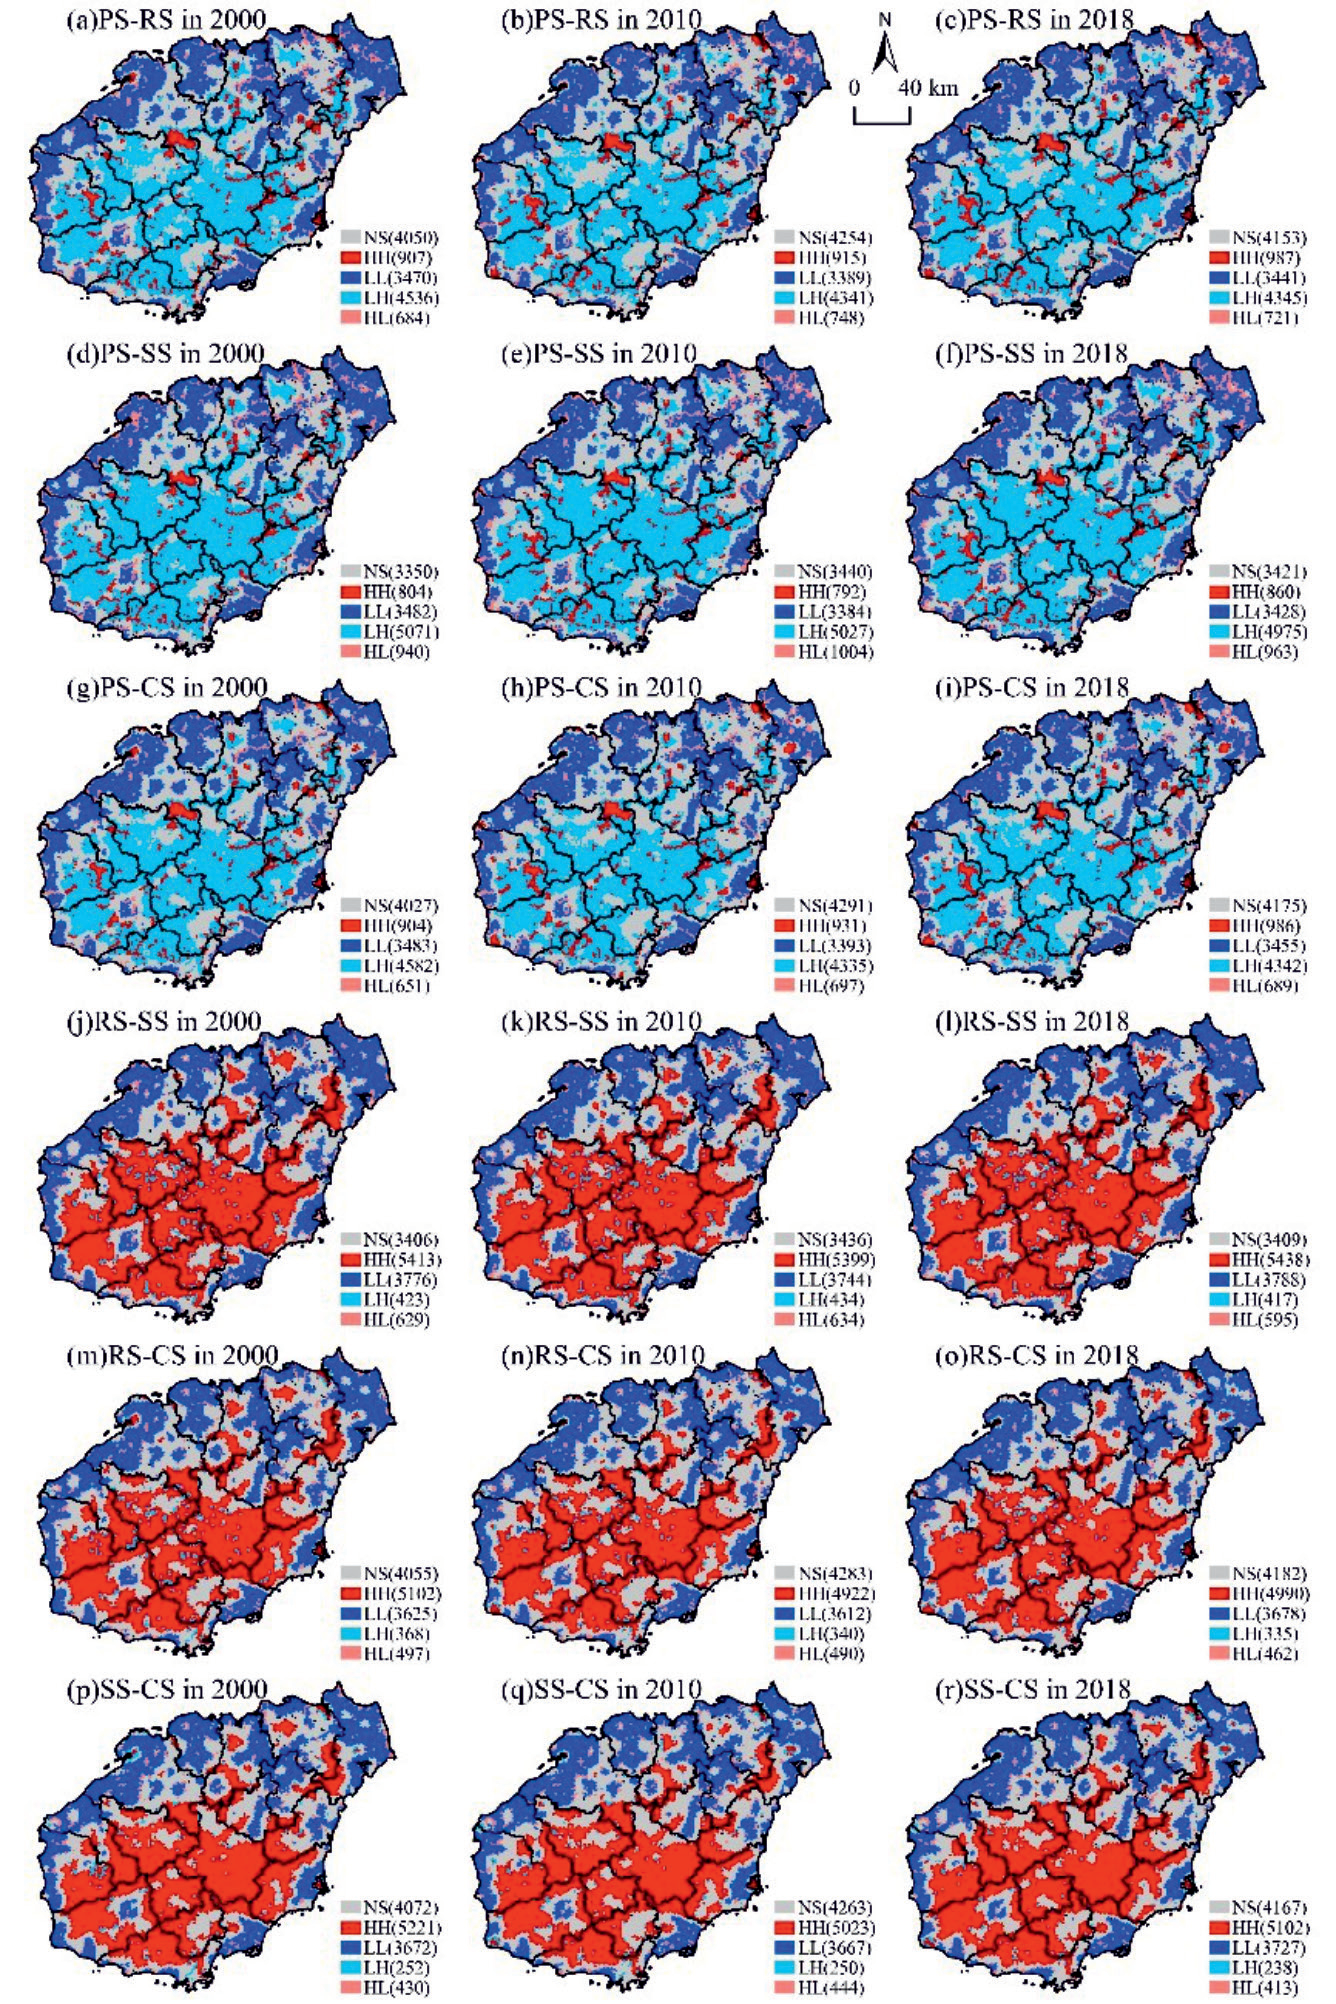
The three types of services RS, SS, and CS are dominated by synergistic relationships (Fig. 5(j-r)), with the ED scenario having the highest number of synergy relationships and mainly positive synergies.
Overall, of the three scenarios, the ED scenario has the least number of trade-offs between PS and the remaining three services, while the RS, SS, and CS have the most synergistic relationships, demonstrating the economic-ecological synergy of Hainan Island, indicating that the island’s good ecological background is capable of carrying economic development.
Discussions
Spatial and Temporal Variation of ESV in Response to LUCC
In this paper, based on the revised unit area value equivalent factor method, the ESV of Hainan Island from 2000-2018 was assessed, and the accounting results were 186.598-192.112×10⁹ CNY, which is closer to the assessment results of 203.588-215.339×10⁹ CNY calculated by Zhiyun Ouyang et al. [40] using the unit service function price method.
Since there are many subjective factors in ESV evaluation, different evaluation methods and parameters make the evaluation results vary, so the evaluation value results are not absolute. However, land use changes will inevitably cause changes in ecosystem function, Therefore, the spatial and temporal change characteristics of ESVs based on this quantitative reflection are reliable and valid.
Fig. 5.
Bivariate local spatial autocorrelation distribution among first-class ESVs in ND, ED and EP scenarios.
During 2000-2018, the ESV on Hainan Island experienced a change from rising to declining. The main reason for the increase in ESV from 2000 to 2010 was due to the increase in the water area, which compensated for the loss of ESV caused by the expansion of construction land, indicating the importance of water conservation for the ecosystem function of tropical islands. Therefore, it is necessary to focus on the ecological protection and management of the major rivers of Hainan Island such as the Nandu River, Changhua River, and Wanquan River to continuously improve the ecological quality of the watershed.
The decrease in ESV from 2010 to 2018 was mainly attributed to the loss of ESVs due to the implementation of Hainan’s international tourism island policy in 2010, which led to rapid economic development, expansion of towns in coastal areas, and increased intensity of human activities result in the loss of ESV [16]. Therefore, it is necessary to reasonably control the scale of urban expansion, improve the efficiency of urban land use, and advocate the construction of green infrastructure [41], to avoid the decline of ecosystem services caused by urban expansion disorderly.
Trade-Off/Synergy of ESs in Hainan Islands
During 2000-2018, a shift from trade-off to synergistic relationships occurred between ESs on Hainan Island. The most significant change is the shift from a trade-off relationship between RMPS and HRS services in 2000-2010 to a synergistic relationship in 2010-2018, with the reason for the change mainly due to the increase in agricultural water resources efficiency. This demonstrates the vulnerability of island ecosystems and the fact that human production activities can profoundly affect the trade-off and synergistic relationships between ecosystem services. Also, unlike other regions that have maintained trade-off relationships for many years [42, 43], this shift between ESs on Hainan Island reflects the geographical variability and ecological resilience of tropical islands.
The negative synergistic relationships of ecosystem services on Hainan Island were distributed in coastal areas, where the intensity of human activities was high due to the geographical and economic location advantages of these areas, which in turn intensifies the disturbance of ecosystem services. In the absence of effective identification of thresholds for shifting between ecosystem service trade-offs and synergies, the increasing urbanization driven by economic growth is likely to bring irreversible damage to island ecosystems. Since negative synergy is the least desirable state of ecosystem services, there is an urgent need for government policies to intervene to promote the positive transformation of negative synergy. Therefore, it is necessary to build a regional ecological security pattern, scientifically delineate urban development boundaries and ecological red lines, strictly control urban disorderly expansion, and adhere to economic-ecological sustainable development.
For the central part of Hainan Island presented the PS and RS, SS, and CS appear as trade-off relationships, on the one hand, we should strengthen the management of the central ecological zone, and enhance the supply capacity of RS, SS, and CS to alleviate the strong tradeoff relationship between PS and these services; On the other hand, we should also implement ecological restoration measures and improve the ecologically sustainable management mechanism by the local actual situation, to reduce the overall conflict between services and promote the transformation of trade-offs to synergy. At the same time, the central mountainous region of Hainan Island, as a nationally important ecological function area, has a well-protected ecological environment. The positive synergistic relationship among RS, SS, and CS was distributed by aggregation characteristics. Therefore, the future development process should continue to consolidate and strengthen the protection of the national key ecological function area in the central mountainous region. Meanwhile, the human-land conflict should be reduced in the region by constructing a reasonable ecological protection compensation mechanism. It contributes to maintaining and enhancing the stability of the ecosystem function in the central mountainous region.
The three scenarios set up in this paper depict the land use pattern of Hainan Island under different policy drivers, reflecting the differences in the impacts of different development paths on the ecosystem service of Hainan Island. The results of the trade-off and synergy analysis validate that the ED scenario is an ecological-economic sustainable development path for the future development of Hainan Island. It is worth noting that the ED scenario needs to promote green and low-carbon cities as well as the management and restoration of regional ecology due to the depletion of ecological services caused by the construction of towns and cities.
Limitations and Future Research
This study used the value equivalence method to estimate the value of ecosystem services on Hainan Island by correcting for the actual conditions on the island. However, as Hainan Island is a land-sea interface ecosystem, the assessment results may differ from the actual value, and this difference affects the ESV tradeoff synergistic evaluation. Therefore, how to combine regional characteristics to improve the accuracy of research value values is an important research direction.
In this paper, we have only explored the influence mechanism of ESVs from the perspective of land use change, but climate change is also an important factor affecting ESVs [8]. Therefore, the study of the influence of climate factors on ES trade-off relationships is also a focus of the next research.
Furthermore, due to the differences in the tradeoff and synergy relationships of ecosystem services at different scales, this paper has not been able to fully consider the impact studies due to scale effects. Future trade-off management needs to consider multi-scale spatial studies of ecosystem service effects, which will contribute to scientific and efficient ecologically sustainable management.
Conclusions
As the only tropical island in China and a biodiversity hotspot, a scientific understanding of the trade-offs/ synergies between ecosystem services on Hainan Island was a prerequisite for sustainable ecosystem management and biodiversity conservation. This study quantitatively assessed the ESV trade-off/synergy in Hainan Island from 2000 to 2018, and simulated the ESV trade-off/synergy under different land use change scenarios, with the aim of providing scientific recommendations for the sustainable development of ecosystems in tropical islands. The main findings are as follows:
(1) The ESV of Hainan Island showed a spatial distribution pattern of high in the middle and low around, and the overall ESV showed a decreasing trend from 2000-2018. In 2000-2010, the ESV increased from 402.369 billion CNY to 408.162 billion CNY, and the increased regions were mainly located in the middle and east of Wenchang City and the east of Dongfang City; In 2010-2018, the ESV decreased to 403.190 billion CNY, and the decreased regions were mainly concentrated in the urban areas along the coast. Studies have shown that in order to maintain the value of ecosystem services on Hainan Island, the intensity and scope of human activities should be rationally controlled and water resources should be effectively protected.
(2) Among the ecosystem services, the tradeoff relationship between provisioning and regulating services, supporting and cultural services was dominant, while the synergy relationship between regulating, supporting, and cultural services was dominant. Synergy relationship was dominant among ecosystem services in Hainan Island. The relationship of ESV experienced a shift from trade-off to synergy during 2000-2018 in Hainan Island. Due to regional heterogeneity, different strategies are needed to promote synergies between ecosystem services in the central mountainous and coastal areas of Hainan Island.
(3) Based on the three scenarios of ND,ED and EP, the ES trade-off/synergy relationship of Hainan Island in 2034 were simulated, and the results showed that among the three scenarios, the ED scenario had the lowest number of trade-off relationships and the highest number of synergistic relationships, which indicated that the ED scenario was a more suitable model for the socio-ecological sustainable development of Hainan Island, and that although Hainan Island has a good ecological base, it still needs to pay attention to ecological restoration and management while developing the economy. In addition, future research needs to further strengthen the ecosystem service thresholds and climate impacts.

