

Introduction
With the rapid development of industrial society, environmental pollution, climate change, ecological damage and other issues have become serious challenges. The Chinese government attaches great importance to environmental pollution control and has successively issued a series of central and local policies. In 2020, the Chinese government clearly put forward the strategic goal of “achieving carbon peak by 2030 and carbon neutrality by 2060”. Since the reform and opening up for more than 40 years, China’s industrial scale has achieved rapid growth, but it has the extensive characteristics of high pollution, high energy consumption and high investment. According to the statistical data in the China Environmental Statistics Yearbook 2021, in 2020, China’s industrial carbon dioxide, nitrogen oxide and particulate matter emissions were 2531511 tons, 4174959 tons and 4009413 tons respectively. The particulate matter emission from coal mining and washing industry is as high as 718610 tons, and the sulfur dioxide emission from oil and gas mining industry is as high as 11235 tons. The particulate matter emission of nonferrous metal mining and dressing industry is up to 322964 tons. Therefore, vigorously developing green and emerging industries has become a key area of China’s economic transformation. Cultural industry has the characteristics of green and environmental protection, and has become an important aspect of China’s industrial supply side reform.
The cultural industry is different from the traditional polluting industry and has the typical characteristics of low emission, low energy consumption and low emission. According to the “14th five year plan” for the development of cultural industry, from 2015 to 2019, the growth value of the cultural industry increased from 2.7 trillion yuan to 4.4 trillion yuan, achieving an average annual growth of 13%, which plays an important role in promoting the green development of national industry. With the rise of computer technology and mobile Internet technology, the cultural industry has been deeply integrated with emerging technologies such as intelligent 5 g, big data, virtual technology and cloud computing, and new formats such as live performance, digital entertainment and online art have been cultivated, greatly reducing the waste of resources and achieving sustainable economic and social growth.
In recent years, with the vigorous development of the cultural industry, scholars at home and abroad have carried out a series of studies on the high-quality development, spatial agglomeration, transformation and upgrading of the cultural industry. Luo (2022) analyzed the problems existing in the digital culture industry, such as regional imbalance, unfamiliar mode, and lack of talents, and proposed to improve it from the perspective of supply and demand interaction and factor optimization [1]. Ding (2021) constructed a coupling synergy model to measure the high-quality development level of China’s cultural industry, and found that there is a ladder decreasing pattern in the East and west regions [2]. Zhang (2023) deconstructed the high-quality development of the cultural industry from the perspective of technological logic, and analyzed the evolution trend of production change, format change and spatial change [3]. Pang et al. (2022) believed that the complex international environment, fierce market competition and slowing cultural demand had an impact on the development of the cultural industry. Through the interaction of supply and demand, promoting the rise of the industrial chain and accelerating the digital transformation were effective improvement directions [4]. Huang et al. (2022) cultural industry agglomeration has an important impact on the efficiency of cultural industry. Through empirical research on time and space dimensions, this paper discusses the mechanism between the two [5]. Feng et al. (2021) conducted a special study on the spatial spillover efficiency of China’s cultural industry and found that its spatial distribution has changed from “dispersion” to “polarization”, and it is necessary to optimize it by increasing financial support and attracting talent resources [6]. Hou et al. (2023) considered the relationship between carbon intensity and industrial agglomeration. Through the analysis of panel data of 283 prefecture level cities, they found that the relationship between carbon intensity and industrial collaborative agglomeration presented an inverted “U” relationship [7]. Dong et al. (2022) analyzed the coupling and synergy between the cultural industry and the tourism industry. Through empirical analysis, they found that they have the characteristics of spatio-temporal differentiation [8]. Huang et al. (2021) used the dynamic panel regression model to analyze the digital transformation of the cultural industry [9]. Zhou and Tan (2022) used fsqca method to explore the high-quality mechanism of digital culture industry, and proposed a configuration path based on the optimization of organizational structure and infrastructure [9].
In addition, focusing on the research on the innovation efficiency of cultural industry, foreign scholars pay more attention to the solution of theoretical methods, while domestic scholars have made in-depth analysis on empirical research. Afriat (1972) first put forward the concept of technological innovation, mainly analyzing the technical effectiveness from the perspective of input and output [10]. The measurement methods of innovation efficiency mainly include parametric and nonparametric estimation. On the one hand, Aiger et al. (1977) and MEEUSEN et al. (1977) proposed the stochastic frontier model (SFA) method for parameter estimation [11, 12]. Zheng et al. (2018) constructed the water efficiency index and its influencing factors using SFA method [13]. Orea and Wall (2017) used the SFA model to analyze the ecological efficiency in the field of agricultural production [14]. Mehmood et al. (2018) used this method to study the effect of rationing credit on the technical efficiency of dairy farmers [15]. On the other hand, Charnes et al. (1978) proposed a non parametric estimation method of data envelopment analysis (DEA), which does not need to set the parameters specifically and can effectively avoid subjective errors [16]. Borras (2023) constructed a two-stage benevolent DEA model to evaluate efficiency [17]. Koronakos et al. (2022) improved the application of network DEA method in the efficiency calculation of commercial banks [18]. Roudabr et al. (2022) proposed an improved four stage DEA efficiency measurement model and tested it with the data of Tehran stock exchange [19]. Khoveyni (2021) proposed a hyperplane DEA model method for efficiency measurement [20]. Guo et al. (2023) built a super NSBM model to measure the efficiency of urban green R&D [21]. Wei et al. (2023) used the Malmquist Luenberger index method to measure and decompose the regional innovation efficiency [22].
To sum up, domestic scholars have paid high attention to the transformation and upgrading of the cultural industry and high-quality development, but most of the studies have discussed more from the aspects of environment, policy and path, and the methods used are more biased. The measurement method of innovation efficiency has formed a scientific theoretical and methodological system, and a large number of scholars have carried out valuable analysis by collecting panel data. However, studies at home and abroad have analyzed cultural industry and innovation efficiency as two isolated directions. Compared with existing studies, this paper intends to explore the following aspects. The possible innovations are as follows: first, the integration of cultural industry and innovation efficiency, and the evaluation of the static and dynamic efficiency of China’s cultural industry innovation from an empirical perspective, has a unique perspective of innovation. Second, it advocates to use the method of comprehensive evaluation to estimate the efficiency value. This paper plans to comprehensively use the radial super efficiency DEA model and the cross reference Malmquist model to measure the innovation efficiency of cultural industry, and further use the dynamic panel regression model to estimate the impact of environmental factors on efficiency. This study provides empirical evidence for promoting the green and high-quality development of cultural industry.
Materials and Methods
Static Measurement Method of Innovation Efficiency Based on output Oriented CRS Super Efficiency Model
In the data envelopment model, the most classical models are BCC model and CCR model. The model is widely used in the field of efficiency evaluation, but if multiple decision-making units are effective, the efficiency value of these decision-making units is 1. This will make it impossible to compare the efficiency of effective decision-making units. In order to overcome this problem, Andersen and Petersen (1993) proposed a super efficiency DEA model, which removes the evaluated decision-making unit from the reference set, thus allowing the effective efficiency value to be greater than 1.0 [23]. Therefore, in order to avoid the shortcomings of classical DEA, this paper introduces the super efficiency DEA model to measure the innovation efficiency of China’s cultural industry.
Considering the innovation efficiency and paying attention to the results orientation, this paper constructs the super efficiency model of CRS based on the output orientation. Referring to relevant research at home and abroad [23, 24], the model is set as follows:
Step 1: model assumptions: suppose there are k decision-making units, and the number of inputs and outputs of each decision-making unit is m and N respectively. At the same time, the weights of input and output indexes are λi, ηj respectively, where i = 1, 2, ..., m, j = 1, 2, ..., n. Then, the input-output ratio of the decision-making unit can be obtained:
Where, Xki Ykr represent the input and output of decision making unit respectively.
Step 2: by nonlinear dual transformation of the above Equation (1), we can further obtain the super efficiency DEA model expression based on output oriented type as follows:
Step 3: in order to solve the model more conveniently, the relaxation variable of input and output can be introduced to dual transform the model to obtain the following model:
Dynamic Measurement Method of Innovation Efficiency Based on Cross Reference Malmquist Model
Using the super efficiency model to measure the innovation efficiency of cultural industry is mainly analyzed from the static perspective. In order to explore the efficiency changes of different time series, consider the dynamic analysis. Malmquist index model is an effective model for measuring dynamic efficiency. According to the research of Fare et al. (1995), the basic formula of Malmquist index model can be obtained [25]:
(1) A model considering the constant return to scale [26]:
The above equation (4) represents the efficiency change index from period T to (t+1). If M>1, it indicates that the efficiency of the later period has improved compared with the previous period; If M = 1, then the efficiency value has not changed; If M<1, it indicates that the efficiency value is reduced, and there is still room for improvement.
(2) Decomposition formula of Malmquist index model:
(YT+1, XT+1), (YT, XT) respectively refer to the input and output of phase t+1; Similarly, DT+1(XT, YT) and DT(XT+1, YT+1) represent the distance function of stage T and stage t+1 respectively. The formula M(YT+1, XT+1 YT, XT) represents the change rate of technical efficiency,
Construction of Cultural Industry Innovation Efficiency Impact Model Considering Environmental Variables
Using the output oriented CRS super efficiency model and the cross reference Malmquist model can effectively measure the innovation efficiency of China’s cultural industry from both static and dynamic perspectives. However, the innovation efficiency of China’s cultural industry is also affected by a number of external environments, especially in the context of the dual carbon goal, the role of variables such as environmental pollution index needs to be taken into account. With the help of panel regression analysis in econometrics, this paper constructs the variables of external environmental factors, including air pollution, domestic pollution, pollution control, economic situation, social situation, scientific and technological situation, etc.
Referring to the research of relevant scholars at home and abroad [27, 28], the cultural industry innovation efficiency calculated by CRS super efficiency model is selected as the dependent variable, and other external environment variables are selected as the dependent variable to build the following panel regression model:
In the above Equation (6) x1it, x2it, x3it, x4it, x5it, x6it respectively represent the external environmental variables that affect the innovation efficiency of China's cultural industry. μi indicates constant, obeys N(0, σμ2), and ηit indicates random effect.
Index Selection and Data Sources
Index Selection
The innovation activities of China’s cultural industry are a system composed of multiple inputs and outputs. Considering the actual characteristics of the cultural industry, and based on the principles of scientificity and availability of data, this paper mainly considers the innovation investment of the cultural industry based on the C-D production function theory. Referring to the existing domestic research [29, 30], the input indicators are mainly constructed from RD input, internal input and R&D input, and the output indicators are selected from the two dimensions of economic output and scientific and technological output. The index system of input and output is shown in Table 1.
Referring to the research of Sun and Zhang (2019), Wang and Liang (2021) [31, 32], it is necessary to conform to the "separation hypothesis" for the factors of cultural industry innovation efficiency, that is, the environmental variables are objective. Considering the constraints of "double carbon goals" faced by the industry, external environmental factors have an impact on industrial innovation efficiency, and considering the role of social, economic, policy and other macro environmental factors, this paper constructs the index system of the panel regression model. As shown in Table 2, air pollution, domestic pollution and pollution control are considered as primary indicators for control variables, and economic environment, social environment and scientific and technological environment indicators are selected as adjustment variables.
Table 1.
Input output index system of cultural industry innovation efficiency.
Table 2.
Environmental variables affecting the innovation efficiency of cultural industry.
Data Sources
The data in this paper are mainly from the statistical yearbook issued by the National Bureau of statistics of China, in which the index data of the innovation efficiency of the cultural industry is from the statistical yearbook of Chinese culture and related industries (2015-2022). Based on the principles of data reliability, availability, comparability and representativeness, due to the lag of Yearbook statistics, the data period is 2014-2021. The descriptive statistics of input-output index data are shown in Table 3. For environmental variables, considering the stability of the data, the data from 2018 to 2021 are selected for analysis. See Table 4 for relevant statistical analysis.
Results and Discussion
Innovation Efficiency Results of China’s Cultural Industry Based on CRS Super Efficiency Model Super Efficiency Model
Using MaxDea professional statistical software, according to the CRS super efficiency model, the innovation efficiency of China's cultural industry from 2014 to 2021 is measured, and the results are shown in Table 5. According to statistics, the average efficiency of all samples in 8 years is 1.059, which is greater than 1.0, indicating that the overall innovation efficiency of China's cultural industry is high and in an effective state. As China comprehensively promotes the construction of a well-off society and continues to increase investment in the construction of spiritual civilization, the cultural industry has ushered in good opportunities, which has greatly promoted the improvement of the level of industrial innovation. From the specific value analysis, in 2014-2021, Shanghai, Guangxi, Guangdong, Beijing and Hainan.
Table 3.
Descriptive statistics of input-output data.
| Variable | Obs | Mean | STD. dev | Min | Max |
|---|---|---|---|---|---|
| RPD | 216 | 5063.375 | 8175.047 | 1 | 43507 |
| IRF | 216 | 179009.1 | 273713.8 | 19 | 1227324 |
| EPD | 216 | 219297.9 | 368673.4 | 60 | 2133231 |
| RNs | 216 | 3372521 | 5398476 | 447 | 3.06E+07 |
| NIP | 216 | 1393.542 | 2691.326 | 2 | 17268 |
Table 4.
Descriptive statistical analysis of environmental variables.
The innovation efficiency values of these regions are 1.509, 1.517, 1.737, 2.212 and 2.403, respectively, which are greater than 1.5, indicating that these regions' cultural industry innovation level is the highest and in the best state. Meanwhile, the innovation efficiency of cultural industry in Yunnan, Guangzhou, Jiangxi, Liaoning, Henan and Hubei are 0.214, 0.398, 0.449, 0.475, 0.496 and 0.499 respectively, which are all less than 0.5, indicating that the efficiency of these regions needs to be improved urgently and the resource input redundancy is serious. The possible reason is that these regions are due to the lack of cultural resources. For example, Yunnan, Guizhou and Jiangxi belong to the central and western regions, and have disadvantages in resource investment. Therefore, different regions show significant heterogeneity in the innovation efficiency of cultural industry, and it is necessary to take comprehensive measures to achieve the overall efficiency level of cultural industry.
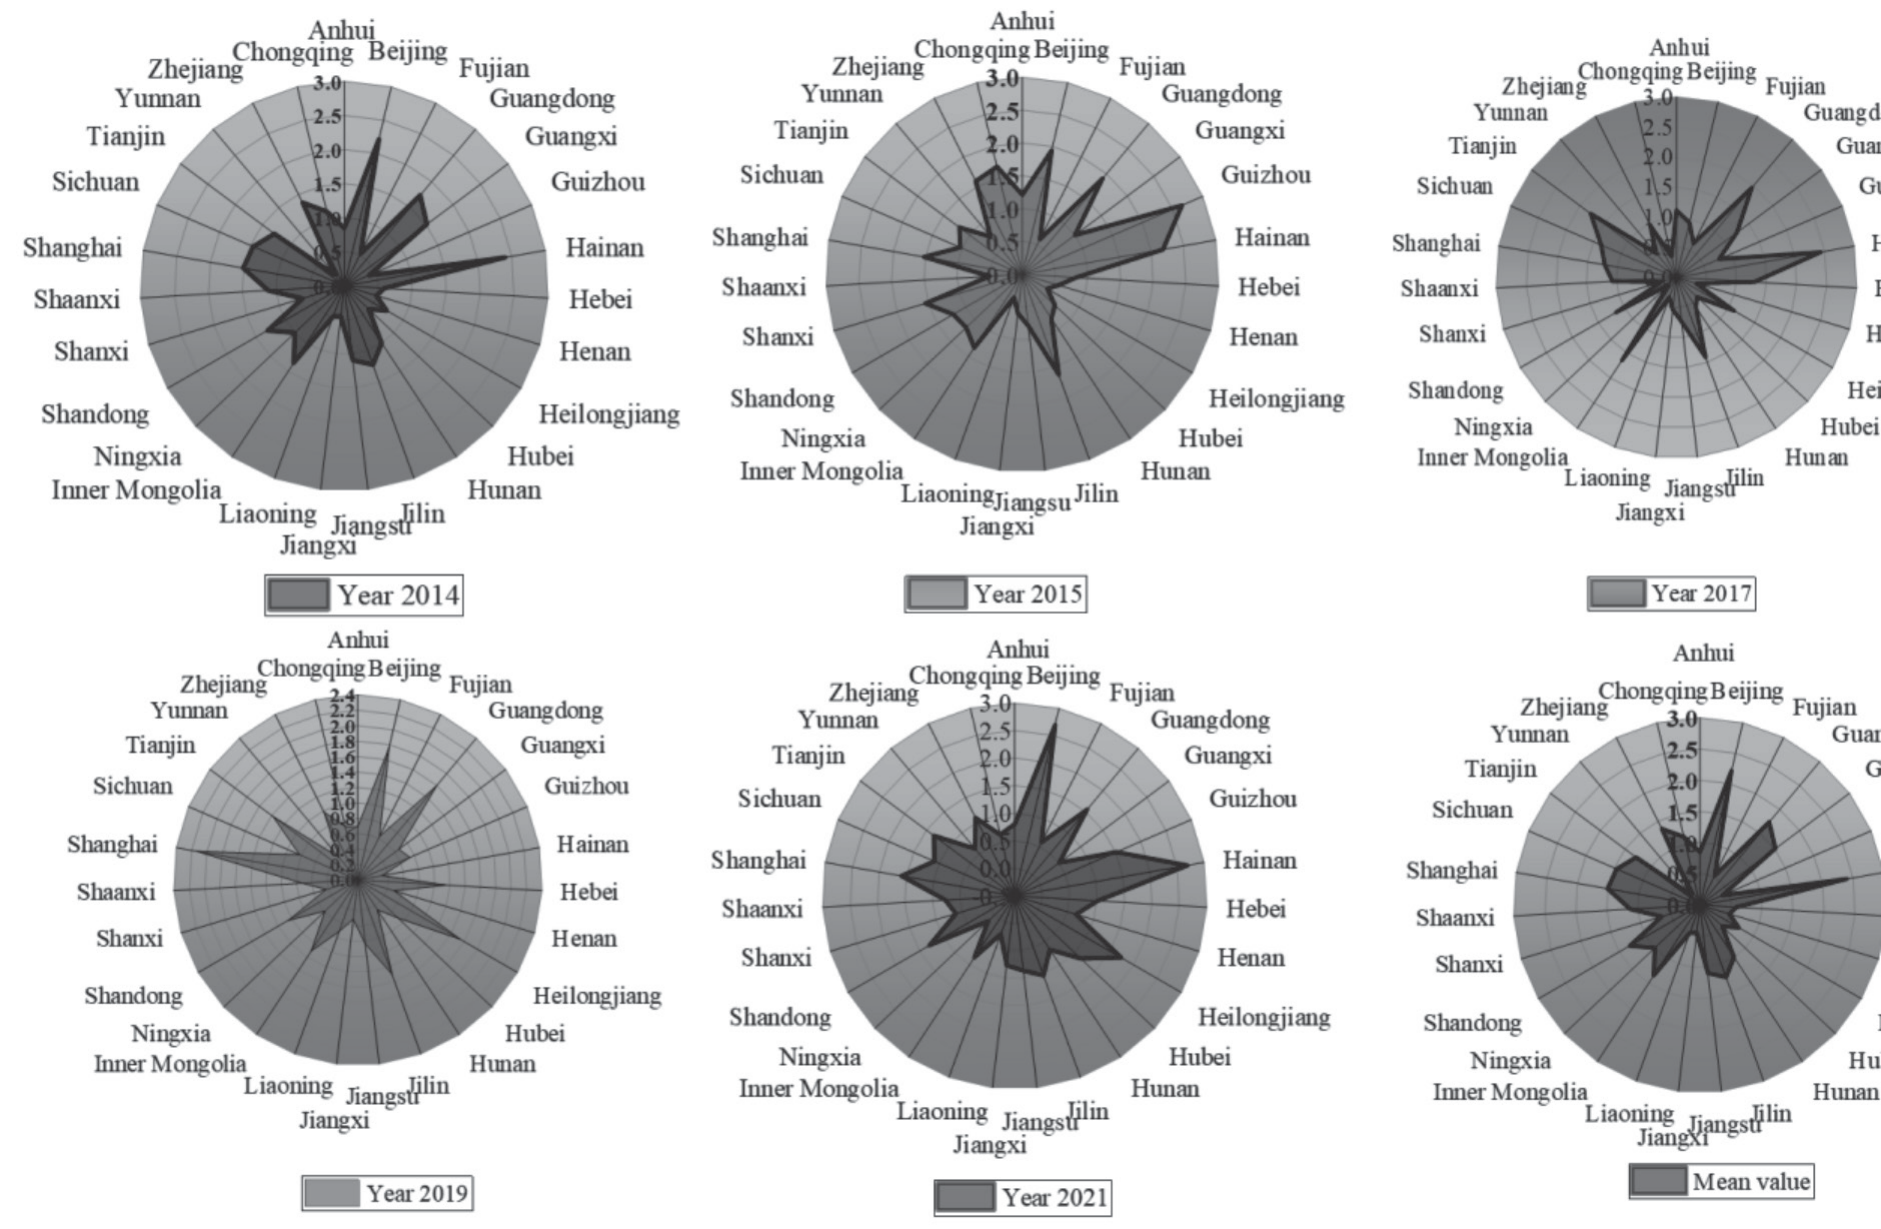
Further, from the perspective of time, as shown in Fig. 1, the average innovation efficiency of the cultural industry in 2014-2021 was 1.059, 1.177, 1.144, 0.982, 0.924, 0.906, 0.938, 1.060 and 1.059, respectively. Although it had time heterogeneity, it maintained a „U-shaped” wave around 1.0 as a whole. In 2014, Shanghai, Guangxi, Guangdong and Beijing have the highest innovation efficiency values of cultural industry, which are 1.509, 1.517, 1.737 and 2.212 respectively. Among them, Shanghai, Guangdong and Beijing are all provinces and cities with the leading economic level in China, which reflects that the innovation efficiency of cultural industry is easily affected by the regional economic level. In 2015, Shanghai, Shanxi, Zhejiang, Jilin, Chongqing, Guangdong, Beijing and Hainan were all greater than 1.5, which were 1.527, 1.546, 1.587, 1.627, 1.685, 1.906, 1.939, respectively and 2.179. Similarly, we can analyze the situation in 2016, 2017, 2018 and 2019. In 2020, Shanghai and Jilin and Guangxi had the highest efficiency values, which were 1.623, 1.814 and 2.116, respectively; Hainan, Ningxia and Hunan have the lowest efficiency values, which are 0.133, 0.318 and 0.408, respectively. The difference between the maximum value and the minimum value is 2.033, showing obvious differences. Finally, from the results of 2021, the efficiency values of Ningxia, Liaoning, Guangxi and Fujian are the lowest, which are 0.168, 0.241, 0.514 and 0.591 respectively, which are all less than 0.6; Guangzhou, Guangdong, Shanghai, Heilongjiang, Beijing and Hainan have the highest efficiency values, which are 1.516, 1.552, 1.597, 1.740, 2.692 and 2.696, respectively. This further shows that the non-equilibrium characteristics of the innovation efficiency of the domestic cultural industry in the region may be caused by the differences in the distribution and spatial focus of the regional cultural industry.
Table 5.
Measurement results of innovation efficiency of China's cultural industry (2014-2021).
Innovation Efficiency Results of China's Cultural Industry Based on Cross Reference Malmquist Model
In order to analyze the dynamic changes of innovation efficiency of different samples in different periods, the Malmquist index model with cross reference is used to obtain the results in Table 2. In the six periods of 2014-2015, 2015-2016, 2016-2017, 2017-2018, 2018-2019, 2019-2020 and 2020-2021, the Malmquist index of China's cultural industry was 1.508, 1.212, 1.049, 1.400, 3.654, 1.070 and 1.696 respectively, which were significantly greater than 1.0, indicating that the overall cultural innovation efficiency of China's cultural industry showed a trend of growth. Especially from 2017 to 2018, the growth rate was the fastest, with the Malmquist index reaching 3.654. The possible reason is that since the 18th National Congress of the Communist Party of China, Chinese governments at all levels have paid more attention to cultural construction, the cultural industry has ushered in good opportunities, and the input and output levels have achieved significant growth.
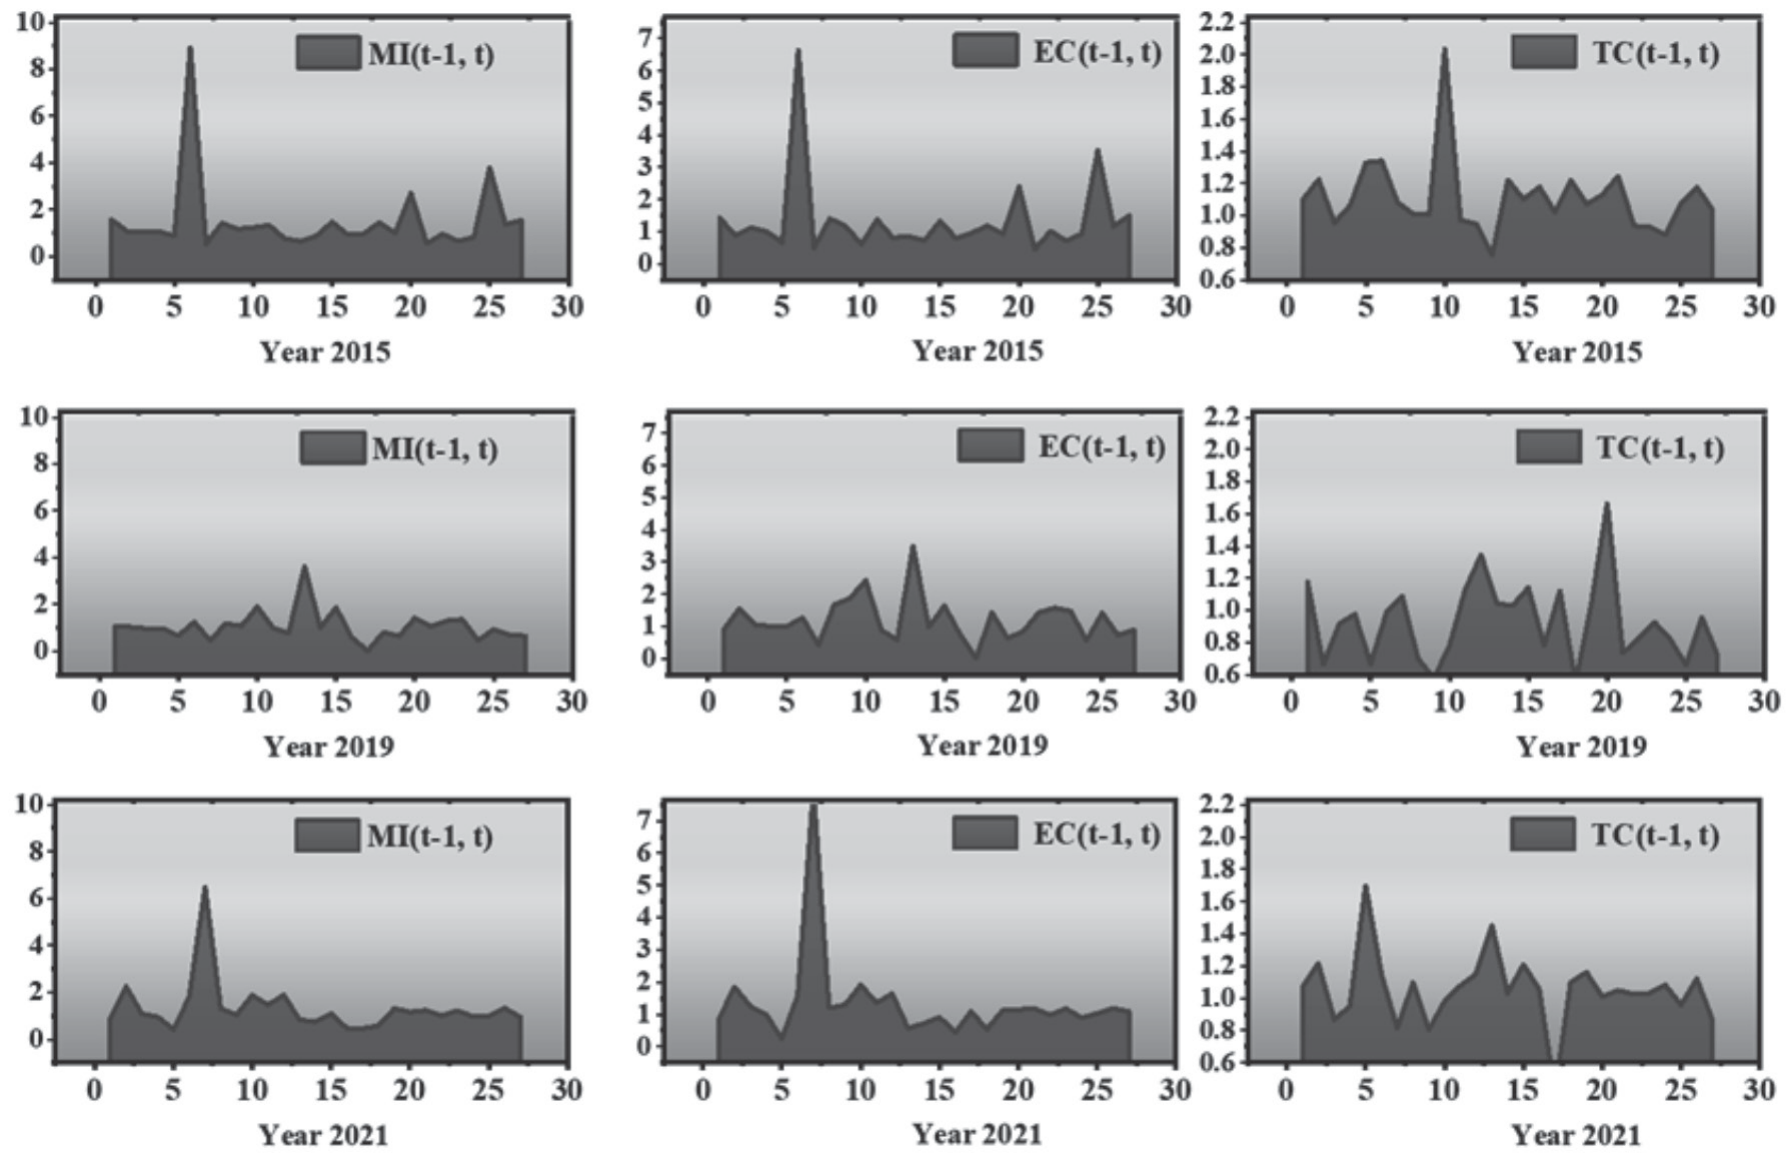
Fig. 2 is a further decomposition of Malmquist index, which decomposes Mi index into the product of scale efficiency (TC) and technical efficiency (TC). In order to comprehensively compare the changes in different periods, the data of 2014-2015 (Fig. 3 indicates 2015), 2018-2019 (Fig. 3 indicates 2019) and 2020-2021 (Fig. 3 indicates 2021) are selected for analysis. From 2014 to 2015, the MI index of the sample population was 1.509, and the EC and TC indexes were 1.334 and 1.112, respectively, showing that ec>tc index. Therefore, the overall efficiency improvement was mainly driven by scale efficiency in 2014-2015. During 2018-2019, the MI index of the sample population was 1.062, and the EC and TC indexes were 1.200 and 0.926, respectively, showing that ec>tc index and still higher scale efficiency, but the technological progress index was less than 1.0, indicating that the level of technology input driven efficiency output decreased. During 2020-2021, the MI index, EC index and TC index are 1.325, 1.340 and 1.053 respectively, which are greater than 1.0, indicating that the innovation efficiency of China's cultural industry has achieved positive growth as a whole, and the scale efficiency and technical efficiency work together to drive the overall efficiency improvement of the production frontier. Finally, through a comprehensive comparison, it can be found that with the advance of time, the MI, EC and TC indexes of China's cultural industry have achieved positive growth, but the overall efficiency is still dominated by scale, which reflects that increasing the efficiency of the industry driven by technological progress has become the direction of future industrial growth.
Results of the Impact of External Environmental Factors on the Innovation Efficiency of China's Cultural Industry
In order to test the impact of environmental factors such as air pollution, domestic pollution and pollution control on the innovation efficiency of China's cultural industry, a panel regression model was constructed for analysis. For the analysis of panel regression model, the common models include random panel model and fixed panel regression model. It is necessary to analyze the applicability of the model before empirical analysis. Table 3 shows the test results of the model. By selecting the super efficiency result value of China's cultural industry as the explained variable, environmental factors as the control variable, and economic, social and technological conditions as the adjustment variables, the panel regression analysis model is constructed. It can be seen from the results that when the F test shows a significant level of 5%, F (26,75) = 3.105, P = 0.000<0.05, it means that the FE model is better than the pool model. Combined with the results of BP test and Hausman test, it can be found that the effect of using random estimation model is better.
Table 6.
Summary of inspection results.
Table 7.
Summary of panel model results.
In order to further explore the impact of environmental factors on the innovation efficiency of China’s cultural industry, this paper mainly analyzes the re model results. As shown in Table 4, SO2, garbage and cpollution all have significant effects on innovation efficiency. The coefficient of SO2 is -0.006, which is significant at the level of 95%, showing a negative impact. This shows that the higher the concentration of sulfur dioxide in the region, the more unfavorable it is to improve the efficiency of cultural innovation. Similarly, garbage’s contribution to cultural innovation efficiency is significant at the 99% level, with a coefficient of -0.003, indicating that the greater the amount of municipal waste treatment, the less conducive to the improvement of cultural industry’s innovation efficiency. The possible reason is that the amount of municipal waste treatment can reflect the degree of urban pollution, and the higher the degree of pollution, the less conducive to the improvement of efficiency. Finally, the influence of cpollution was investigated, and the coefficient was 0.024, which passed the significance test of 1%. This shows that the investment in industrial pollution control has a positive impact on innovation efficiency. The possible explanation is that the greater the investment in pollution control, the more conducive it is to improve the city’s environmental index, and thus to create a green industrial development environment, thereby promoting the efficiency of the cultural industry. In addition, agdp and rprice have significant effects on the innovation efficiency of cultural industry.
Conclusions
Environmental pollution, climate change, ecological damage and other issues have become serious social challenges. In order to control pollution and promote the development of green industries, the Chinese government has vigorously developed green and emerging industries such as the cultural industry, and put forward the strategic goal of “double carbon”. Based on this background, this paper selects China’s provincial cultural industry as the research object to carry out an empirical study on its innovation efficiency and its influencing factors. By selecting the panel data from 2014 to 2021, using the output oriented CRS super efficiency model, cross reference Malmquist model and panel regression model, this paper draws the following conclusions:
(1) The innovation efficiency of cultural industry in different regions of China has typical temporal and spatial heterogeneity. From the perspective of time, from 2014 to 2021, the average innovation efficiency of China’s cultural industry was 1.059, 1.177, 1.144, 0.982, 0.924, 0.906, 0.938, 1.060 and 1.059, respectively, although with time heterogeneity. From the spatial dimension, the average efficiency of Beijing Tianjin Hebei region is 1.360, that of the Yangtze River Delta region is 1.206, that of Guangdong, Hong Kong and Macao is 1.737, and that of the Yellow River Basin is 1.063. The highest in the East and the lowest in the West.
(2) The innovation efficiency of China’s cultural industry has maintained a good growth trend, and the Malmquist index as a whole is greater than 1.0. In the six periods of 2014-2015, 2015-2016, 2016-2017, 2017-2018, 2018-2019, 2019-2020 and 2020-2021, the Malmquist index of China’s cultural industry was 1.508, 1.212, 1.049, 1.400, 3.654, 1.070 and 1.696 respectively, which were significantly greater than 1.0. In addition, the TC index of innovation efficiency of China’s cultural industry is most affected by matc, so it is necessary to pay attention to the impact of technology deviation.
(3) Environmental variables such as air pollution, domestic pollution and pollution control have significant effects on innovation efficiency. The coefficient of SO2 is -0.006, which is significant at the level of 95%. Similarly, garbage’s efficiency on cultural innovation is significant at 99%, with a coefficient of -0.003. The influence coefficient of cpollution was 0.024, which passed the significance test of 1%.
Finally, in order to promote the high-quality and green development of China’s cultural industry, this paper puts forward the following policy suggestions:
(1) Increase investment in the cultural industry, reduce resource redundancy, and improve the efficiency of industrial innovation.
(2) We should attach importance to the role of technological forces in promoting the cultural industry and continue to carry out original technological innovation.
(3) We will strengthen environmental pollution control, strictly control the three industrial wastes, and create an ecological environment for green development.

