

Introduction
Water scarcity is a problem on a worldwide scale. There are numerous causes for this water shortage. Deforestation, population growth, industrialization, and concrete forests hinders the water from entering the earth [1-3]. Water scarcity might be portrayed by water shortage and water stress. High population and limited water source availability are the causes of the water shortage. Abundant water sources but high water demand leads to water stress [4]. Water scarcity can also take the form of a lack of both quantity and quality [5]. Only 3% of the world’s water is freshwater, and two-thirds of that is trapped in icebergs and is therefore useless. In addition to these water pollution is a matter of quality. Each year, India generated more than 350 million tonnes of agricultural and industrial trash [6]. Dumping industrial trash and sewage waste together turns water ways into a pool of poison [7]. If current consumption rates, population growth, climate change, and polluting behavior continue, two-thirds of the world’s population may confront water shortages in the near future. [8, 9].
It is imperative that action be taken to replenish the water supply. Desalination procedures are being carried out to address the water scarcity conditions [10]. The level of the ground water may significantly increase if precipitation is collected and allowed to percolate into the soil. However, waste water treatment is also a crucial technique to restore the water [11] to protect the environment. The treated water can be used for a variety of purposes and should be treated appropriately before being released, which may assist to save the environment [12-15].
Conventional wastewater treatment facilities have certain significant drawbacks. Space, money, manpower, and energy use are all factors that must be taken into account. Multiple procedures, including pretreatment, primary treatment, secondary treatment, and tertiary treatment, take up a lot of space and cost [16]. Additionally, skilled individuals are required for everyday tasks to prevent degradation [17]. Finally, when it comes to energy usage, aerators themselves use 70% of the energy. Bioreactors that are both aerobic and anaerobic have some fouling issues [18]. Even though there are certain benefits to use conventional treatment facilities, other reactors are still required when taking the aforementioned problems into account.
There are numerous ways to address the above difficulties. Sequential batch reactor (SBR) is one of these techniques. With a single basin, the sequential batch reactor fills, aerates, and settles [19]. Therefore, compared to conventional methods, space, investment costs, and maintenance costs are lower and also flexible and successful technology [20-22]. SBR is utilized to effectively remove Phosphorous, COD, and Nitrogen [23-26]; even a modified type of SBR effectively eliminates micro pollutants [27]. Another key benefit of SBR is its adaptability to different operating conditions, including anoxic and aerobic [28]. Small businesses and apartments can benefit greatly from this sequential batch reactor. The treatment effectiveness in this sequential batch reactor is good for all types of wastewater, including home, municipal, and small-scale industrial wastewater [29].
Thus, to achieve better performance and to achieve the ideal treated water efficiency, a sequential batch reactor can be processed with the aid of Programmable Logic Control (PLC) [30,31], Supervisory Control and Data Acquisition (SCADA) [32], Process Control System (PCS), PID control, Fuzzy control, and Fuzzy Neural Network (FuNN) [33-35]. Even if these controllers perform to their highest potential, they are in doubt when considering small-scale SBR.
For small scale reactors, the implementation and maintenance costs are intolerable. Small-scale wastewater treatment facilities for each home, to recycle the waste water is proposed in this research work. A miniature SBR with complete automation and control using an Atmel microcontroller is created, and the effectiveness of the sequential batch reactor is also evaluated in terms quality factors.
Experimental Procedures
Fabrication of SBR
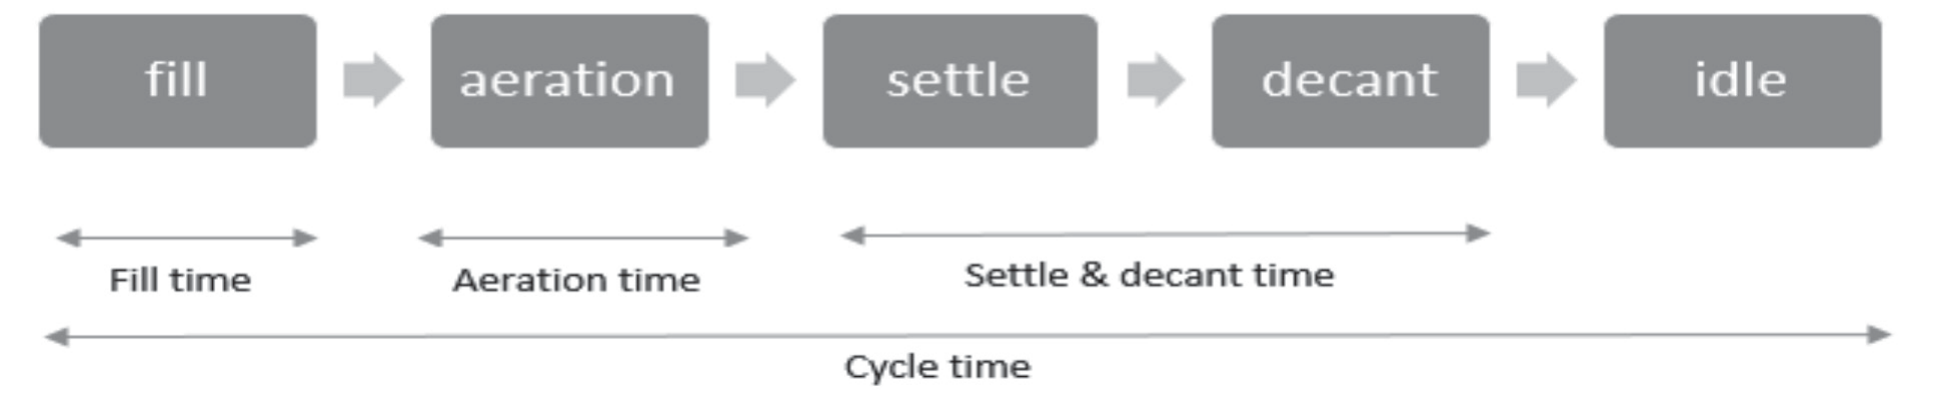
A single basin is used in the sequential batch reactor method of treating wastewater. There are five sequence states: fill, aerate, settle, decant, and idle. The aeration tank is filled with wastewater in the fill condition. Aeration is a crucial step in SBR because it creates the ideal environment for the microorganisms present in the waste water. In this stage, the dissolved oxygen is measured. The waste water is let to settle when the aeration process is finished. By leaving the supernatant, which is the treated water, the sludge blanket will settle down. In the fourth condition of decant, this purified water is decanted. The final state is idle state. During this phase, the sludge’s quality and amount are evaluated. In this stage, care will be taken if it deviates from the target level. With the help of an Atmel microcontroller, the entire sequence control, level control in the fill state, DO control in the aerate state, and sludge height detection in the idle stage are all fully automated.
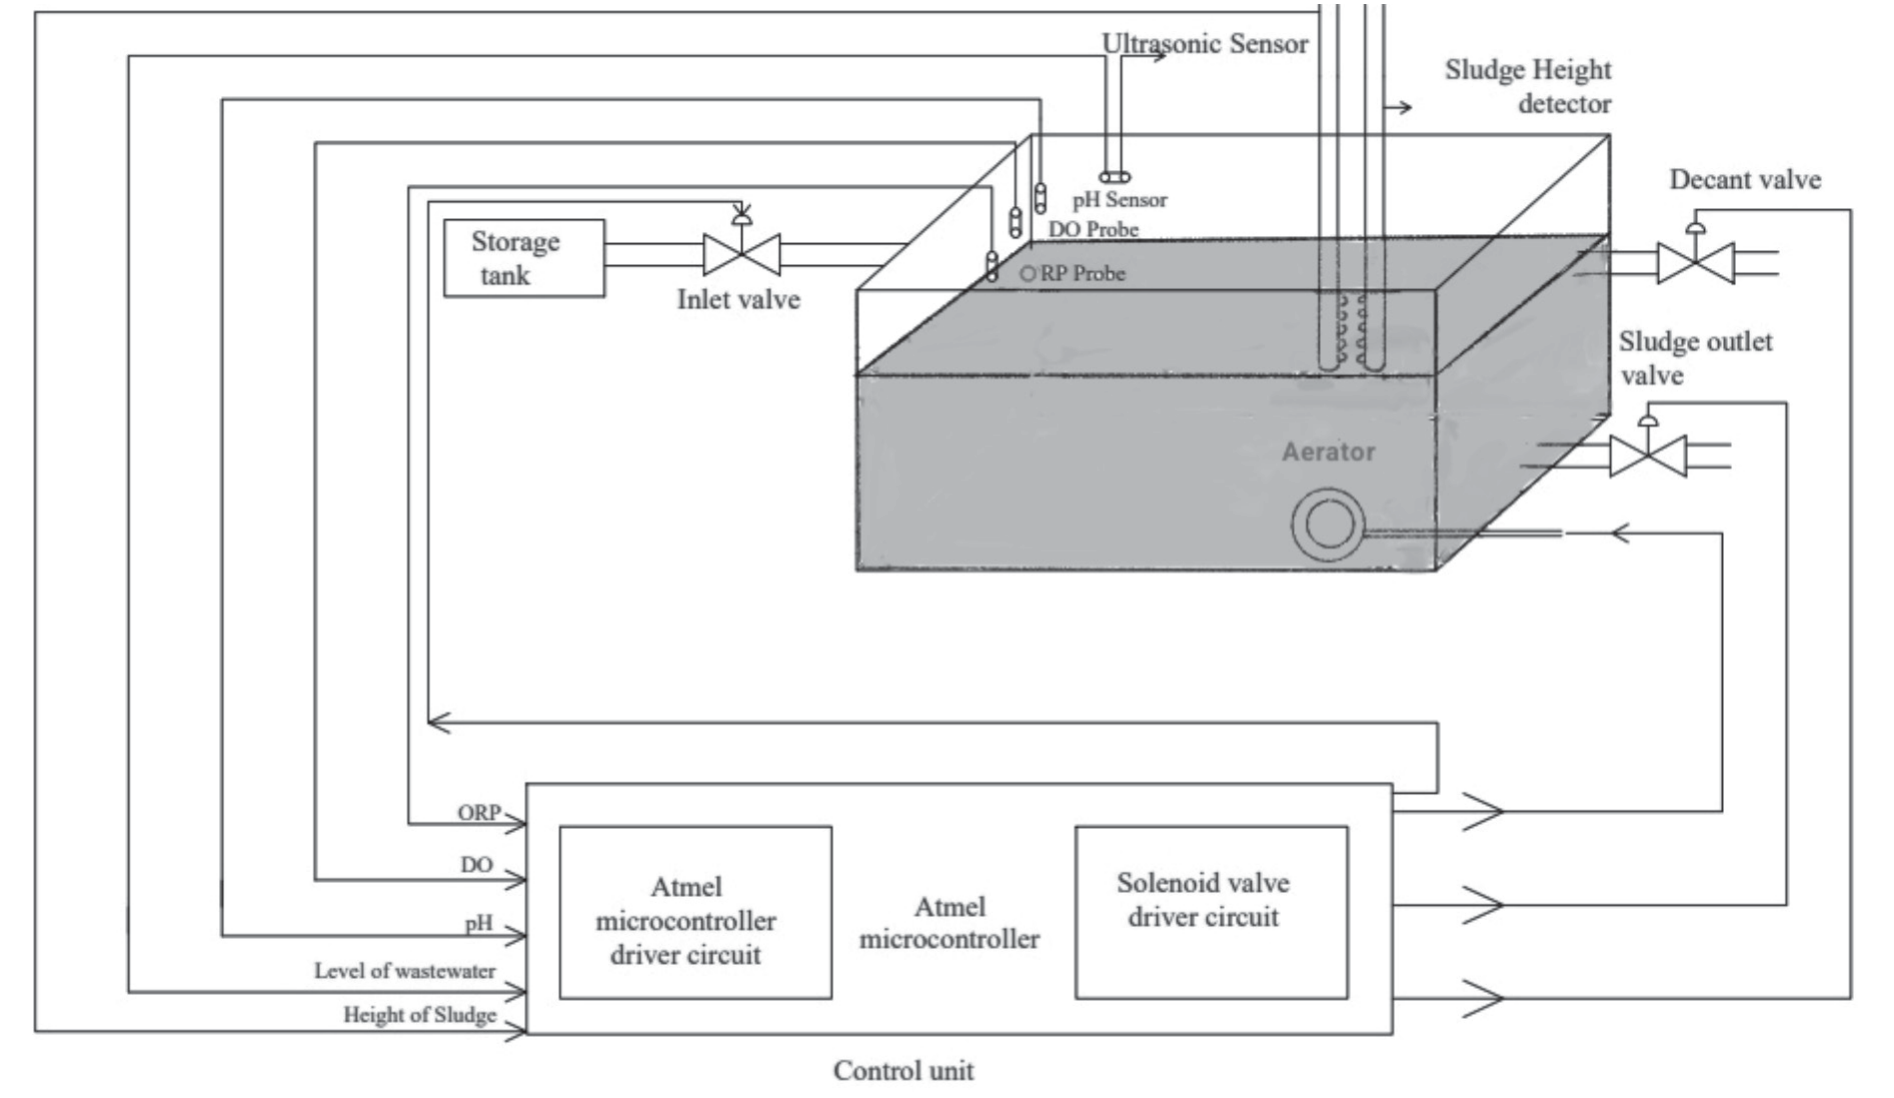
Fig. 1 depicts the block diagram of Sequential Batch Reactor with control unit. The reactor tank measures 11 inches in length, 8 inches in width, and 8 inches in height. The tank’s total capacity is 11 litres. The Working volume is 9 litres of waste water. The input pipe has a 0.75 inches dia hole and is fixed at 6.6 inches height. A provision with 0.75 inch dia. hole at 5.5 inches height is given for decant valve. A 0.75 inches dia. hole at 1 inch height is provided for sludge decant valve.
Sensors and Detectors
The level of the tank when it is in fill state is measured using an ultrasonic sensor. The Dissolved Oxygen (DO) probe is used to monitor the amount of dissolved oxygen in the reactor, which is necessary to maintain the best atmosphere for microorganisms. The oxygen reduction potential (ORP) probe is used to test the oxygen reduction potential, which explains the oxidation and reduction activities of microorganisms. The temperature and pH range are kept at 27oC and 6.8 to 7.6, respectively, and are monitored by a temperature and pH sensor. The sludge level detector provides information on the sludge height using InfraRed (IR) sensors unit. The IR sensor unit used in the experiment is fabricated at lab scale, which consists of an array of IR sensors placed on an electrical casing pipe at 1 inch distance.
Control Unit
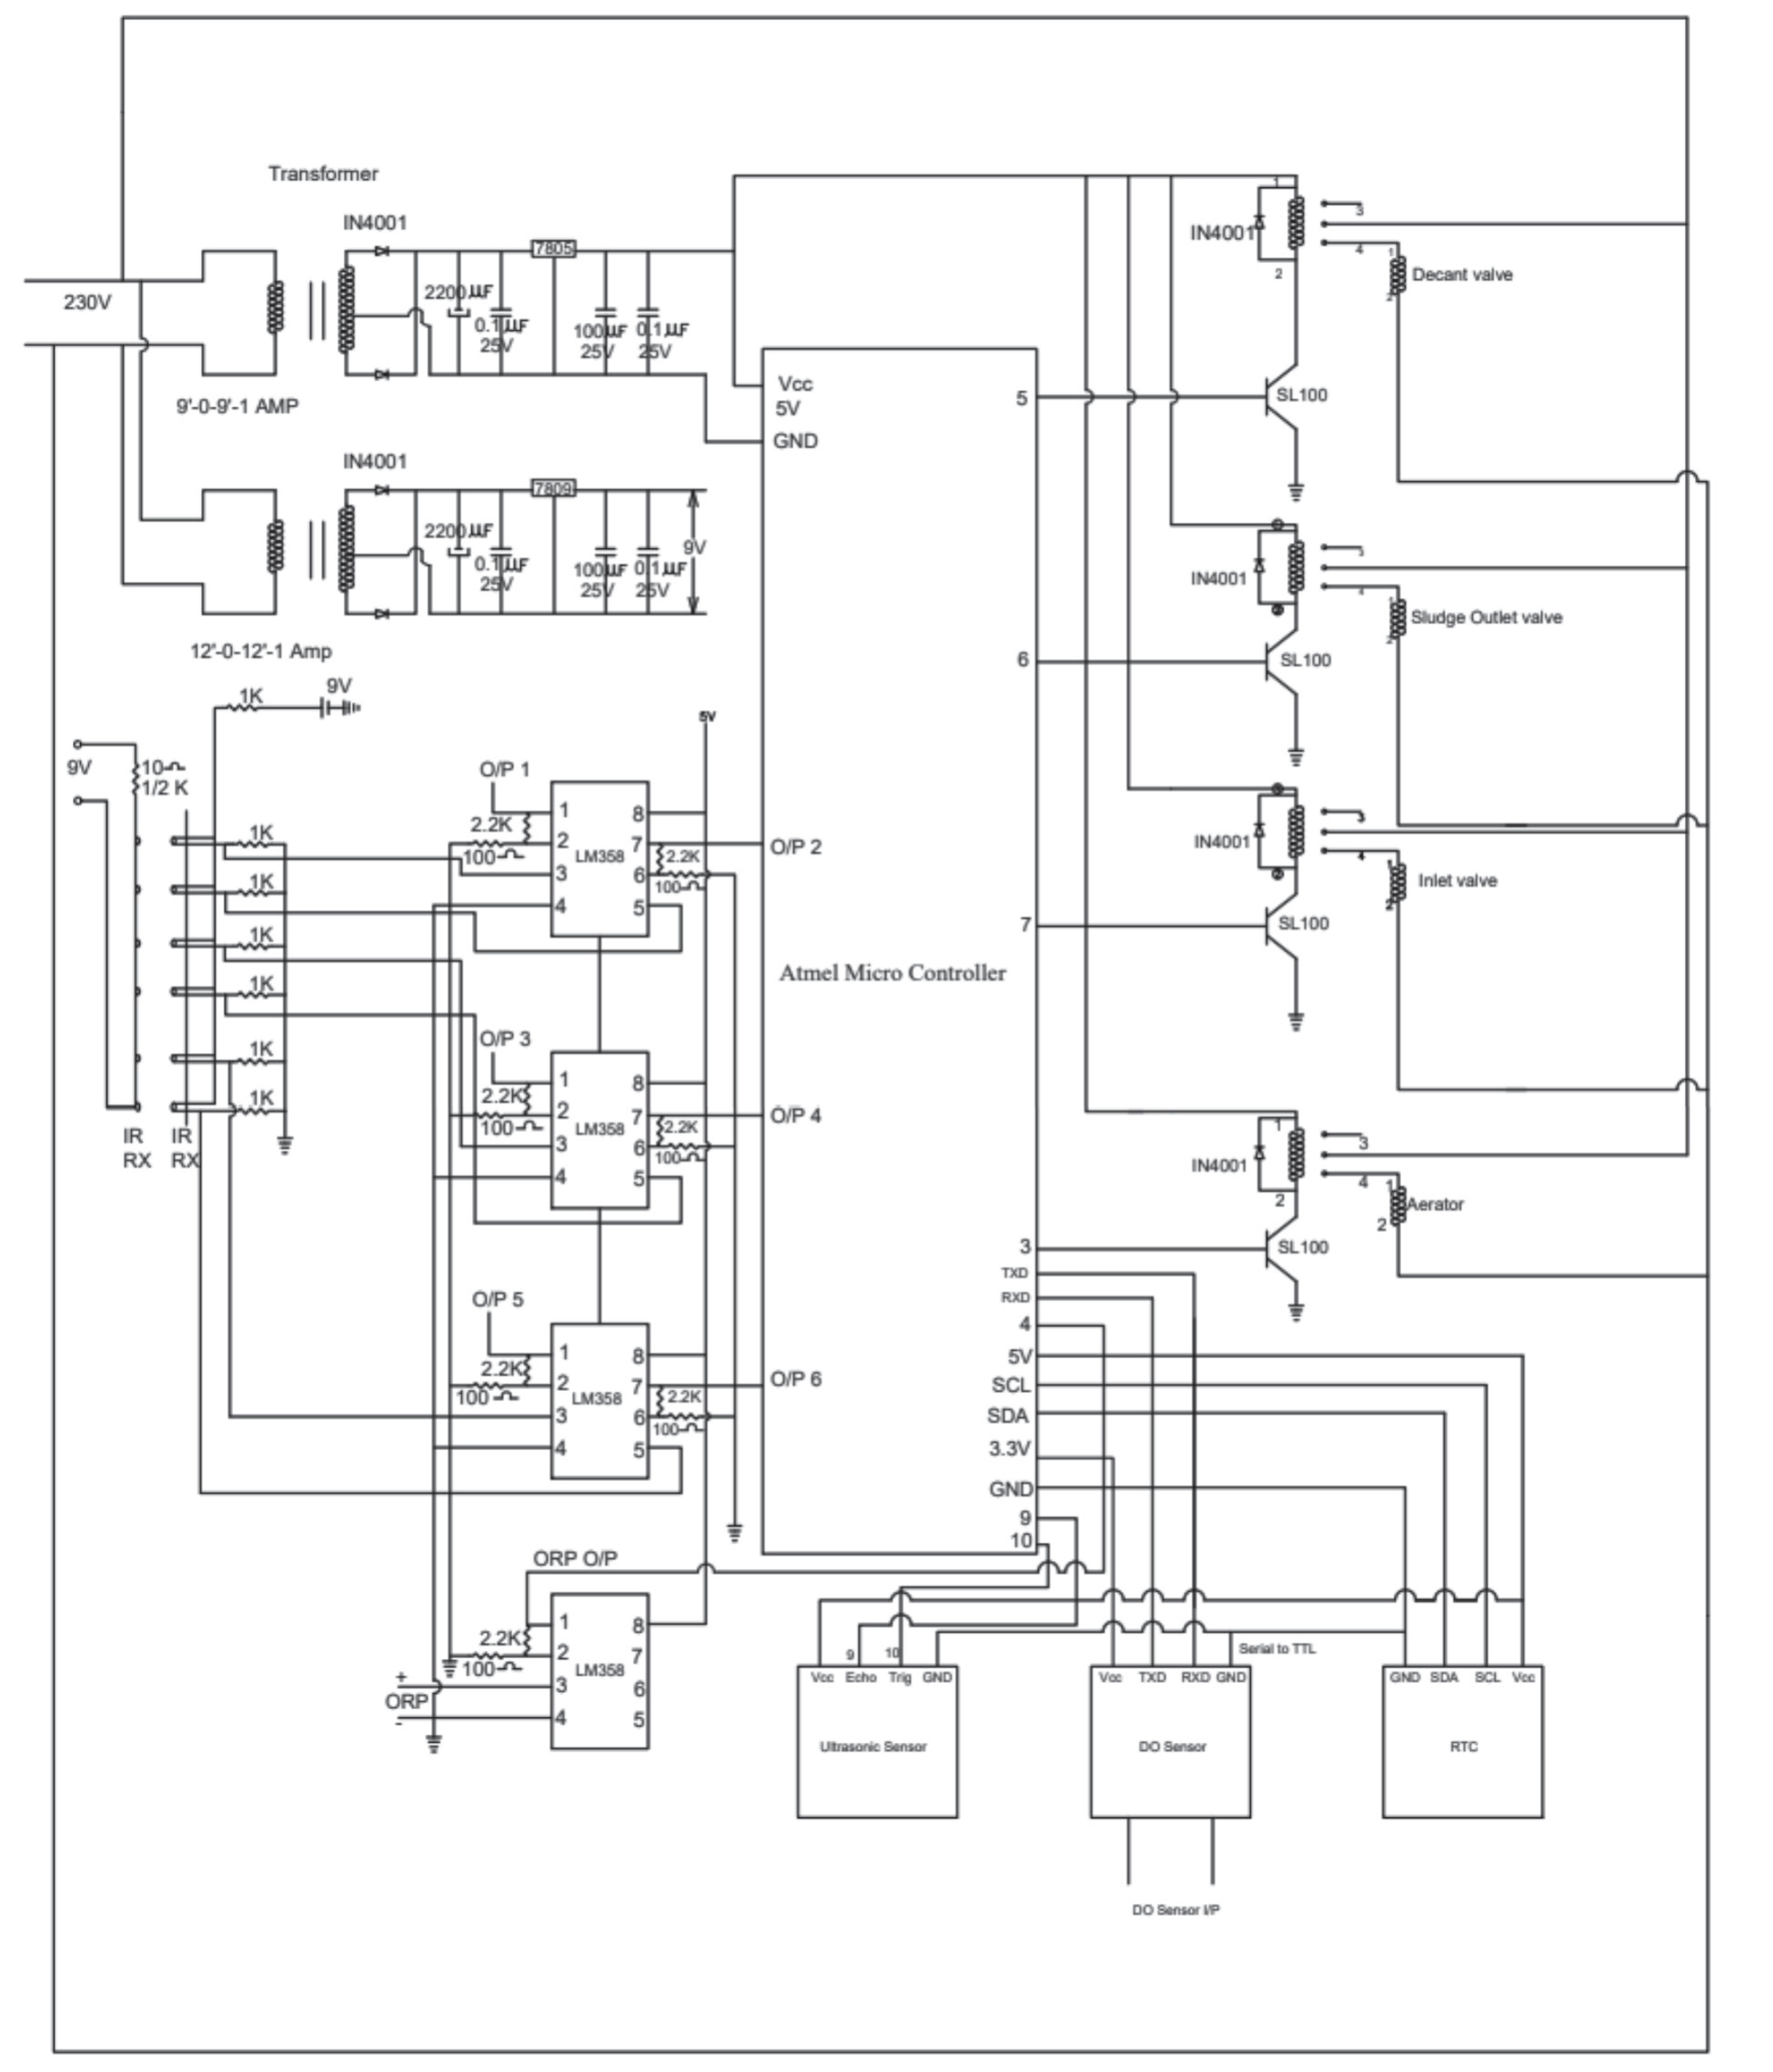
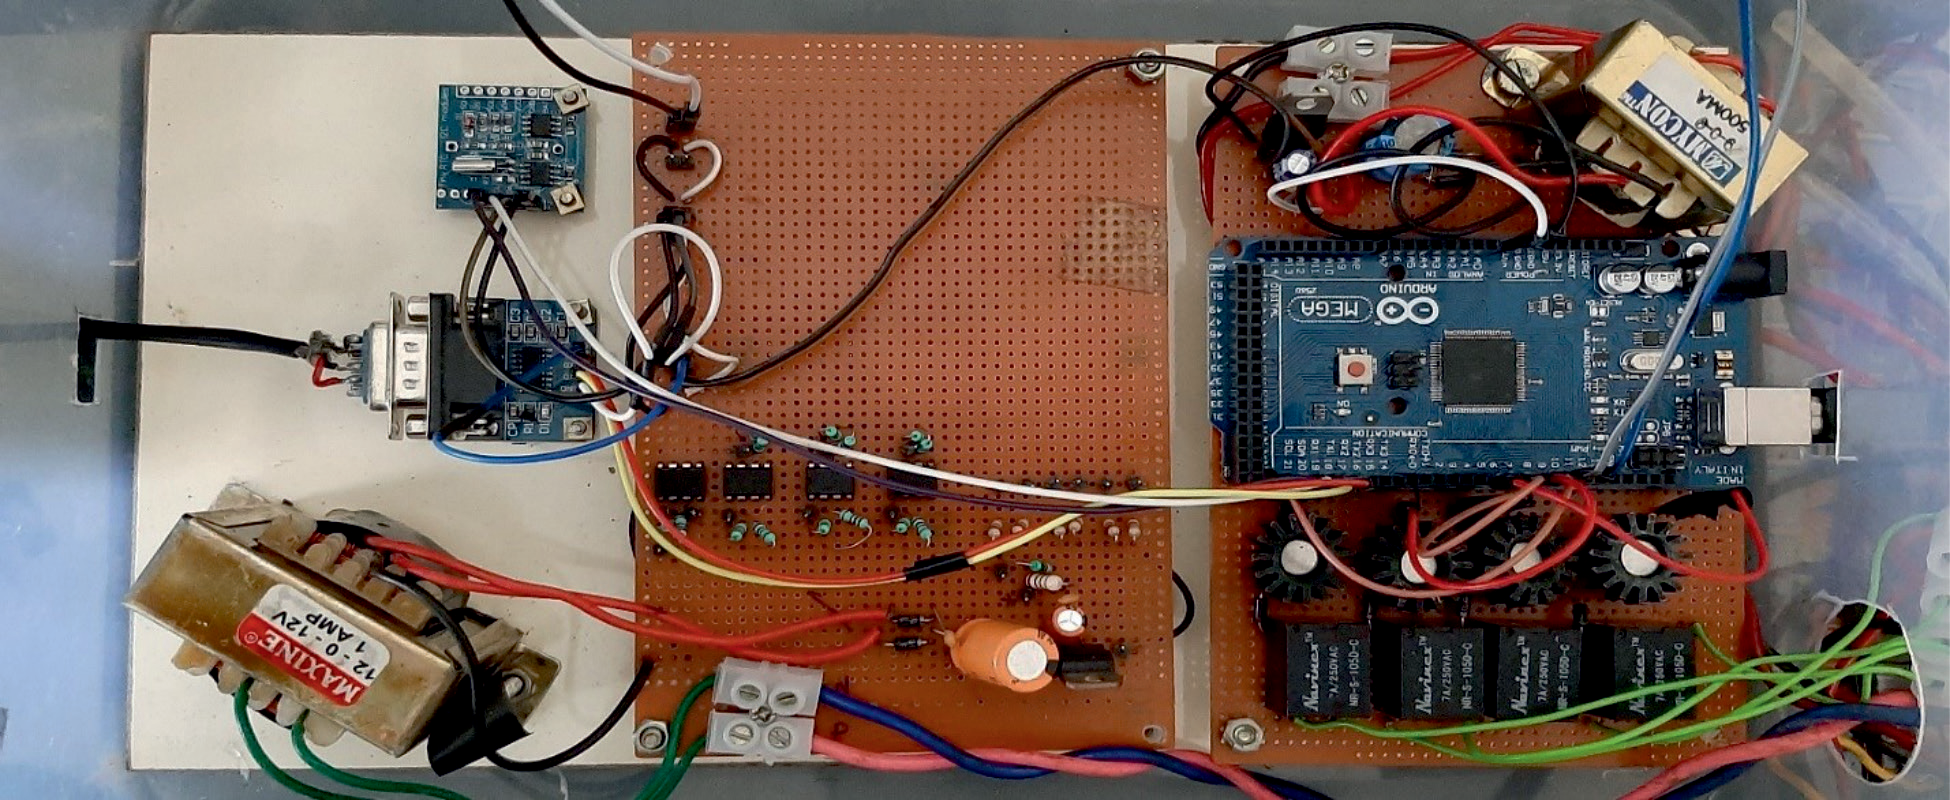
The control unit is made up of three sections, including an Atmel microcontroller, microcontroller driver circuit and solenoid valve driver circuit. The Atmel microcontroller driver circuit gathers all measured variables from the process, such as dissolved oxygen, ORP, tank level, and also provides real-time timing to the microcontroller. The microcontroller then operates the valves in accordance with the controller and sequence programmes. Finally, based on the controller’s indication, the solenoid valve driver circuit operates the valves and the aerator. Fig. 2 displays the circuit diagram of control unit. Similarly, Fig. 3 depicts the fabrication of the control unit.
Sample and Inoculum
Activated sludge from an ASP-based sewage treatment facility in Madras Institute of Technology, Chennai, Tamil Nadu, India, was used to inoculate the reactors. Each cycle started with a decant volume replacing a predetermined volume of raw sewage. The cleaned sewage was removed from the reactor through the outflow port at the conclusion of each cycle. It was discovered that the pH of the raw sewage was in the range of 6.8 to 7.6 which is better for biological treatment [36]. During the aerobic phase, the operating DO level in the reactors was kept between 2.0 and 2.5 mg/L.
Time Sequence in SBR
The time sequence employed in SBR is illustrated in the Fig. 4. Typically, it is believed that the aeration period takes up half of the cycle time. For instance, if the cycle duration is three hours, the aeration time may be one and a half hours. After that, half an hour is used to fill and decant. The remaining one hour is to settle. Since timing is significant in SBR, three different time analysis have been considered and tested. The following – Cycle time analysis – Aeration time analysis – Settling time analysis
This time analysis is done to determine the ideal time period for the collected sample. Cycle hour analysis – a 4 hour cycle, a 5 hour cycle, and a 6 hour cycle – are taken into consideration based on the aforementioned concept to determine which is ideal for the given sample to obtain the best treated water efficiency. Once the cycle hour has been established, the best cycle hour’s aeration time is tried and then decided upon with one aeration time. The optimal cycle hour’s settling time is tested and it is then chosen with one settling time. As a result, the next step in the open loop treatment procedure has been finished, and the outcomes have been evaluated.
Results and Discussion
Open Loop Analysis
Open loop analysis is used to evaluate the effectiveness and performance of lab-scale SBRs in order to determine their capacity to treat wastewater. The detailed analysis is described below.
Cycle Time Analysis
Three cycle hours: 4, 5, and 6 hour cycles are selected for analysis. The temperature and pH range are kept at 26ºC, 6.8 to 7.6 respectively.
The rise in dissolved oxygen and the positive microorganism activities are shown in Fig. 5 with regard to time for all three cycles. The cycle hour, aeration time, settling time, treated water COD, BOD, and the corresponding efficiencies are summarized in Table 1. According to the analysis, the 4-hour cycle is found to be more efficient than the other two cycles. Therefore, the aeration time and settling time of this 4-hour cycle are being evaluated for subsequent study.
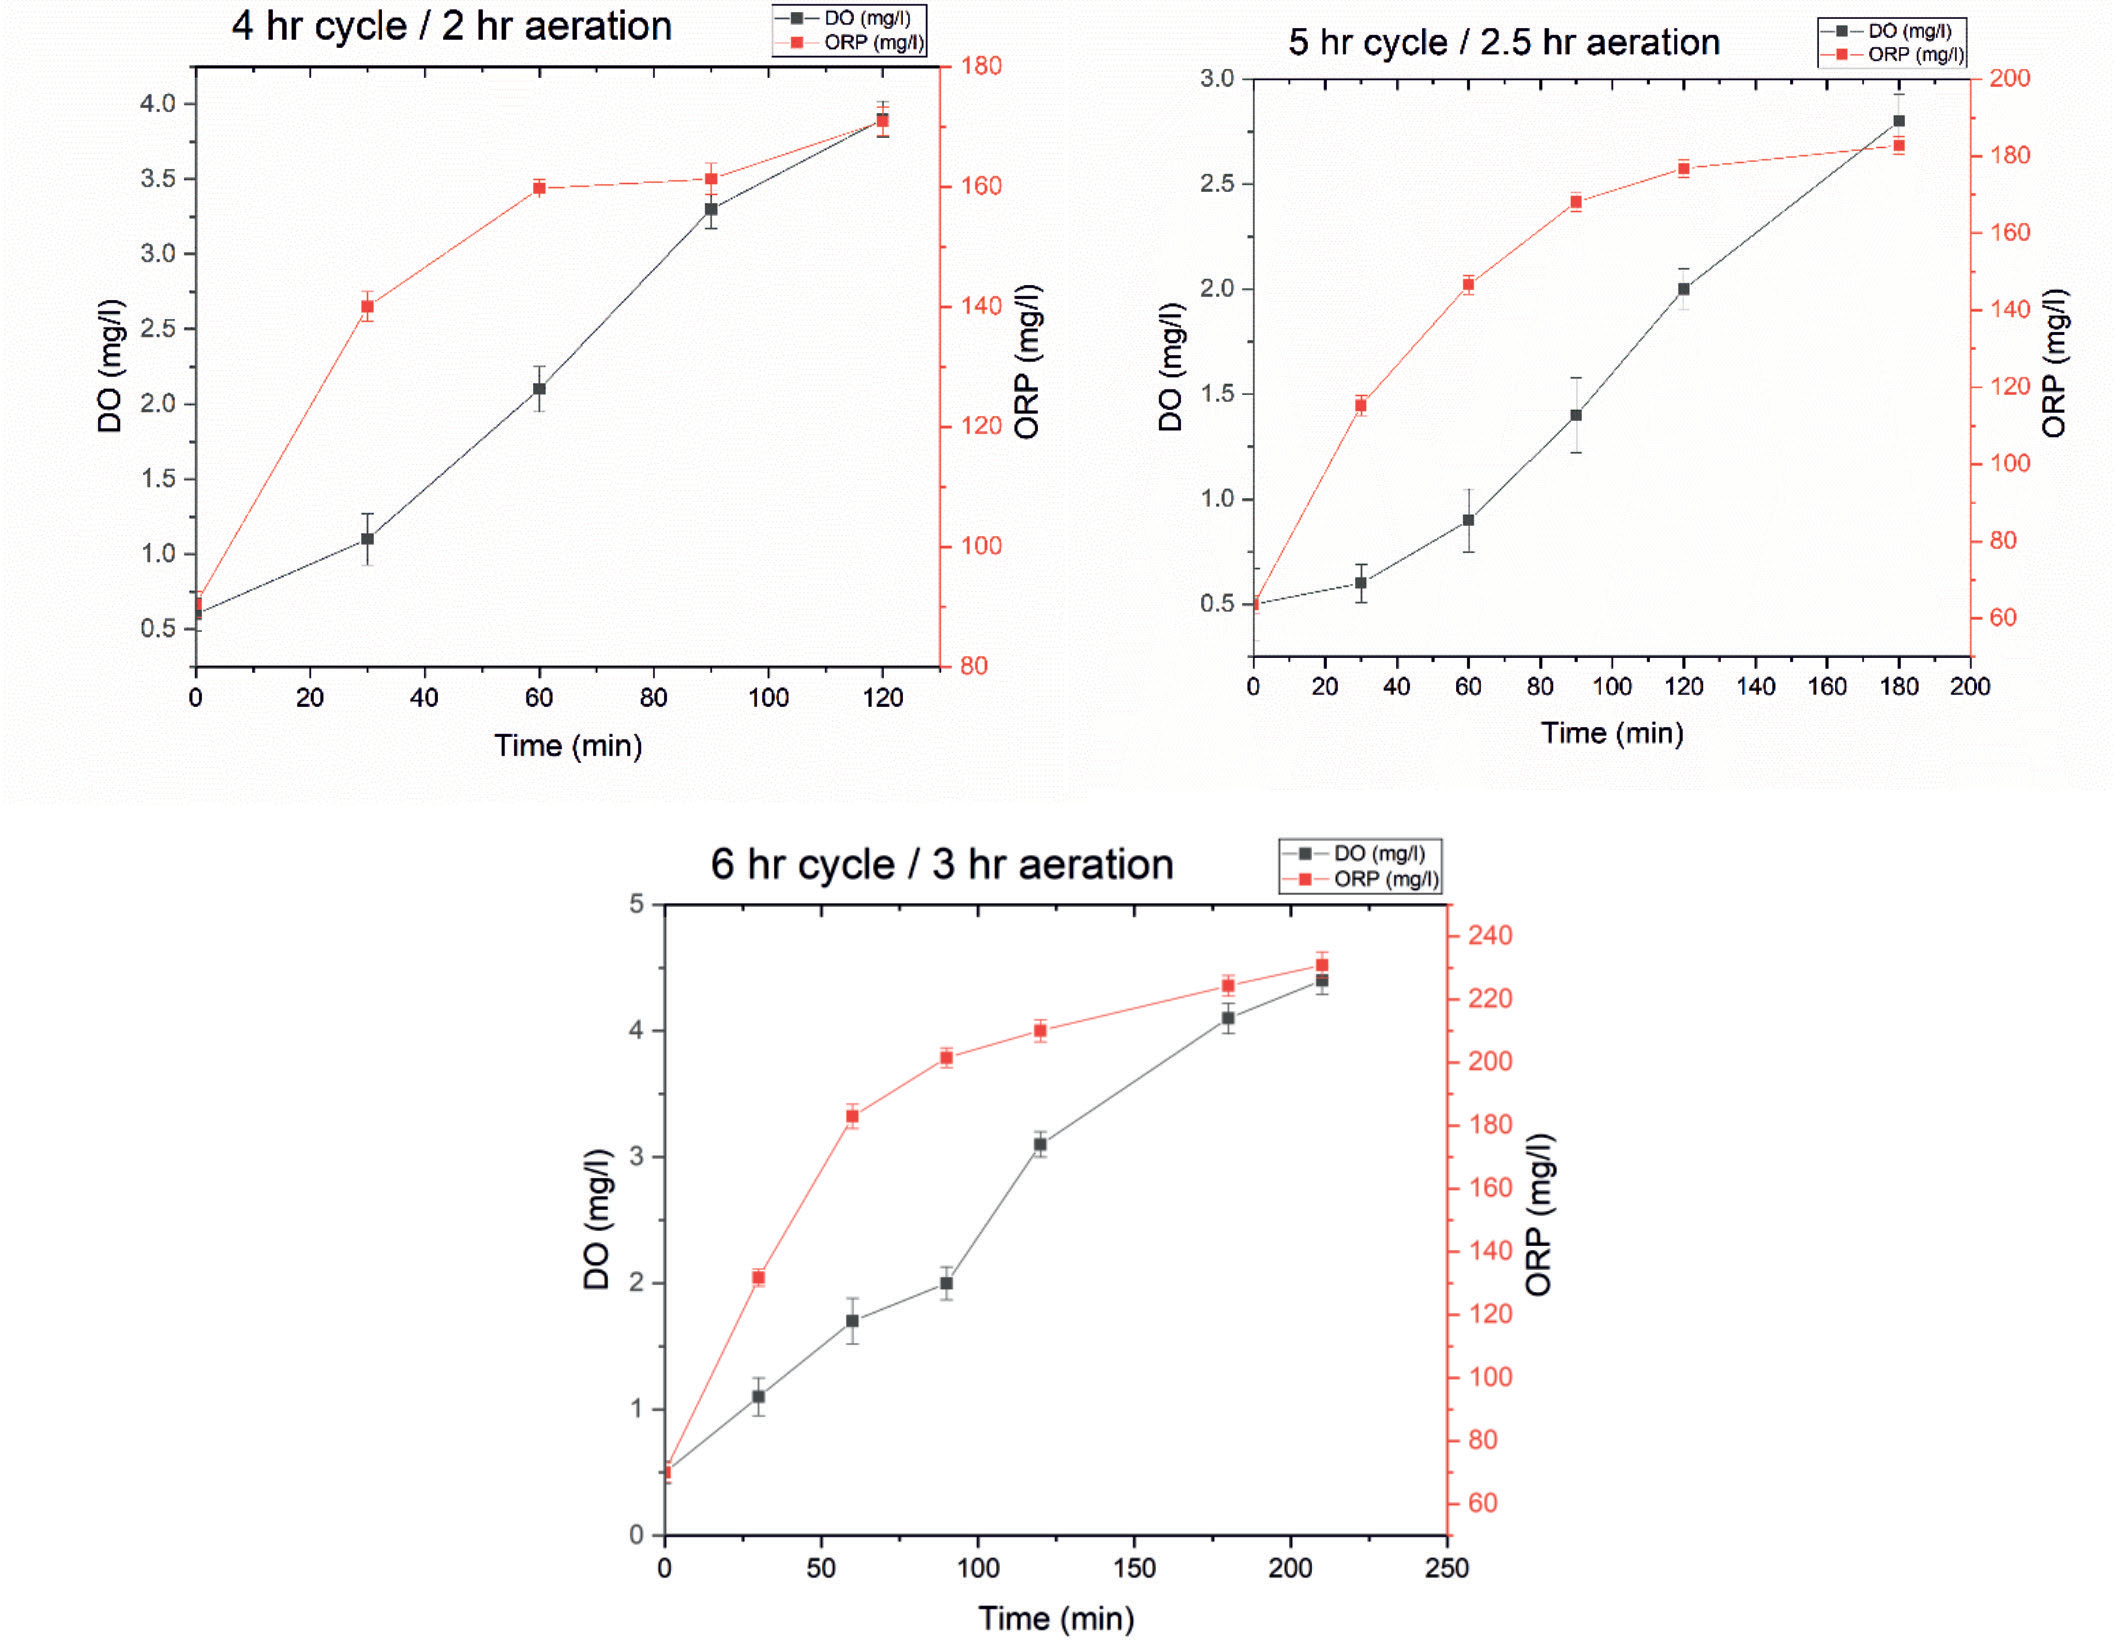
Table 1.
Summary of cycle time analysis.
Table 2.
Summary of aeration time analysis.
| Aeration Time (hour) | Settling Time (hour) | COD (mg/l) | BOD (mg/l) | COD Efficiency (%) | BOD efficiency (%) | |
|---|---|---|---|---|---|---|
| Raw water | 1715 | 690 | ||||
| Sample 1 | 1.5 | 1.5 | 102 | 22 | 94.05 | 96.81 |
| Sample 2 | 2 | 1.5 | 61 | 12 | 96.44 | 98.26 |
| Sample 3 | 2.5 | 1.5 | 75 | 19 | 95.63 | 97.25 |
Aeration Time Analysis
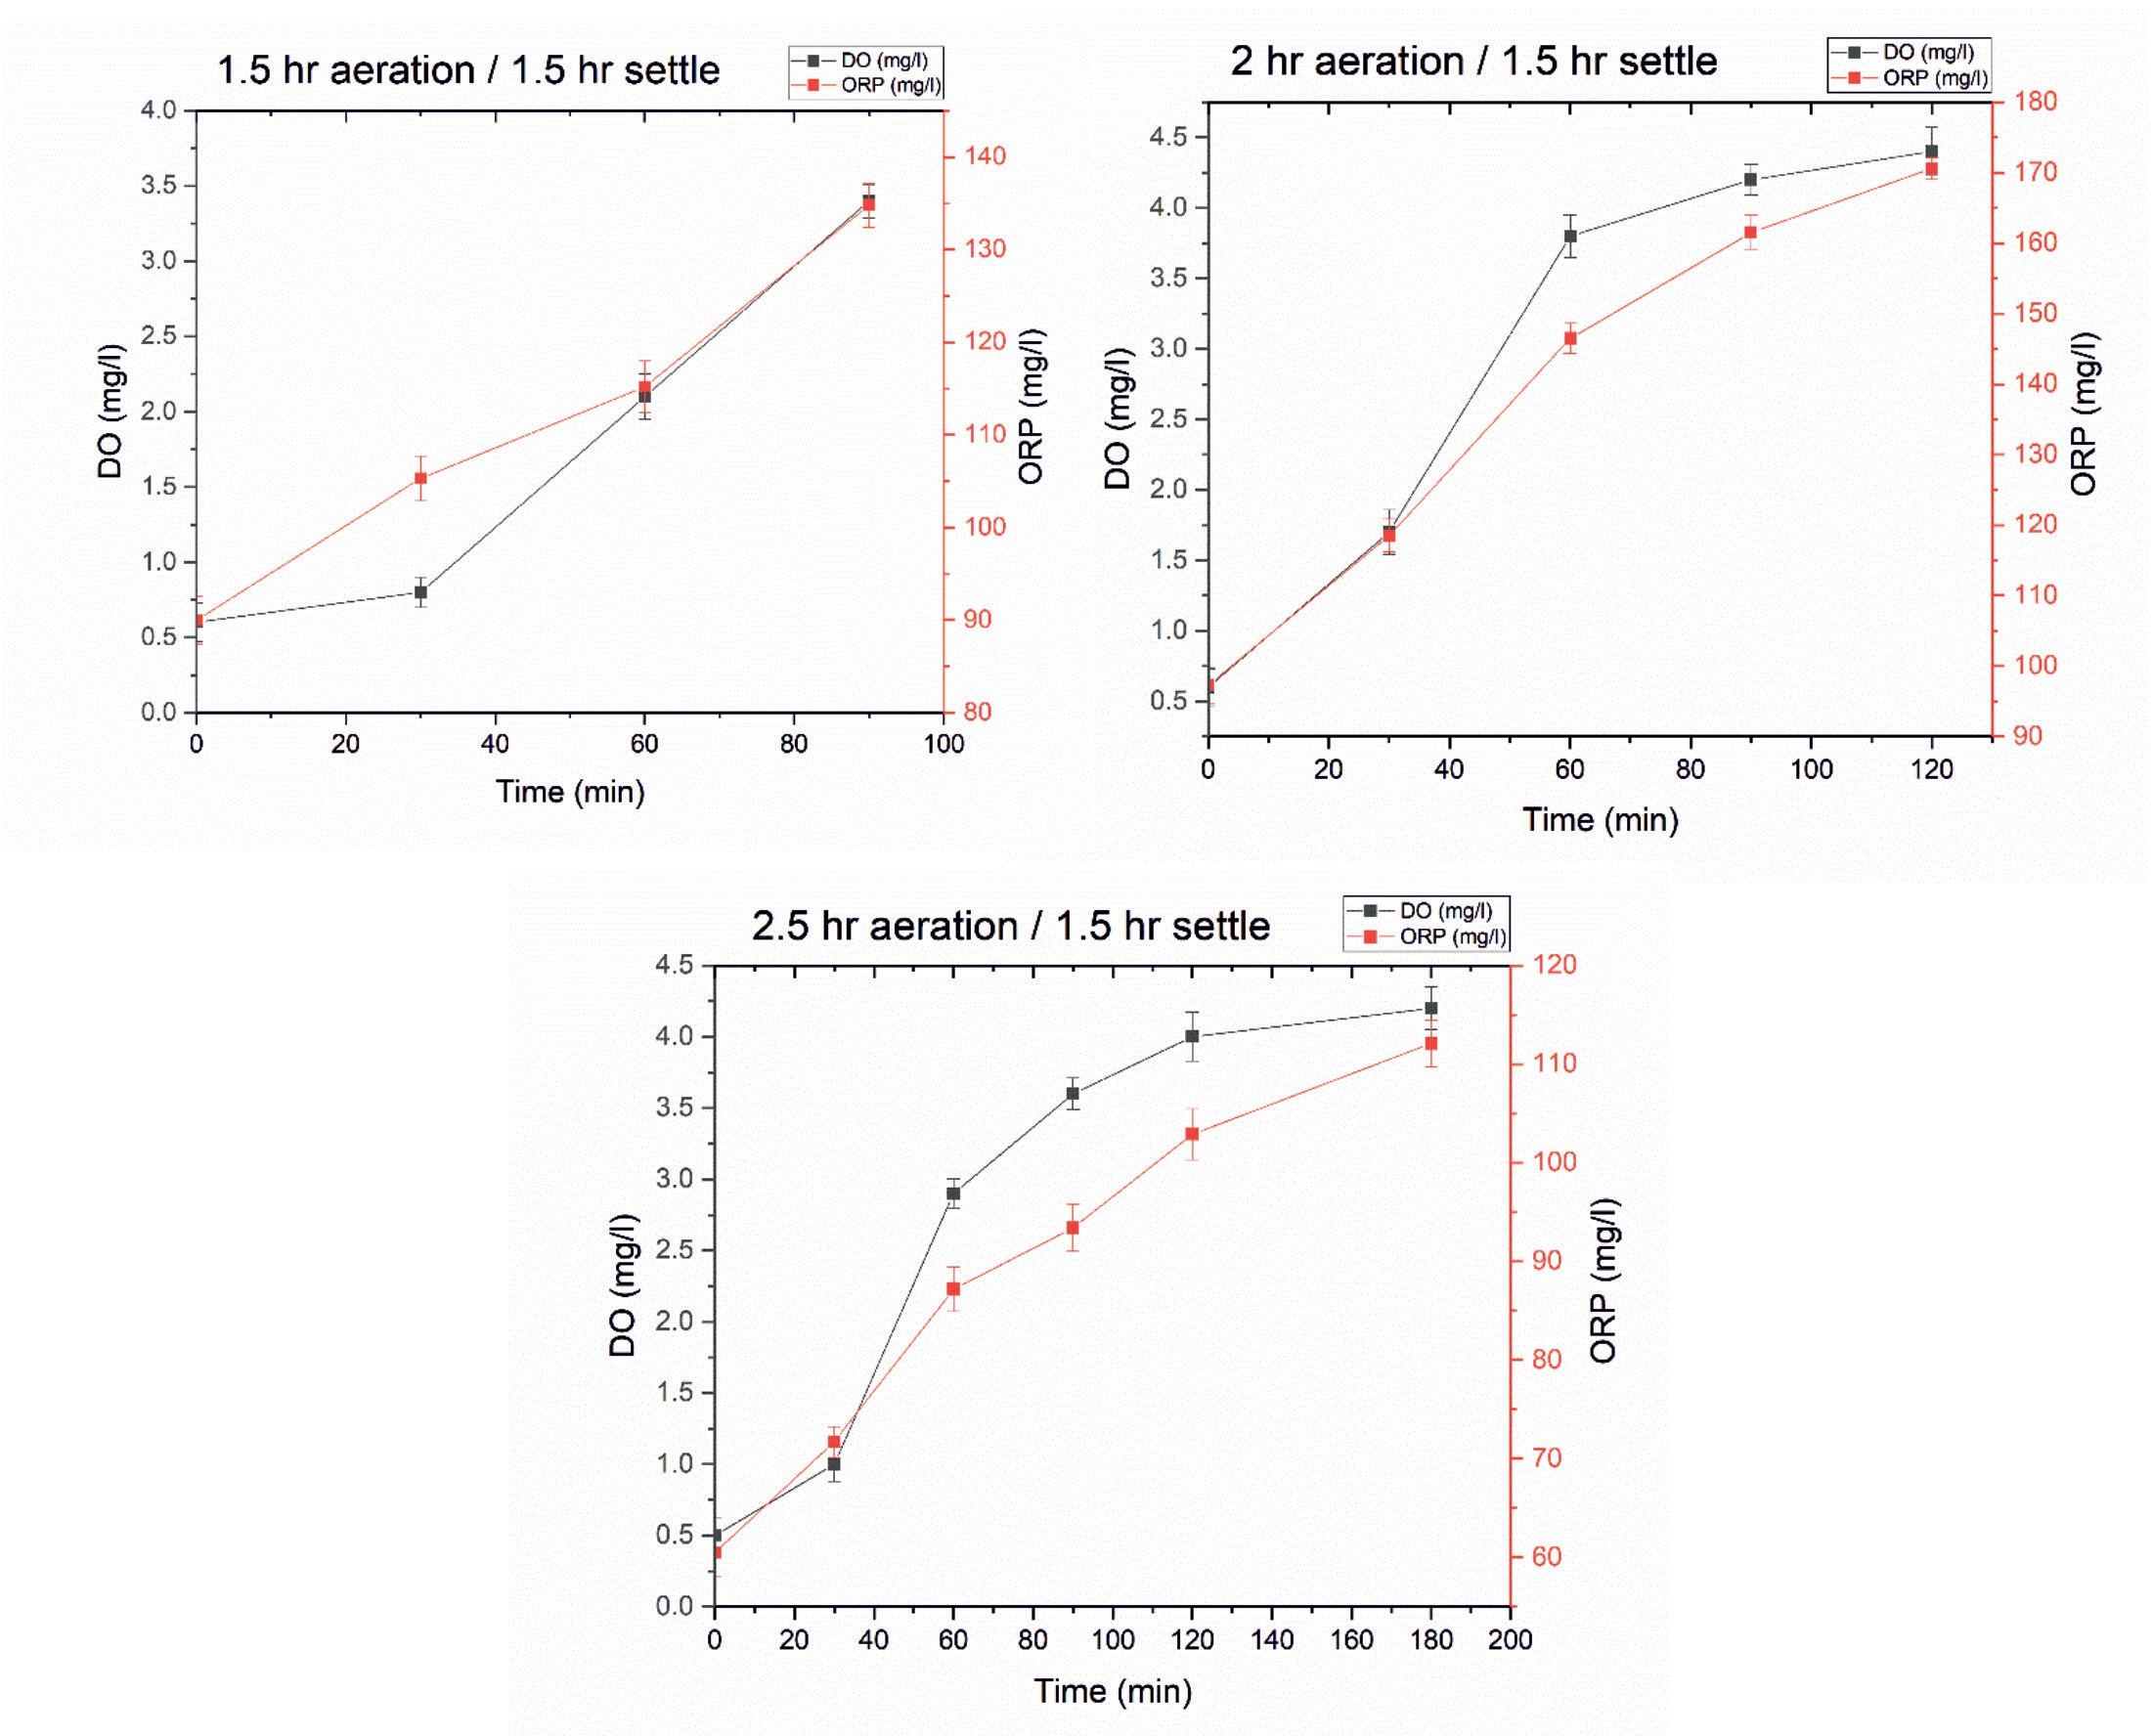
The temperature and pH range are kept at 26ºC, 6.8 to 7.6 respectively, similar to cycle hour analysis. Aeration time corresponding to 4 hour cycle is selected and 0.5 hours duration above and below this time is chosen for aeration time analysis. Thus for the analysis 1.5 hour, 2 hour and 2.5 hour are chosen. In addition, the 4 hour cycle’s settling time is fixed at 1.5 hours.
Fig. 6 illustrates the ORP and DO profile during aeration time analysis. The profile shows an increasing trend which is a sign of proper performance of SBR. According to the summary in Table 2, aeration times of 2 hours gives improved COD and BOD efficiency. As a result, the aeration period is set at 2 hours, after which the assessment of the settling time is required.
Settling Time Analysis
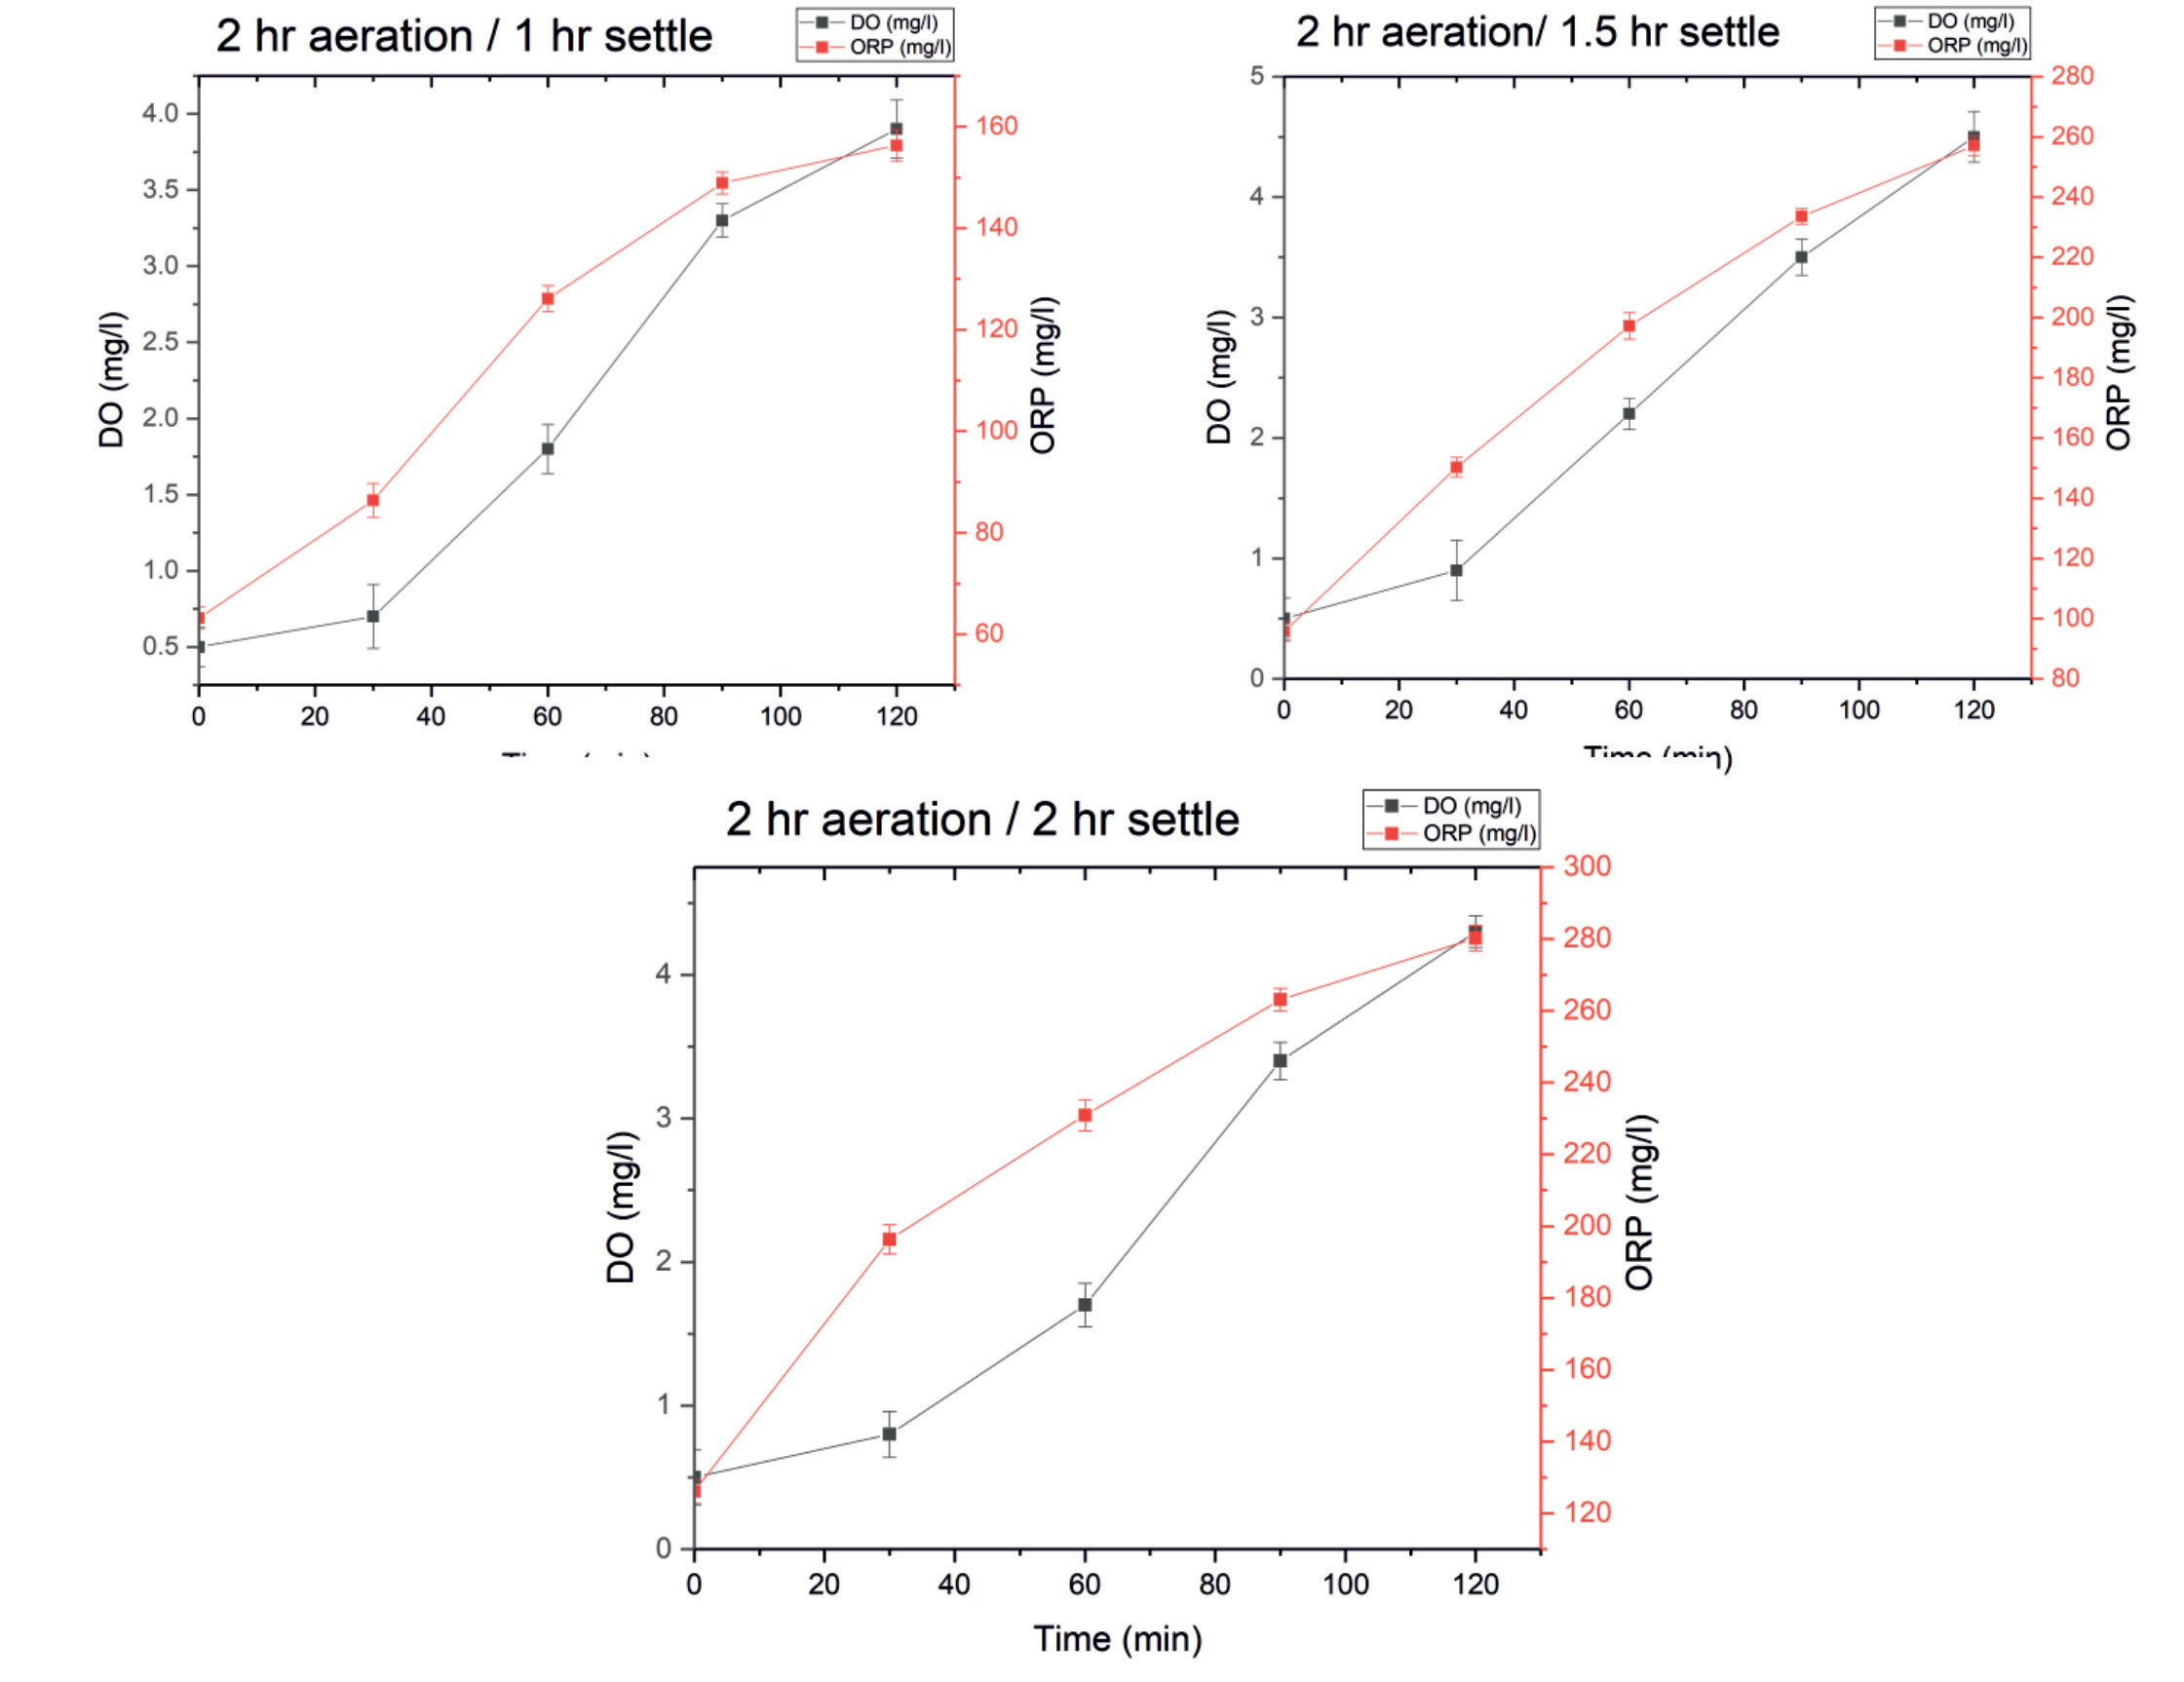
According to the cycle time analysis, the settling time for the four-hour cycle is 1.5 hours. With the 1.5 hours’ time range plus or minus 0.5 hours is chosen i.e., a settling time of 1 hour, 1.5 hours, and 2 hours. For settling time analysis, the aeration time is fixed as 2 hours during this analysis.
Fig. 7 shows the DO and ORP profile during settling time analysis. The increasing trend verified the SBR’s appropriate operation. Table 3 gives the summary of settling time analysis. From the analysis, it is observed that one-hour settling time is preferred. Finally, aeration time and settling time are fixed based on the aforementioned open loop analysis. Even though the treated water efficiency in an open loop analysis is excellent, a closed loop analysis is also conducted in order to save energy and achieve even higher performance.
Closed Loop Analysis
The measurable variables dissolved oxygen, ORP, and sludge height are also measured in the closed loop analysis and provided to the controller unit together with the time sequence. Based on the desired value, the control action is executed.
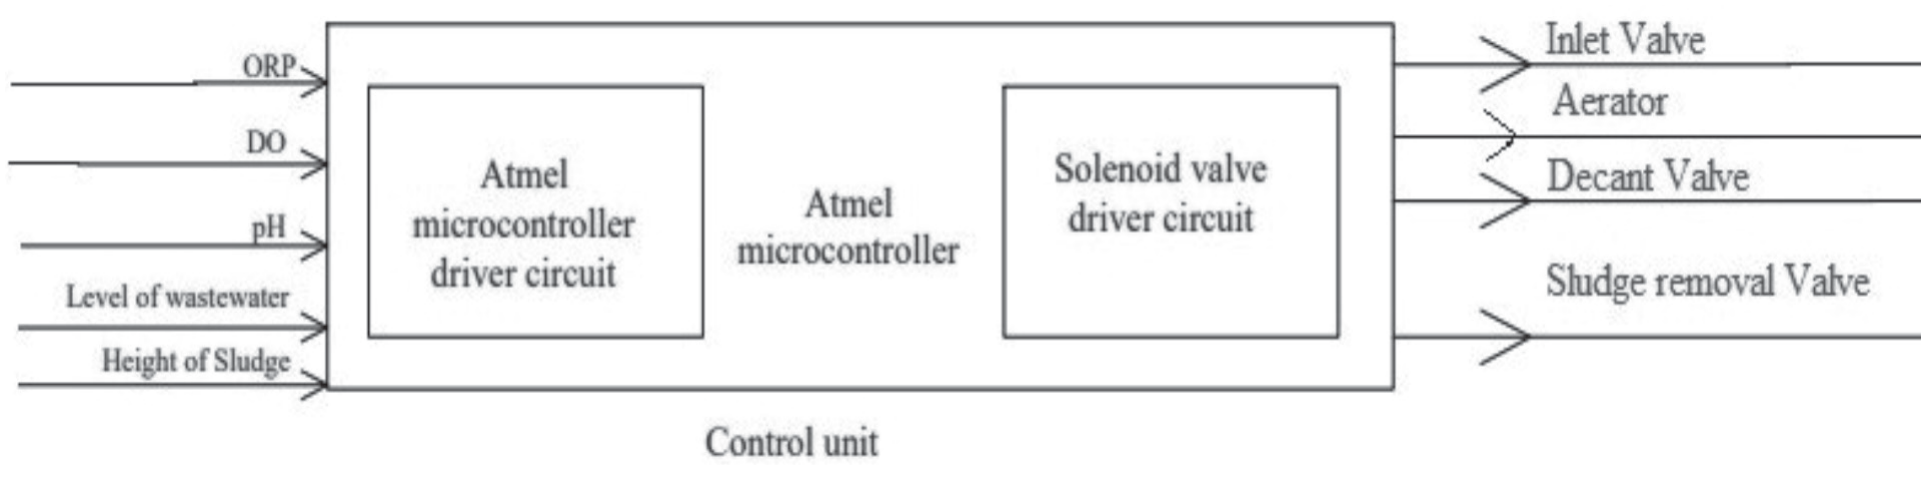
Fig. 8 shows Block diagram of control unit. It gives the insight of Input and Output variables of the control unit. The ORP, DO, pH, wastewater level, and sludge height are measured and provided as the input to the controller. The inlet valve is controlled during the fill state by measuring the level of wastewater. In the aerate state, the required DO Value of 2 mg/L is maintained. ORP should be positive to demonstrate that microorganisms are properly growing and not decomposing. Sludge height is recorded and transmitted to the controller unit during the idle stage. The solenoid valve driver circuit controls the inlet valve, aerator, Decant valve, and sludge decant valve.
Manual Closed Loop
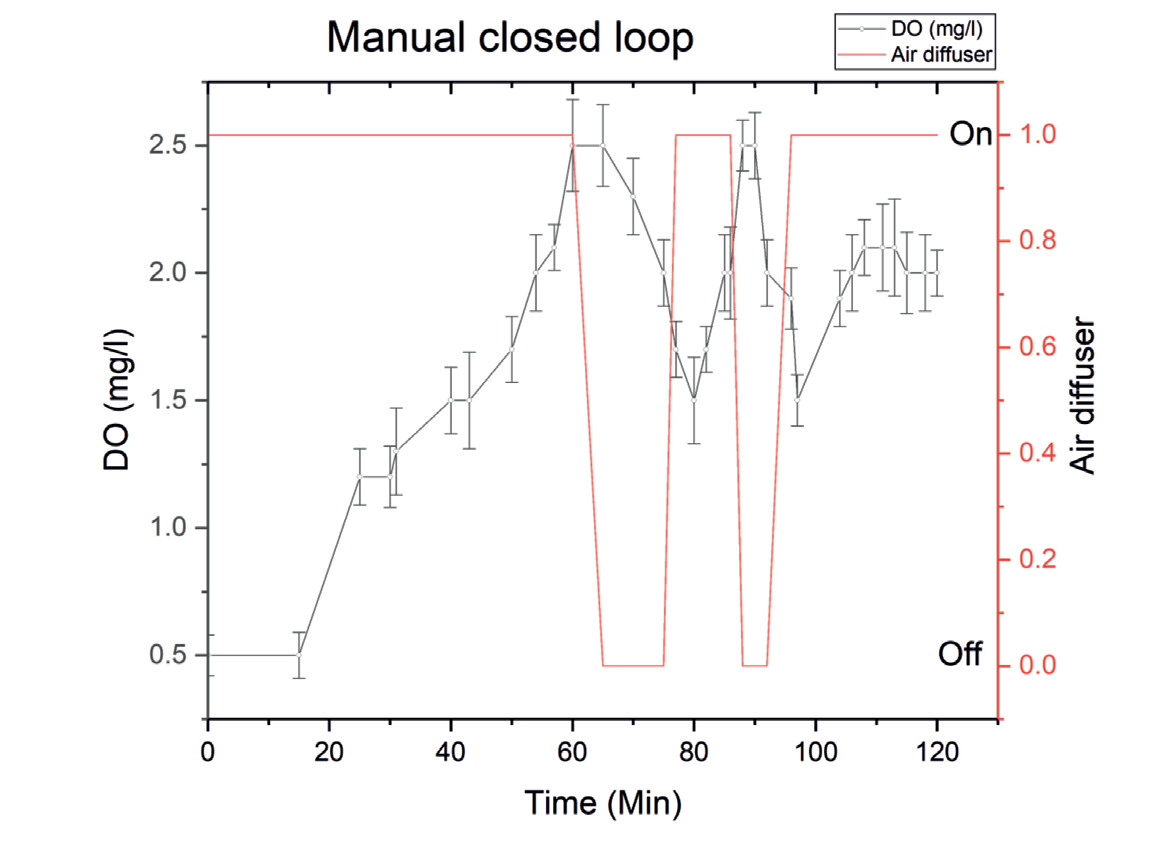
Temperature, and pH range are kept at 26ºC, 6.8 to 7.6 respectively. The entire cycle is managed manually for analysis by turning the aerator on and off at the optimum level of 2 mg/L DO. The closed loop study of SBR performance is shown in Fig. 9. The final COD and BOD values are reached the range based on water reuse guidelines, demonstrating that the treated water’s efficacy has not been compromised (Table 4). When compared to open loop analysis, this may result in a decrease in power consumption by air diffuser.
Automated Closed Loop
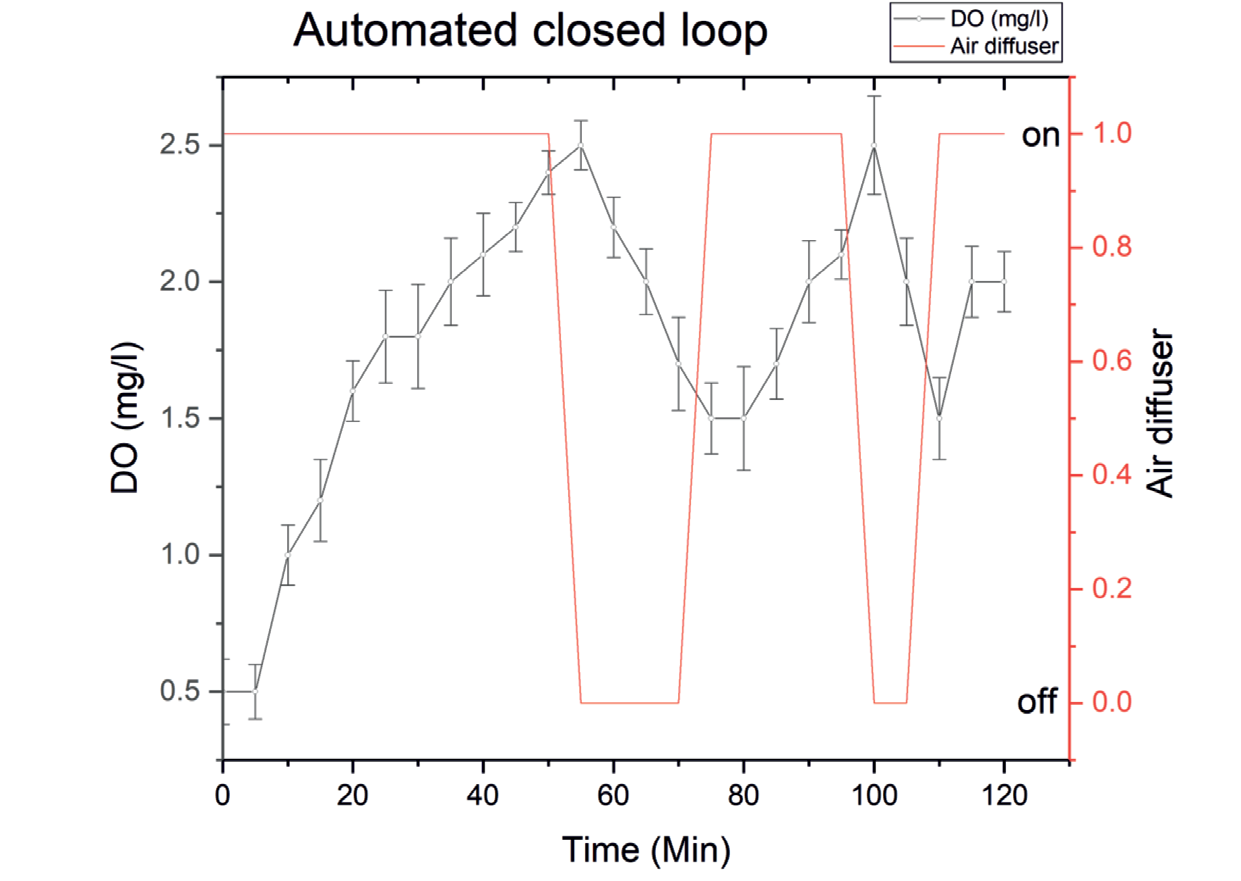
The automated closed loop analysis of sequential batch reactor is carried out with the Atmel microcontroller. Fig. 10 shows that the automation of sequential batch reactor. Table 5 summarize the automated closed loop analysis. The automated sequential batch reactor gives COD and BOD efficiency of 96.26 % and 97.82 %. Additionally, compared to open loop, the power consumption is decreased in terms of the operation of the air diffuser, it is in off state about 20 minutes as compared to continuous ON state under open loop. It does not disturbs the efficiency.
Conclusion
Nowadays, there is a serious problem with water stress and scarcity. Water meters have been installed at every home in many nations. In this situation, wastewater treatment plants will be necessary in the future to reuse the wastewater, much like other household commodities. Due to its space effectiveness, economic effectiveness, and operational flexibility in comparison to other conventional approaches. Sequential Batch Reactor is the ideal choice in this situation. The Atmel microcontroller is utilized to regulate the SBR’s sequence, DO, and sludge height instead of the controllers used conventionally in SBR. The Atmel microcontroller used in this work is compact, reasonably priced, and uses less power. The outcomes of the experiment demonstrated that the Atmel microcontroller is capable of providing high-quality water treatment. The final BOD and COD efficiency are respectively 97.8% and 96.3%.

