

Introduction
In the traditional industrial structure, the phenomenon of high pollution, high energy consumption and high emissions poses a serious threat to the economic and social sustainability, causing a series of problems such as environmental damage, resource waste and ecological imbalance. The Chinese government attaches great importance to environmental governance. In order to deal with the air pollution caused by high energy consuming industries, the strategic goal of “carbon peak in 2030 and carbon neutrality in 2060” is put forward. Based on this goal, the government has formulated a series of policies for the governance of high energy consuming industries. For example, in 2022, the national development and Reform Commission issued the benchmark level and benchmark level of energy efficiency in key areas of high energy consumption industries, requiring that the energy efficiency benchmark levels of oil refining, ethylene and p-xylene be distributed at 7.5, 590 and 380 kg standard oil/ton. These measures will greatly control the discharge of industrial “three wastes” and promote green development.
At the same time, vigorously developing green, low consumption and environmental friendly strategic emerging industries has become the key direction of China’s economic restructuring and upgrading. Cultural industry is an important part of strategic emerging industries, which plays a key role in achieving the dual carbon goal and promoting the development of green economy. As a green industry, the cultural industry has strong innovation and high value, which can meet the spiritual needs of consumers.
The cultural industry has increasingly become a new driving force for the industrial economic structure, and promoting the innovation and development of the cultural industry has become an important part of China’s economy and society. According to China’s 14th Five-Year Plan for Development, it is clearly proposed to promote the innovative development of the cultural industry and accelerate the development of new cultural enterprises, forms of cultural business and modes of cultural consumption. Innovation in the cultural industry is the core link to promote the high-quality development of the cultural industry, which is conducive to accelerating the spatial agglomeration of cultural elements and resources, attracting capital and talents to drive the development and growth of the industry. It is of great value to study the innovation of cultural industry.
Scholars at home and abroad have carried out research on cultural industry agglomeration, digital transformation and development path. Around the research of cultural industry agglomeration, Zhang and Gu (2022) studied the impact mechanism of cultural industry agglomeration on industrial structure upgrading [1]. Sun and Li (2015) measured the level of cultural industry agglomeration from 1996 to 2012 [2]. Huang (2023) used the structural hole method to analyze the geographical agglomeration and cooperation network of cultural industry [3]. Ye et al. (2022) used the location entropy index to measure the level of cultural industry agglomeration, and used the fixed effect model to test [4]. These studies mainly use econometric and statistical methods to discuss the problem of industrial agglomeration. In terms of digital transformation of cultural industry, Zhou and Yin(2023)calculated the integration index of cultural industry and digital technology [5]. Chen and Lin (2022) analyzed the change cycle of digital culture industry policy [6]. Xiang (2022) studied the elements and principles of digital empowerment of digital cultural industry [7]. Zeng and Huang (2022) analyzed the relationship between digitalization and cultural industry agglomeration [8]. This part of the study focuses on the impact of digital transformation on the cultural industry. Finally, scholars should analyze the promotion path of cultural industry from the dimensions of policy and value. Tian (2023) studied the policy measures of the development of national cultural industry on building a strong sense of community [9]. Zhang (2023) analyzed the technological logic shift of high-quality development of cultural industry [10]. Klein et. al. (2021) studied the value of cultural industry for sustainable development [11]. Kashan et. al. (2021) conducted an interview survey and Analysis on the relationship between cultural value and innovation [12]. Letty et. al. (2018) studied the impact of cultural values and multiculturalism on creativity [13]. The above research explores the specific strategies for the promotion of cultural industry.
Many scholars have also carried out theoretical and empirical research on innovation efficiency. In terms of theoretical methods, Zhang et. al. (2022) used the panel cointegration and causality model to study the relationship between investment and technological progress efficiency [14]. Muddasar et. al. (2022) studied the effect of import and export on enterprise innovation efficiency [15]. Du and Li (2022) used the time-varying difference method to simulate the impact of urban policies on green logistics efficiency [16]. Ongsakul et. al. (2022) analyzed the impact mechanism of acquisition vulnerability on enterprise innovation efficiency [17]. Chen et. al. (2022) constructed the NSBM model and estimated the relationship between the innovation chain of new energy vehicles and technological heterogeneity [18]. These studies mainly use the econometric statistical method to carry out research. In the empirical analysis of innovation efficiency, Zhang et. al. (2022) studied the role of green investment and green technology innovation in China’s ecological footprint [19]. The Two-stage DEA model of Zuo et. al. (2022) analyzes the technological innovation efficiency level of China’s mining industry [20]. Wittforth et. al. (2022) studied the key role of technical efficiency in the process of product technology [21]. He et. al. (2023) analyzed the different impacts of business model digitalization and manufacturing process digitalization transformation on enterprise innovation efficiency [22]. Liu et. al. (2023) constructed quantitative indicators of digital transformation and analyzed its mechanism of action on green innovation efficiency of manufacturing industry [23]. These results have led to concrete results based on empirical data.
It can be seen that the research on cultural industry agglomeration, transformation and path has become the current hot spot, and many scholars have carried out a lot of valuable work in combination with the new industrial situation. In addition, around the industrial innovation efficiency, the measurement and influencing factors of innovation efficiency have achieved fruitful results, forming a number of representative achievements. However, the current research still has obvious shortcomings. First, most of the research mainly focuses on a certain aspect of practical problems, and has not yet formed a unified theoretical framework. Second, there is a lack of results that integrate cultural industry and innovation efficiency into the unified research horizon. As a new form of business, the cultural industry has the characteristics of high capital, high technology and high risk. Relying on innovation to drive the sustainable growth of the industry is the power source.
Therefore, the innovative performance of this study is as follows: first, it will take the innovation efficiency of the cultural industry as the research object, combined with the constraint situation of the “double carbon” goal, and select the industrial data for empirical analysis, which has the unique perspective. Secondly, static and dynamic innovation efficiency measurement methods are introduced to comprehensively estimate the innovation efficiency of cultural industry. To avoid the shortcomings of classical BCC and CCR models, the improved super efficiency DEA model is used to measure the static efficiency, and the Malmquist index model is used to measure the dynamic efficiency. Third, using the spatial econometric model to explore the multi-dimensional factors affecting innovation efficiency. The spatial spillover effect of innovation efficiency is investigated by using the spatial error model. This paper will provide theoretical and practical reference for cultural industry innovation.
Materials and Methods
Static Measurement Method of Innovation Efficiency in the Yangtze River Economic Belt Based on Super Efficiency Model
The measurement of innovation efficiency of cultural industry includes parametric and non parametric methods. Data envelopment analysis (DEA) is a widely used nonparametric estimation method. Since it does not need to preset the production function, it effectively avoids the bias of subjective estimation by constructing the production front and its effective observation points [24]. The most commonly used DEA models are CCR and BCC models proposed by Charnes et al. (1978) [25]. These two models can estimate the scale and technical effectiveness of multiple inputs and outputs of the evaluation object, and the “effective” result is assigned a value of 1.0. This feature is prone to the disadvantage that multiple effective samples cannot be further compared. Andersen and Pelesen (1993) put forward the improvement idea of “super efficiency model”: exclude the decision-making unit from the decision set, and then realize the efficiency value greater than 1.0. [26] In order to compare the innovation efficiency of different evaluation objects and avoid the phenomenon that the value of effective objects is all 1, this paper adopts the super-efficiency model to carry out the static evaluation of the innovation efficiency of cultural industry.
According to the relevant principles of the super efficiency model and relevant literatures, the modeling ideas are as follows [27]:
Step 1: Suppose there are n decision making units, and the input xij (i = 1, 2, ..., m) of each decision making unit j(j = 1, 2, ..., n) yields s output yrj (r = 1, 2, ..., s).
Step 2: The expression of the investment oriented variable return to scale super efficiency model.
Step 3:ζ0 represents the efficiency value of the decision unit. If ζ0 ≥1, the DMU is valid. If ζ0<1, the decision unit is invalid. γj represents the weight of the reconstructed effective DMU combination, and si– andsi+ represent the relaxation variables of DMU, respectively.
Dynamic Measurement Method of Innovation Efficiency in the Yangtze River Economic Belt Based on Malmquist Model
The super efficiency model is a static analysis method. In order to compare the changes of innovation efficiency in different sample periods, it is necessary to conduct a more in-depth study from a dynamic perspective. Malmquist index model mainly compares efficiency changes in different periods from a dynamic perspective, and can analyze the influence of different factors on efficiency changes through exponential decomposition. In this paper, panel data is used, the analysis objects involve multiple periods, and Malmquist index is highly suitable. This paper considers the introduction of Malmquist index model. Referring to the research of F ä re et al. (1994), Malmquist’s modeling idea is as follows [28]:
Step 1: Malmquist index model of global benchmark conditions.
Step 2: Malmquist exponential decomposition.
Step 3: further decomposition of EC index.
In the above formula,
(1) If
(2) If
(3) If
Spatial Spillover Effect Modeling of Cultural Industry Innovation Efficiency in the Yangtze River Economic Belt
The DEA model can effectively measure the innovation efficiency of the industry, but it can not reflect the factors affecting the efficiency. According to the spatial econometric theory of anselin [29, 30], there will be some attribute correlation in a certain regional spatial unit. Therefore, the introduction of spatial econometric model is considered for further analysis.
Spatial Autocorrelation Analysis
In order to test whether the variables affecting innovation efficiency have spatial correlation, Moran index is used to judge. Moran index is calculated as follows [31]:
In Equation (7),
Spatial Econometric Model
Spatial error model and spatial lag model are considered for the spatial effect of innovation efficiency. If the error term of the model has some spatial correlation, SLM model is more appropriate. If the spatial dependent factors between variables are very strong, then select the spatial lag model. Referring to relevant research, the expressions of the two models can be obtained [32]:
(2) Expression of spatial lag model:
In formula (8) and (9) above, xitj and yit represent the explanatory variable and the explained variable respectively, i represents the region, and t represents the period. ηit and ξit represent random error terms respectively, both of which are subject to normal distribution. In addition, β0 represents the intercept, ρ and λ represent the coefficients of the model respectively, and W represents the spatial weight matrix.
Index Selection and Data Source
Index Selection
Considering the characteristics of Chinese cultural industry innovation, the indicators of DEA model in this paper are mainly designed from two aspects of input and output. Referring to the results of existing research at home and abroad, and based on the principles of scientificity, rationality and data availability, RD investment, internal investment and R&D investment are selected as the first level indicators, while R&D personnel equivalent (RPD), r&d internal expenditure (IRF) and new product development expenditure (EPD) are selected as the corresponding second level indicators. The above indicators can fully reflect the quantity and quality of cultural industry innovation. In terms of output indicators, considering the two dimensions of economic output and scientific and technological output, RNs and nip are selected as secondary output indicators. Referring to the research of relevant scholars [33]- [35], the influencing factors of the spatial econometric model are selected as sulfur dioxide emissions in exhaust gas (SDE), investment completed in industrial pollution control (IPC), per capita GDP (AGDP), patent applications of domestic applicants (NPA), total printing of books published (100 million copies) (BPG) and total import and export volume of foreign-funded enterprises (TEF).
Table 1.
Descriptive statistical analysis results of spatial variables.
Data Sources
This paper selects the cultural industry of 11 provinces and cities in the Yangtze River economic belt as the research object, and the input, output and customs clearance data are from the statistical yearbook of Chinese culture and related industries (2015-2022). Environmental variables are from China Statistical Yearbook (2015-2022). The missing values are completed by linear interpolation. See Table 1 for the statistical analysis of environmental variables.
Results and Discussion
Results of Cultural Industry Innovation Efficiency in the Yangtze River Economic Belt Based on Super Efficiency Model
According to the algorithm of super efficiency DEA model, the results of innovation efficiency are calculated by Max DEA software, as shown in Table 2.
From the statistical results, the average innovation efficiency of all samples from 2015 to 2021 was 1.102, indicating that the innovation efficiency of the cultural industry in the Yangtze River economic belt was at an “effective” level, and the input of resource factors achieved high output, which matched the developed economic level of the Yangtze River Economic Belt. Specifically, the innovation efficiency of cultural industries in Jiangsu, Guizhou, Shanghai, Zhejiang, Yunnan and Sichuan are all greater than 1.0, which are 2.071, 1.714, 1.663, 1.054, 1.045 and 1.003 respectively. Jiangsu ranks first. The reason is that Jiangsu Province actively promotes the high-quality development of the cultural industry. For example, since 2020, the new forms of cultural industry in Jiangsu Province have shown positive growth, with an operating revenue of 239.5 billion yuan in 2020 and 309.9 billion yuan in 2021. Some enterprises attach importance to integrating traditional cultural genes into the Internet. Taking friendship time company as an example, it actively carries out product innovation and will “move” IP games with Suzhou characteristics, such as “Ten Views of the canal” and Humble Administrator’s garden. Hubei, Hunan and Jiangxi ranked lower, with 0.727, 0.604 and 0.493 respectively, less than 0.8, indicating that there is a large problem of insufficient redundant output. Therefore, for these regions, it is necessary to further explore the deep-seated reasons and promote the high-quality innovation of the cultural industry.
From the perspective of time dimension, from 2015 to 2021, the average innovation efficiency of cultural industry in the Yangtze River economic belt was 1.088, 1.186, 1.106, 1.161, 1.200, 0.980 and 0.996, respectively. The overall average was greater than 1.0, showing an overall “inverted U” trend of increase first and then decrease. From 2015 to 2019, the average value of the cultural industry in the Yangtze River economic belt was greater than 1.0, and decreased sharply in 2020 and 2021, with the average value less than 1.0. From the specific reasons, the innovation efficiency of cultural industry in the Yangtze River economic belt has been impacted by the adverse impact of the new crown epidemic, but the impact is small, and the average value in the two years is close to 1.0. This reflects that the cultural industry, as a green economy and asset light industry, has strong innovation toughness. Therefore, this further confirms that vigorously encouraging and developing the cultural industry is an important direction to achieve green transformation, energy conservation and emission reduction.
Innovation Efficiency of Cultural Industry in the Yangtze River Economic Belt Based on Malmquist Model
In order to explore the dynamic changes of the innovation efficiency of the cultural industry in the Yangtze River economic belt, the Malmquist index related results from 2015 to 2021 are calculated by using the input oriented Malmquist index model with variable returns to scale.
Table 2.
Statistics of innovation efficiency of cultural industry in the Yangtze River Economic Belt.
From the analysis of the overall Malmquist index results, during the sample period, the average innovation efficiency of the cultural industry in the Yangtze River economic belt was 1.123, indicating that the overall efficiency showed an upward trend, indicating that the innovation and development of the cultural industry were encouraged and supported, and the innovation level of the industry increased year by year. Among them, Chongqing, Jiangxi, Jiangsu, Hunan and Hubei have the highest Malmquist index, which are all greater than 1.1, with an average of 1.203, 1.129, 1.116, 1.115 and 1.114, respectively. This shows that the cultural industry in these provinces and cities is growing rapidly and has great development potential. Only the Malmquist index of Yunnan and Guizhou is less than 1.0, which are 0.981 and 0.922 respectively. This shows that the growth of cultural industry innovation efficiency in these two provinces is weak, which may be due to the lack of resource endowment in these two regions, which urgently needs policy and market reform support.
Further, from the analysis of different periods, the Malmquist index in 2015-2016, 2016-2017, 2017-2018, 2018-2019, 2019-202 and 2020-2021 periods were 1.075, 0.937, 1.081, 0.947, 1.193 and 1.247 respectively, showing a “U-shaped” volatility characteristic of first decreasing and then increasing, then decreasing and then increasing. This shows that the innovation efficiency of cultural industry in the Yangtze River economic belt is affected by many factors, and it is necessary to further explore.
Fig. 1.
Innovation efficiency Mi index and its decomposition of cultural industry in the Yangtze River Economic Belt.
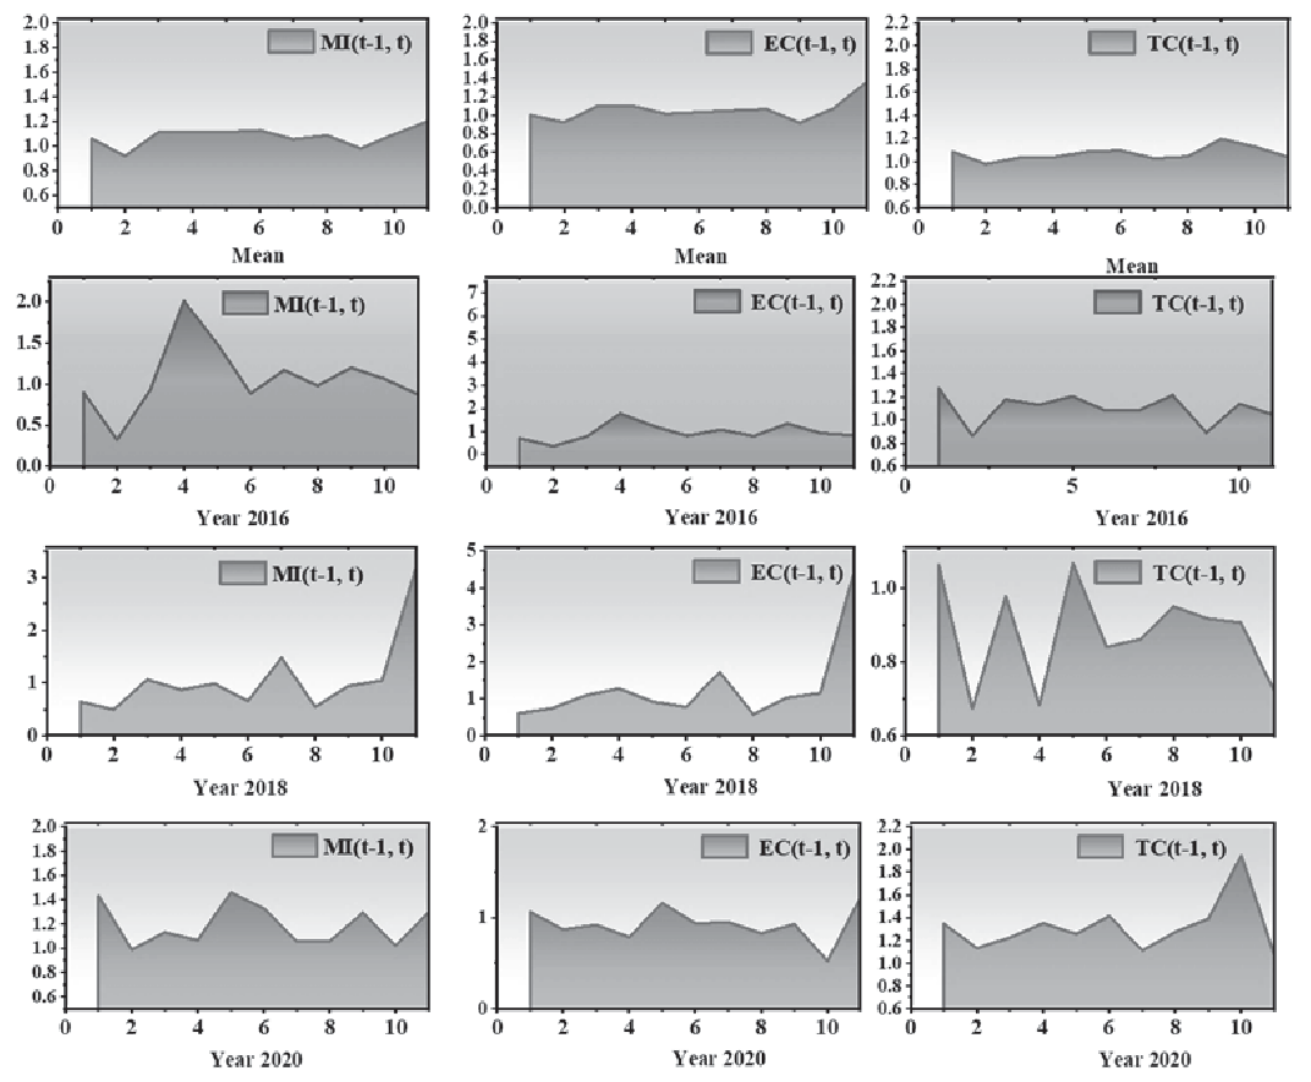
Fig. 1 shows the results of innovation efficiency and its decomposition. According to the statistical results, the mean value of mi (t-1, t) is 1.080, and the mean values of EC (t-1, t) and TC (t-1, t) are 1.059 and 1.068, respectively, showing that EC (t-1, t)<tc (t-1, t). This shows that the technological progress index has reached the technological change index, which reflects that the Yangtze River Economic Belt attaches importance to the role of innovation factors in the cultural industry, and has improved the innovation efficiency of the industry by digesting, introducing and improving new technologies. Limited by space, the results of 2015-2016, 2017-2018 and 2019-2020 are selected for analysis. As shown in Figure 1, from 2015 to 2016, the mean values of mi (t-1, t), EC (t-1, t) and TC (t-1, t) were 1.075, 0.973 and 1.101 respectively. EC (t-1, t)<tc (t-1, t), and the efficiency index of technological progress was larger than that of technological change; From 2017 to 2018, the mean values of mi (t-1, t), EC (t-1, t) and TC (t-1, t) were 1.081, 1.297 and 0.878, respectively. EC (t-1, t)>tc (t-1, t), and the efficiency index of technological progress was less than that of technological change; From 2019 to 2020, the mean values of mi (t-1, t), EC (t-1, t) and TC (t-1, t) were 1.193, 0.926 and 1.320, respectively. EC (t-1, t)<tc (t-1, t). The efficiency index of technological progress was greater than the technological change index, but the technological change index was less than 1.0, which needed to be optimized. Therefore, it can be seen that the growth of the efficiency level of the cultural industry in the Yangtze River economic belt is affected by both the technological progress index and the technological change index, and the degree of their role shows heterogeneity in different periods. It will be a valuable work to focus on promoting the innovation efficiency of the cultural industry from the two directions of technology and scale.
TC Index of Cultural Industry in the Yangtze River Economic Belt and Its Decomposition
Previous studies have proved that TC index has a significant impact on innovation efficiency change. In order to explore the specific reasons affecting the change, the TC index can be further decomposed.
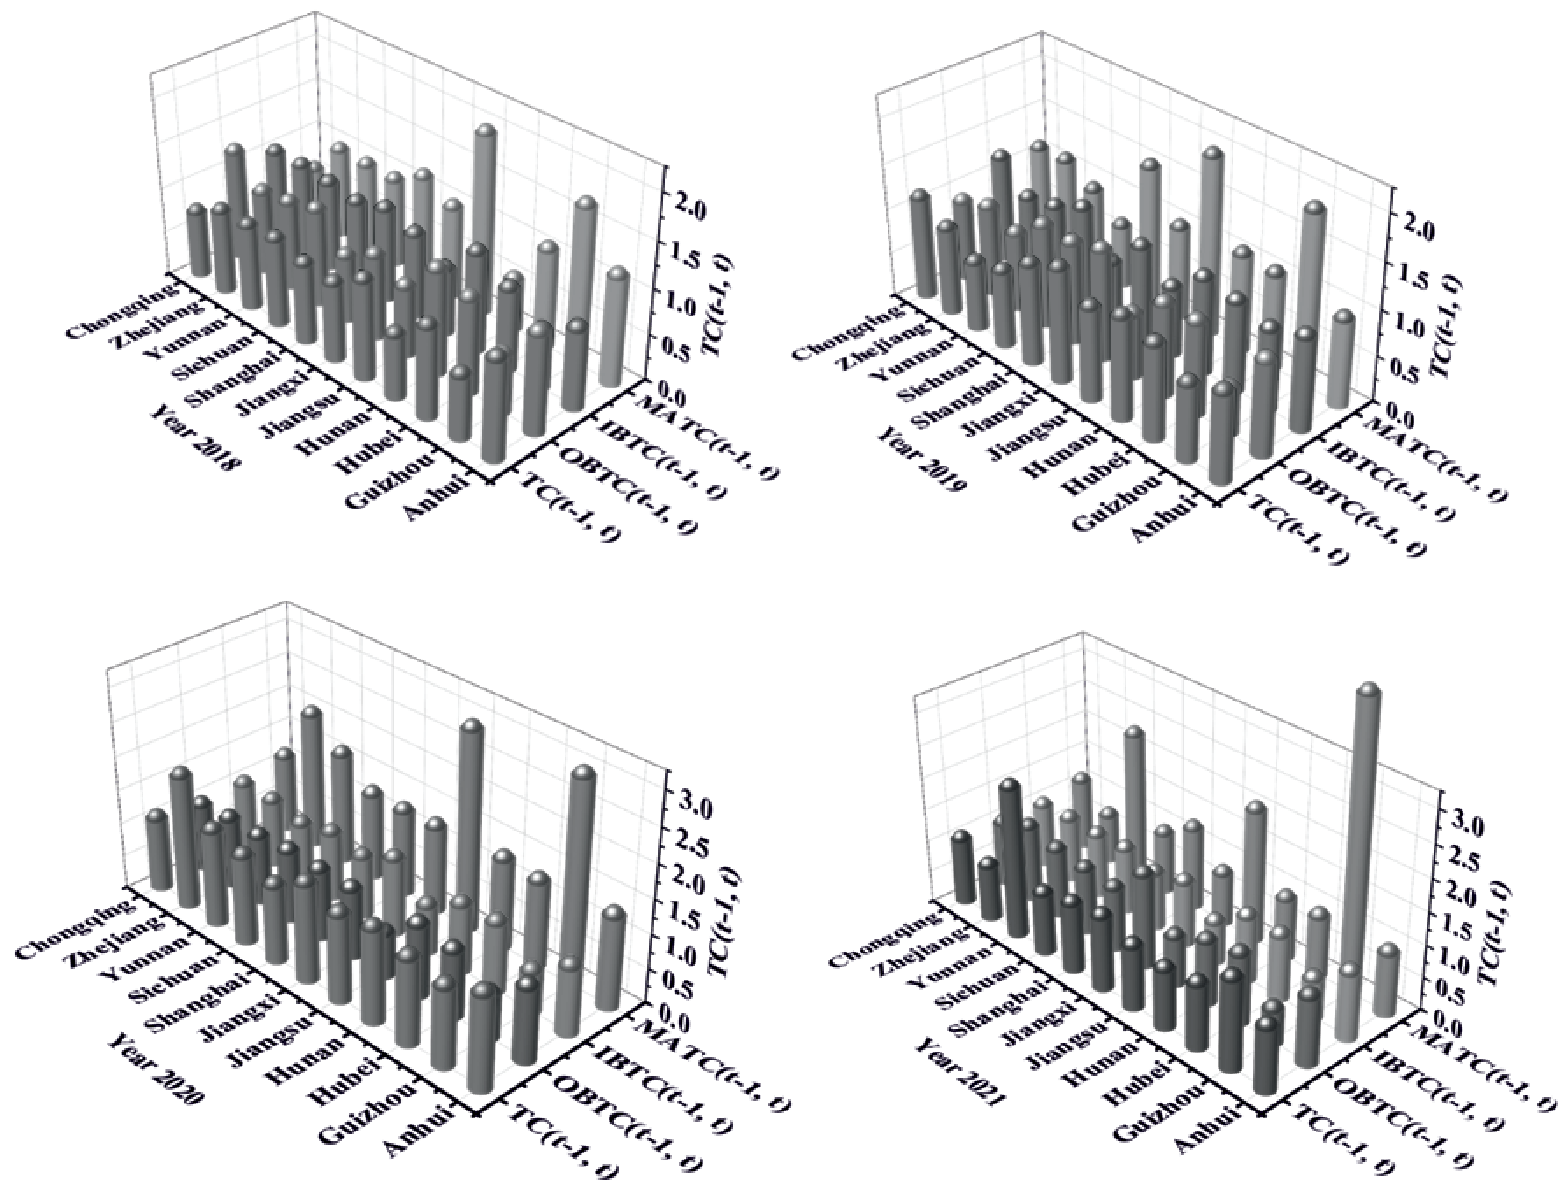
As shown in Fig. 2, through the decomposition of TC index, taking 2021 as an example, the mean values of TC(T-1, t), OBTC(T-1, t), IBTC(T-1, t) and MATC(T-1, t) are 1.133, 0.990, 0.907 and 1.487 respectively. It can be seen from the results that both TC(T-1, t) and MATC(T-1, t) are greater than 1.0. Both OBTC(T-1, t) and IBTC(T-1, t) are less than 1.0. This indicates that the TC index is mainly driven by the factors of technological progress, and the relationship with the input and output technology migration is not obvious. Through the above analysis, it can be seen that attaching importance to technological progress plays an important role in promoting the improvement of innovation efficiency. This is consistent with the previous results.
Discussion on Spatial Clustering of Cultural Industry Innovation Super Efficiency in the Yangtze River Economic Belt
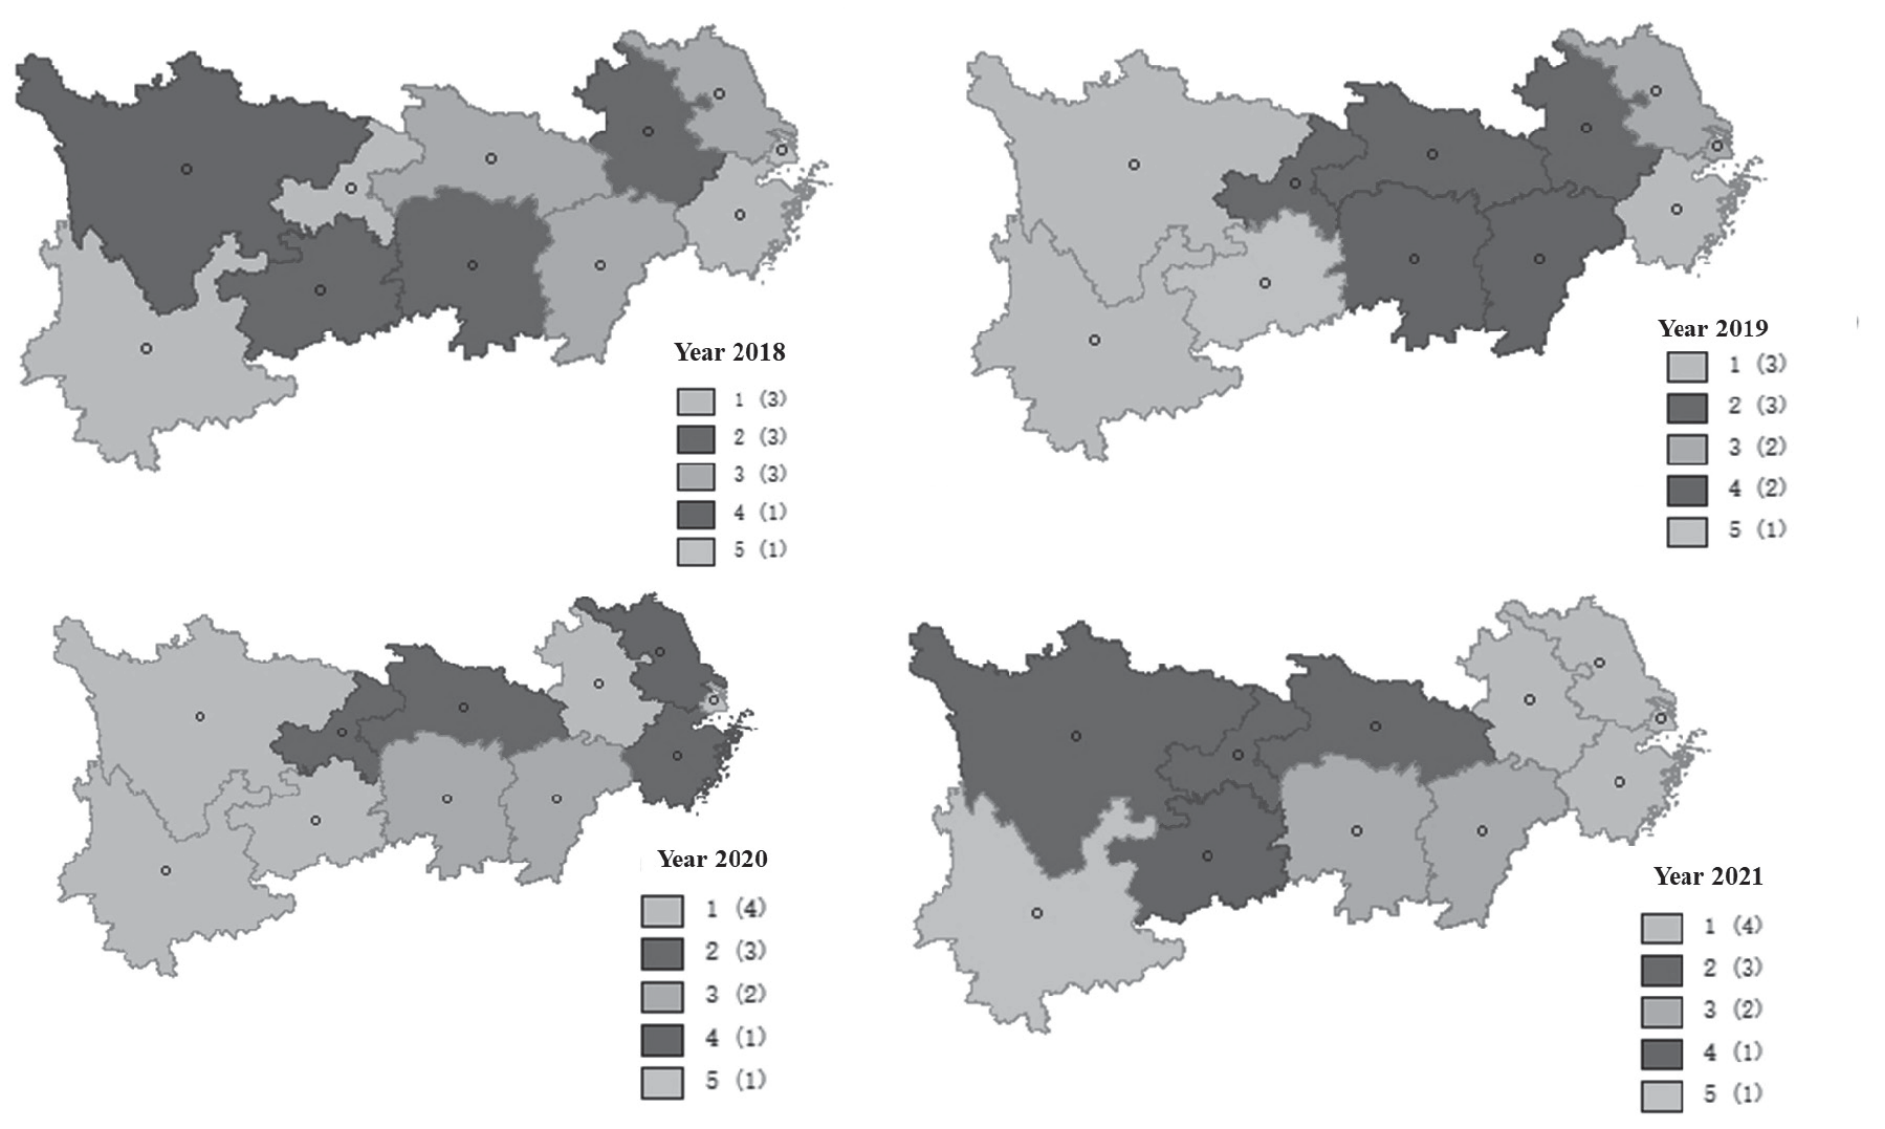
In order to compare the regional heterogeneity of cultural industry innovation efficiency in the Yangtze River economic belt, the kmeans spatial clustering method is introduced to obtain the results in Fig. 1. The model adopts the method of random iteration, and the initialization repeated run is set to 150 at this time. The maximum number of iterations is 1000, and the data conversion adopts the standardized method.
As shown in Fig. 3, taking 2021 as an example, after clustering, the innovation efficiency of cultural industry in the Yangtze River economic belt is divided into five groups. Shanghai, Jiangsu, Zhejiang and Anhui are the first group, belonging to the high high aggregation category; Chongqing, Sichuan and Hubei are the second group, belonging to the high medium cluster; Hunan and Jiangxi are the third group, belonging to the middle middle cluster; Guizhou is the fourth group, belonging to the middle oligomeric group; Yunnan is the fifth group, belonging to low oligomeric group. Similar analysis can be performed for other years. From the analysis results and the distribution in Fig. 2, it can be seen that the cultural industry in the Yangtze River economic belt has significant spatial heterogeneity. This is consistent with the previous results.
Analysis on the Spatial Spillover Effect of Cultural Industry Innovation Efficiency in the Yangtze River Economic Belt
Spatial Correlation Analysis
First, the correlation analysis of variables affecting innovation efficiency. As shown in Fig. 2, through the calculation of univariate spatial Moran index for multiple variables, it is found that the variables have significant spatial autocorrelation. The Moran ‘I indexes of SDE, IPC, BPG, agdp, NPA and TEF were 0.395, 0.129, 0.190, 0.528, 0.350 and 0.426, respectively, which were significantly positive.
Secondly, the global spatial autocorrelation analysis was carried out. After 1000 iterations, Moran ‘I index was 0.231431, expected index: -0.100000, variance was 0.027851, P value was 0.017, showing significance at 1% level. Therefore, through the above analysis, it can be concluded that there is a significant spatial autocorrelation between the influencing factors of cultural industry innovation efficiency in the Yangtze River economic belt, and it is necessary to analyze its spatial spillover effect.
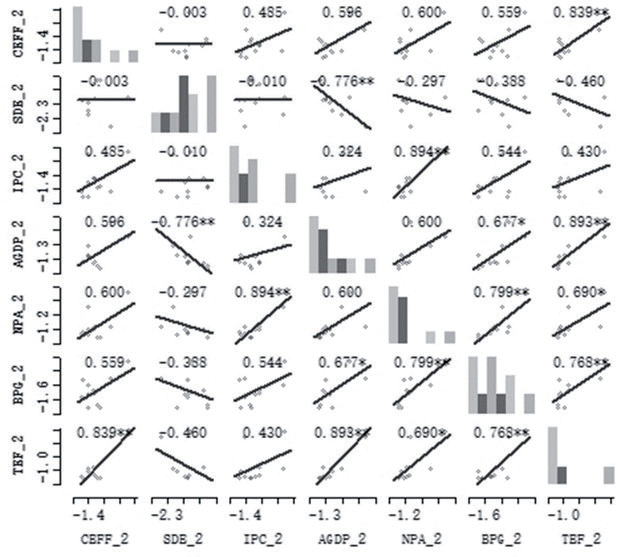
Finally, pairwise autocorrelation analysis of variables is performed, and the relevant results are shown in Fig. 4. As shown in Fig. 3, the correlation coefficient between CBEF and TEF is 0.839, which passes the significance test at 1% level. The correlation coefficient between SDB and AGDP is -0.776, which is significantly negative. The correlation coefficient between IPC and NPA was 0.894, which passed the significance test at 1% level. Therefore, the existence of spatial autocorrelation between different variables is further verified.
Analysis of Spatial Spillover Effect
According to the setting method of spatial econometric model, this paper uses geoda software for empirical calculation. Since geoda software mainly analyzes the cross-sectional data, this paper selects the data from 2015 to 2021 for spatial econometric test.
Taking the data of 2021 as an example, Table 5 reflects the relevant results of the spatial error model. From the statistical results, the R-squared of the model is 0.9861080, greater than 0.95, indicating that the model fits well. The likehood ratio test value was 10.2588, P value was 0.001, which was significant at 1% level. This shows that the effect of using spatial error model is good.
According to the relevant results in Table 4, from the spatial statistical results:
(1) Sulfur dioxide emissions in exhaust gas have a significant impact on the innovation efficiency of cultural industry in the Yangtze River economic belt. The coefficient of SDE was -0.0121565, P = 0.024, which was significant at the level of 5%. This shows that the lower the sulfur dioxide emission in the exhaust gas, the higher the innovation efficiency of the cultural industry. Sulfur dioxide emissions often reflect the agglomeration of traditional high energy consuming industries. As a green and emerging industry, the cultural industry has certain requirements for the green environment. The green requirements of traditional industrial pollution gathering areas and cultural industries do not match. Therefore, the development of cultural industry is conducive to forcing the transformation and upgrading of traditional economy, improving quality and efficiency.
(2) The investment in industrial pollution control has a significant positive impact on innovation efficiency. The coefficient of IPC was 0.0000071, std. error was 0.0000022, P value was 0.001, which passed the significance test of 1% level. This shows that strengthening industrial pollution control can effectively improve the innovation efficiency of cultural industry. By strengthening the control of industrial environmental pollution, improving the ecological environment, and creating a healthy, comfortable and green leisure and entertainment environment, we can promote the temporal and spatial agglomeration of the cultural industry, accelerate the internal and external flow of factors, improve the comprehensive benefit level of the cultural industry, and realize the improvement of the innovation efficiency of the cultural industry.
(3) Per capita GDP has a significant positive impact on innovation efficiency. According to the statistical results, the coefficient of agdp was 0.0000119, the standard error was 0.0000045, and the p value was 0.008, which passed the significance test of 1% level.
(4) The impact of the number of patent applications of domestic applicants on innovation efficiency is significantly positive, passing the significance test of the 5% level. NPA can reflect the level of scientific and technological innovation in different regions. The higher the level, the stronger the innovation ability. It is more conducive to the cultural industry to gather relevant talents and provide the level of innovation efficiency.
Table 3.
Spatial error model (2021).
(5) The influence coefficient of book publishing on the innovation efficiency of cultural industry is negative. The possible reason lies in the transformation of the traditional book publishing industry under the impact of the digital economy. The greater the number of books published, the slower the digital transformation, and the possible redundancy of some resources, which will have a certain adverse impact on the innovation of the cultural industry.
(6) The total import and export volume of foreign-funded enterprises has a positive impact on innovation efficiency. TEF reflects the level of foreign investment in the region. It is generally believed that the more foreign investment, the more vitality of the economy, and the cultural industry can obtain sufficient funds, talents and other factors, so as to promote the improvement of industrial efficiency.
The results of further constructing the spatial lag model show that SDE, IPC, agdp, BPG and TEF have a significant impact on the innovation efficiency of cultural industry in the Yangtze River economic belt. The results are consistent with the results of the spatial error model, indicating that the spatial model is robust.
Conclusions
Under the severe environment of environmental pollution, ecological destruction and climate warming, the Chinese government has put forward the goal of “double carbon” to systematically solve the environmental crisis. The development of cultural industry has become a new direction. This paper mainly studies the innovation efficiency of cultural industry in the Yangtze River economic belt from 2015 to 2021, and constructs the static and dynamic analysis models respectively. In order to deeply explore the internal and external factors driving innovation efficiency, build a spatial econometric model, and systematically analyze the impact of the external environment. The main conclusions are as follows:
(1) The overall innovation efficiency of the cultural industry in the Yangtze River economic belt is high, but there is significant spatial heterogeneity. From 2015 to 2021, the average innovation efficiency of all samples was 1.102. From the time dimension, it shows an overall “inverted U” fluctuation trend of first increasing and then decreasing.
(2) The average Malmquist index of the innovation efficiency of the cultural industry in the Yangtze River economic belt is 1.123, implying the continuous improvement of the level of industrial innovation. From the specific results, the Malmquist index of Chongqing, Jiangxi, Jiangsu, Hunan and Hubei is the highest, all greater than 1.1, and the average value is 1.203, 1.129, 1.116, 1.115 and 1.114, respectively.
(3) Environmental factors such as sulfur dioxide emissions in waste gas, investment in industrial pollution control, and per capita GDP have a significant impact on the innovation efficiency of cultural industry in the Yangtze River economic belt. The coefficient of SDE was -0.0121565, P = 0.024, which was significant at the level of 5%. This shows that the lower the sulfur dioxide emission in the exhaust gas, the higher the innovation efficiency of the cultural industry. The coefficient of IPC was 0.0000071, std.error was 0.0000022, P value was 0.001, which passed the significance test of 1% level. This shows that strengthening industrial pollution control can effectively improve the innovation efficiency of cultural industry.
Finally, in order to promote the innovation level of Chinese and foreign literature, novels, book publishing, entertainment and leisure services and other cultural industries, this paper puts forward the following suggestions:
(1) Increase technological innovation to drive innovation efficiency. There is spatial heterogeneity in static innovation efficiency of cultural industry innovation in the Yangtze River Economic Belt, and it is necessary to narrow regional differences through technological input.
2) Increase fiscal, financial, and tax policy support. The overall dynamic efficiency of the cultural industry in the Yangtze River Economic Belt is greater than 1.0, and it is necessary to continuously increase policy support to help the industrial transition.
(3) Create a green, environmentally friendly and harmonious business environment. Industrial waste and other factors have a negative impact on the innovation of cultural industries in the Yangtze River Economic Belt, and it is necessary to continue to do a good job in pollution control and environmental protection.

