

Introduction
The judicious exploitation and conservation of rural wetland resources, as integral components of ecological assets, are imperative for rural rejuvenation. The Millennium Ecosystem Assessment by the United Nations delineates that approximately 60 percent of vital wetland ecosystem services are in a state of progressive deterioration. This decline impinges on the robustness of wetland ecosystems and poses a considerable threat to global ecological security. Precise valuation of wetland ecological products constitutes the cornerstone for devising policies conducive to sustainable regional development and the rational dispensation of resources [1]. The Global Conservation Strategy underscores the significance of wetlands alongside forests and oceans as cardinal ecosystems. Wetlands are reservoirs of vital material products and provide a plethora of ecosystem services, including hydrological balance, biodiversity conservation, and recreational opportunities. Recent reports from the Intergovernmental Panel on Climate Change (IPCC) predict that global temperatures will rise by at least 4°C in the 21st century, accompanied by a rapid increase in extreme weather events such as heatwaves and droughts. These changes will significantly impact the sustainability and stability of wetlands and the social and ecological systems in China’s ecologically fragile areas. Moreover, many of the ecological products provided by wetlands are not directly marketable and possess the characteristics of public goods [2]. This often leads to the neglect or underestimation of their value due to measurement challenges, contributing to widespread wetland degradation, water quality pollution, and other environmental issues. Recognizing the ecological benefits of wetlands more intuitively through scientific visualization is crucial for promoting green development in rural areas and enhancing local livelihoods [3]. To support the sustainable use of wetland resources, the national government has been refining the wetland protection system. This includes establishing a quantitative protection target that adheres to the ecological red line of 800 million mu of wetlands, progressively enforced through legislation [4]. In April 2021, the General Office of the Central Committee of the Communist Party of China advanced the green development goal of setting standards for the valuation and realization paths of ecological products, aiming to transform “green mountains” into “golden mountains.” Following this, in December 2021, the Thirty-second Session of the Thirteenth National People’s Congress enacted the Wetland Protection Law of the People’s Republic of China [5]. Therefore, researching the valuation and realization of wetland ecological products aligns with national strategic development objectives and is essential for enhancing wetland environmental protection and fostering a beautiful China.
In the wake of the progressive application of the “two mountains” theory, a burgeoning body of scholarly work has emerged within the domestic sphere. This corpus of research encompasses a diverse range of foci, including the conceptual delineation of ecological products [6-11], their classification [12-17], and the dynamics of their provision [18-23]. Additionally, significant inquiry has addressed the valuation of ecological products alongside the methodologies of such valuation [24-29], as well as the pathways to actualize their economic potential [30- 32]. Predominantly, these investigations have adopted a macro-qualitative lens to dissect the underpinnings of eco-product mechanisms. Regarding the economic assessment of eco-products, prevalent studies have utilized Gross Ecosystem Product (GEP) accounting, employing objective metrics for valuation [33-36]. Notably, this body of research has not adequately accounted for the variance among identical ecosystems at differing junctures of eco-development. Epistemologically, value is construed as a relational construct reflecting the capacity of an entity to fulfill the requisites of an evaluating subject, representing a philosophical categorization that articulates the utility, advantage, or efficacy intrinsic to the interplay between an entity’s characteristics and functions and the subject’s demands. The prevailing methodologies, such as the GEP accounting framework, fall short in capturing the subjective valuation nuances perceived by the public in relation to wetlands undergoing distinct phases of ecological development. This omission precludes a comprehensive depiction of how different stages of ecological maturity differentially impact the perceived value of wetland ecological products. Consequently, there is an encumbrance to furnishing adequate theoretical sustenance and policy guidance requisite for transmuting wetland resources into tangible wetland assets.
This study focuses on the Weishui Wetland in Songzi City, Hubei Province, specifically examining its mature stage of ecological construction within a homogeneous land category. The study makes several marginal contributions: Firstly, it extends beyond the conventional analysis of the relationship between land types (wetland, arable land, forest land, etc.) and their value accounting and realization. It acknowledges that as ecological construction advances, there are pronounced differences in landscape planning, transportation infrastructure development, integration of ecological agriculture with culture and tourism, and ecological brand development. This research, therefore, uses the Weishui Wetland in its mature stage as a primary case study, employing appropriate valuation methods to assess its value based on stage-specific characteristics and exploring the pathways for realizing the value of its production products in terms of realization period and degree. Secondly, in terms of methodology, while many scholars have focused on the perceived value differences of wetland ecological products at various stages using the Gross Ecosystem Product (GEP) method, they have not fully captured the nuanced impacts of different ecological construction stages on the value of these products. This study proposes a differentiated accounting approach tailored to the specific characteristics of the Weishui Wetland, which enhances the existing methods for ecological product value accounting and improves the precision and scientific rigor of these assessments. Lastly, concerning the research scale, whereas many scholars begin their analyses at broader provincial, municipal, and county levels encompassing entire ecosystems, this study narrows its focus to micro-regional levels and specific land types within Songzi City, thereby broadening the scope of research to include detailed examinations of localized ecological phenomena.
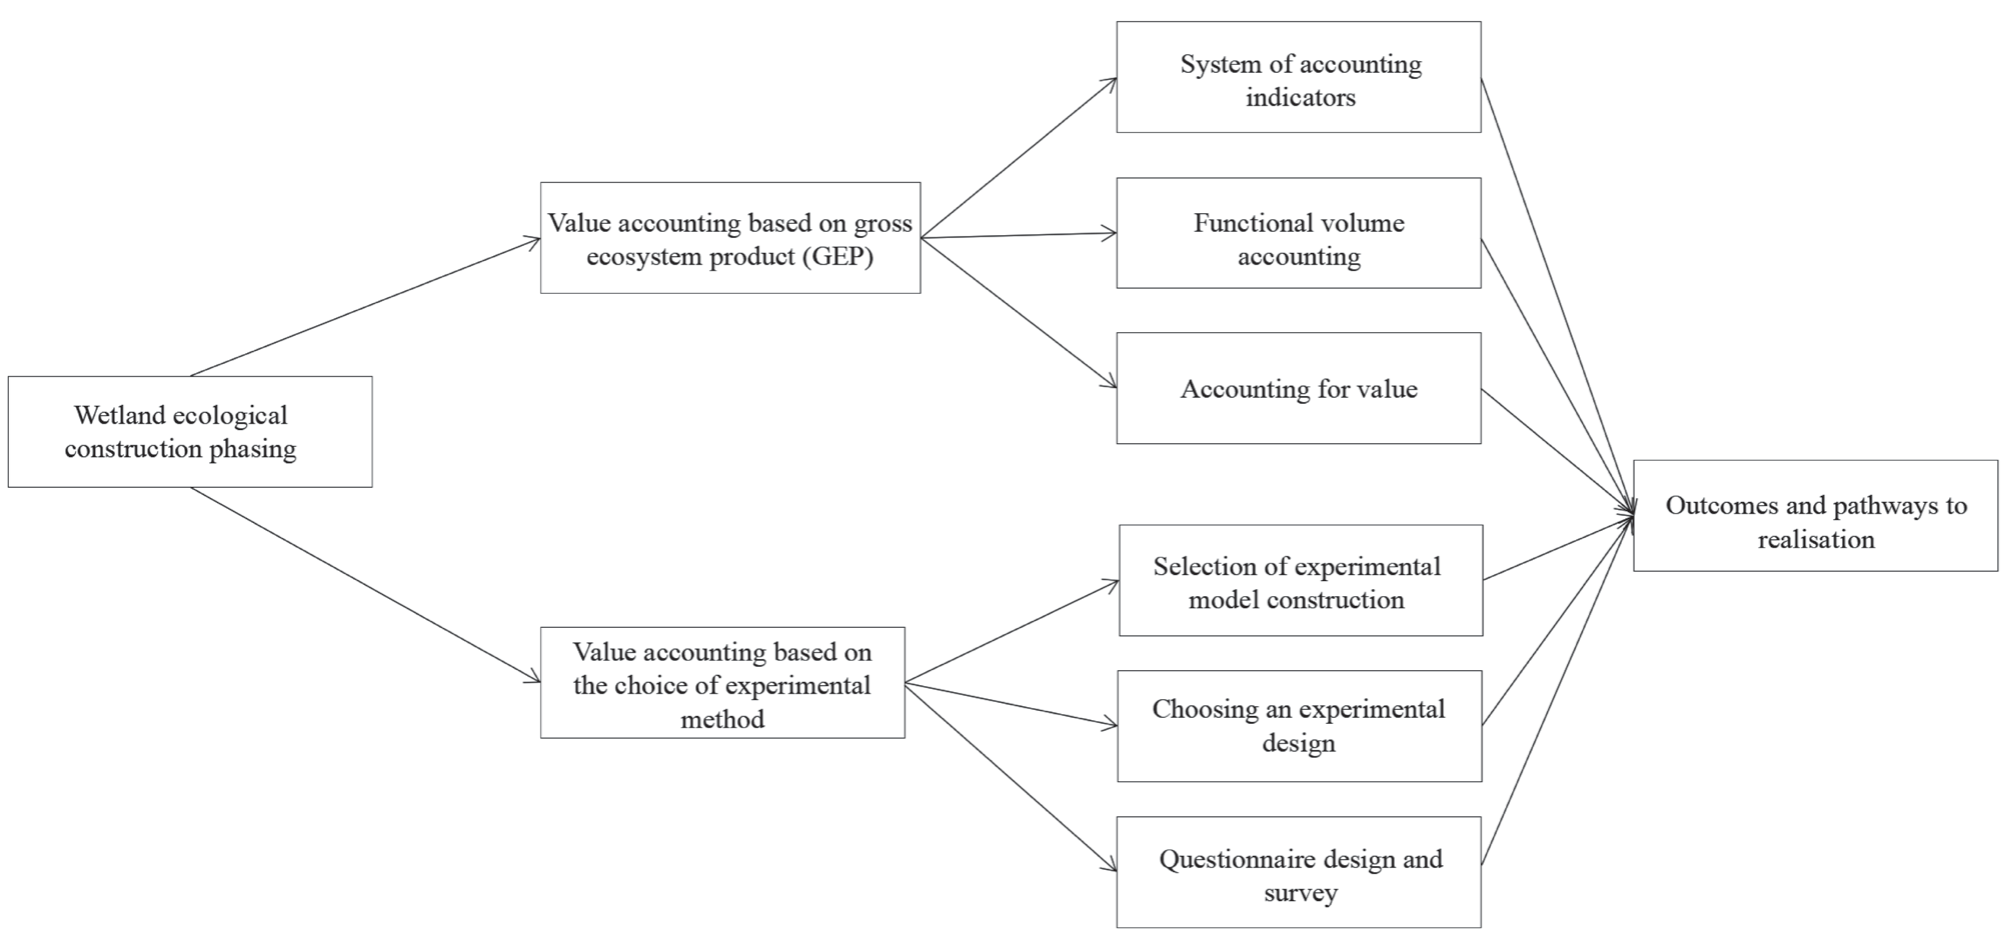
The remainder of the paper is organized as follows: Section 2 contains materials and methods; Section 3 analyzes the results and realization paths; Section 4 is dedicated to discussion, and Section 5 concludes the paper. The specific processes and methods employed are depicted in Fig. 1.
Materials and Methods
Overview
The wetlands selected for this study are situated in Songzi City, Hubei Province. This region, located in the southwest of Hubei and the middle and upper reaches of the Yangtze River, boasts an extensive river system and a rich endowment of ecological resources. In 2019, Songzi City was designated as one of the nine pilot areas in Hubei Province for exploring ecological product value realization pathways. Within this context, WeiShui Wetland was chosen as the pilot site for the city’s initiatives due to its robust environmental foundation and its considerable ecological and economic importance.
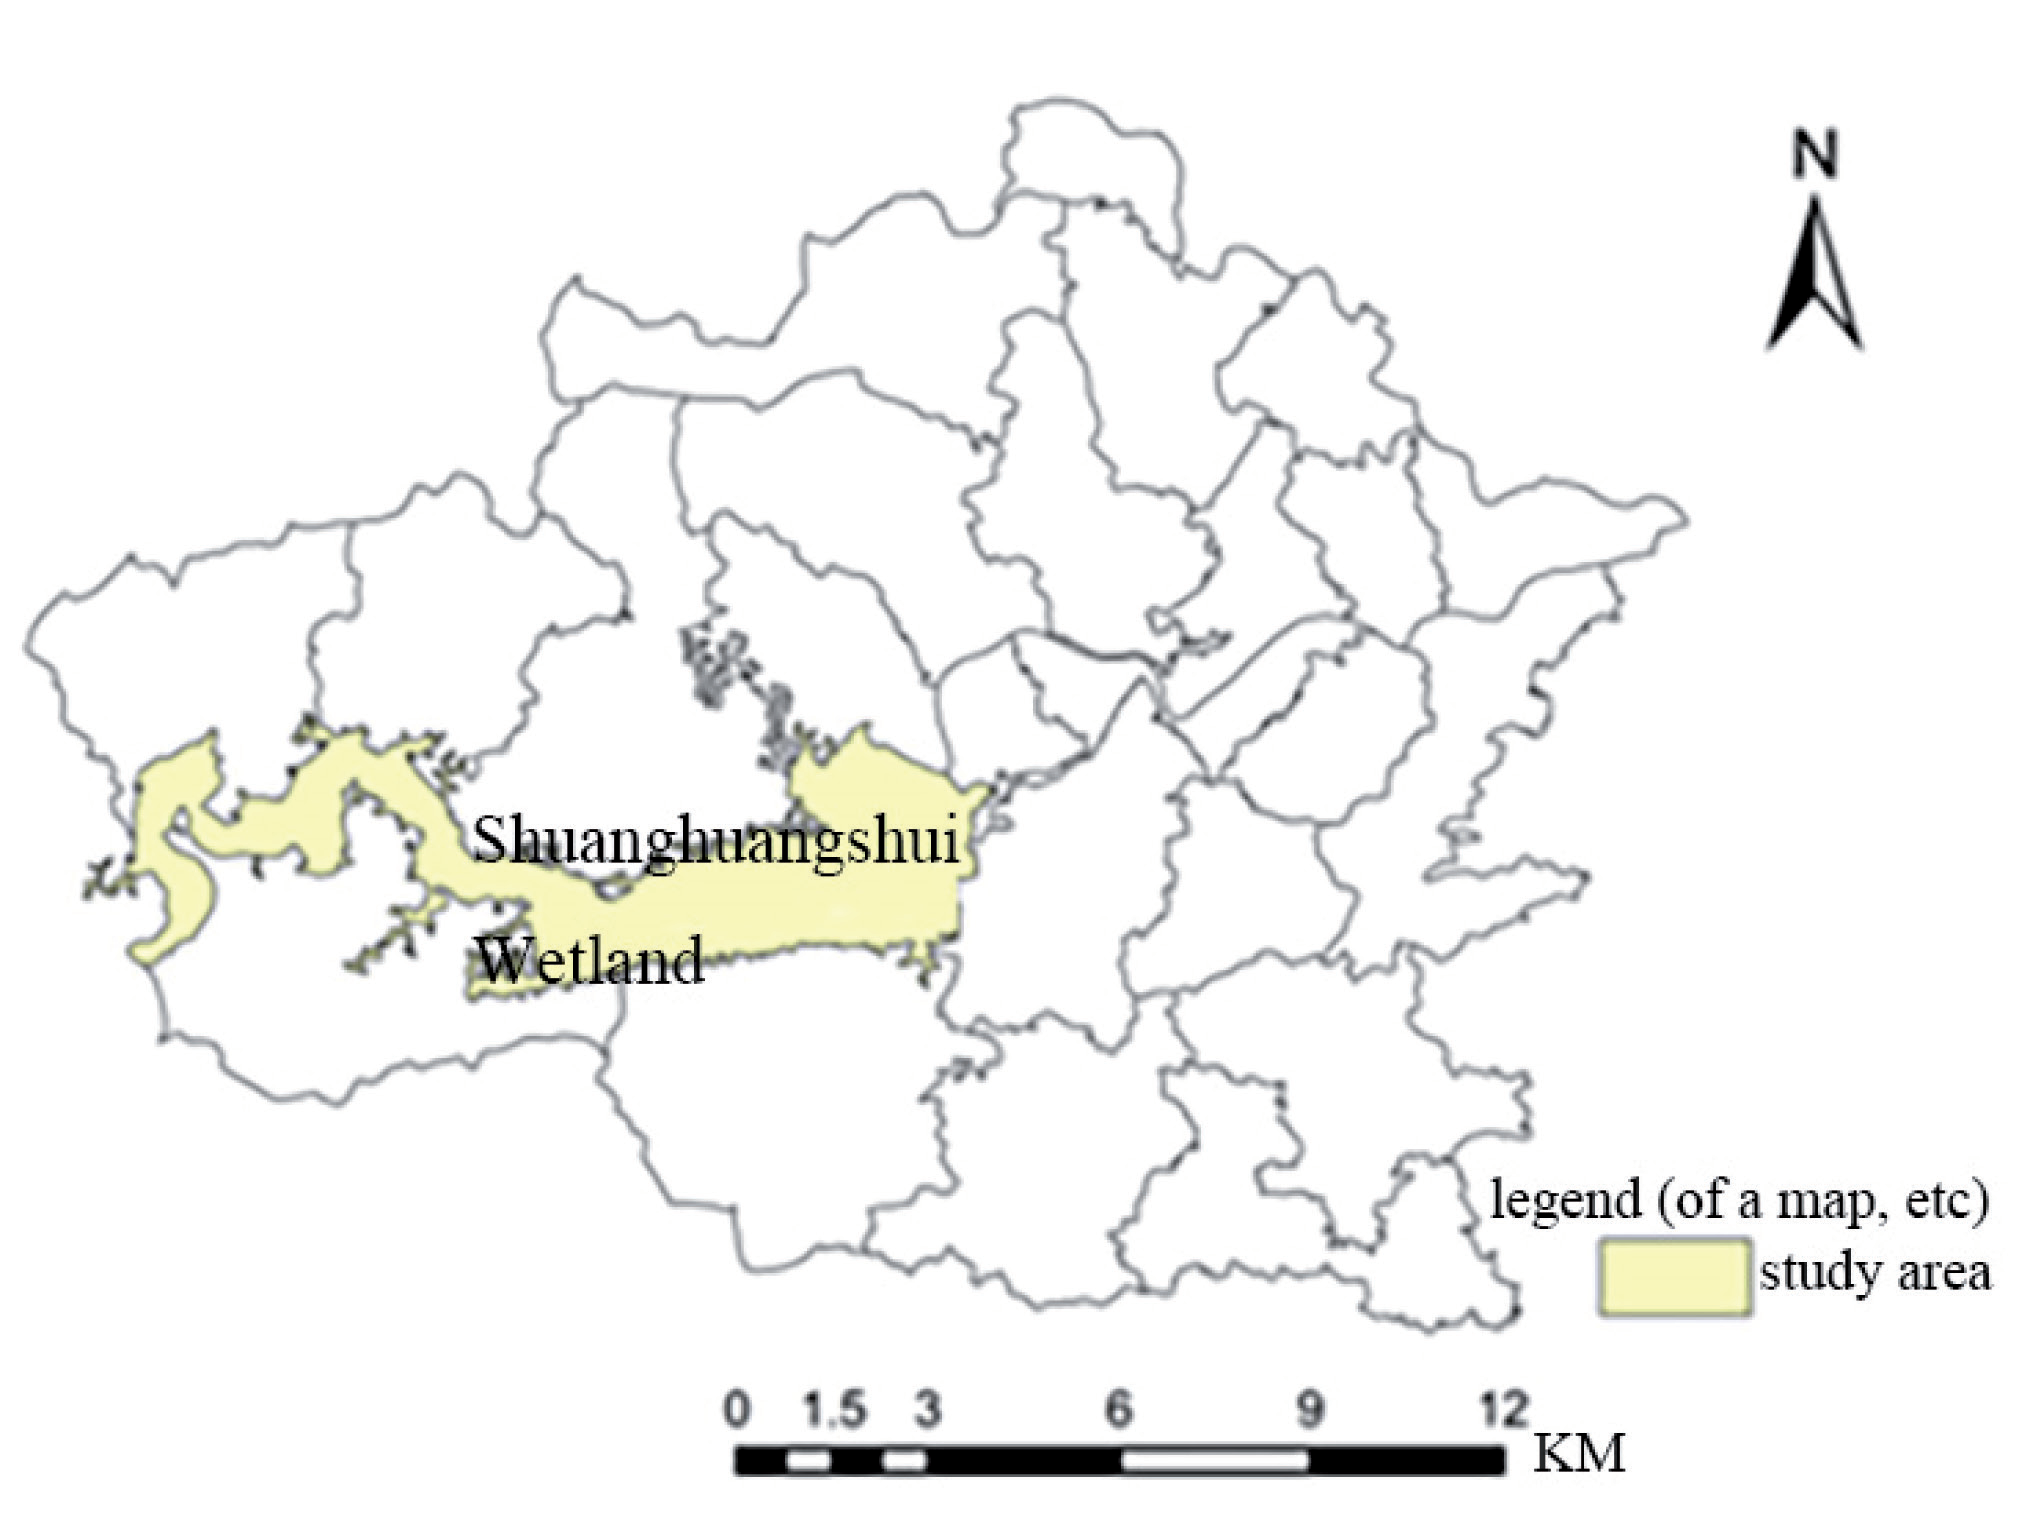
The WeiShui Wetland, positioned in the Tsombe River Basin’s middle reaches within the town of Tsombe, southwestern Songzi City, encompasses an area of approximately 2,271.20 hectares. The region experiences an average annual precipitation of 1,250 mm. It includes the villages of Zhangmuxi, Beijia, Beizha, Wangmayan, Longwangdang, and the vicinity of the WeiShui Reservoir Project Management Bureau (Fig. 2). The predominant wetland type in this area is the reservoir pond, which accounts for 97.7% of the total area. This region hosts a reservoir water system and boasts a relatively intact and biodiverse wetland ecosystem, underpinning its significant ecological value. Since 2013, substantial investments have been made in water source protection and the development of eco-tourism. Over the years, these efforts have transformed the WeiShui Wetland into a crucial ecological buffer for Songzi City. Currently, with clear developmental benefits, the wetland was recognized in 2020 as a wetland of national importance and is considered to be in the mature stage of ecological development.
Data Sources
Considering the mature ecological construction stage of the WeiShui Wetland and the availability of data, this study categorizes the relevant data into two main types: Firstly, statistical data are primarily used for valuing the ecological products of the WeiShui Wetland. This includes data on supply products, regulating services, and cultural services associated with fishery production. These quantitative data are sourced from publications such as the “WeiShui Township Statistical Yearbook (2020)”, the “Hubei Songzi WeiShui National Wetland Park Master Plan”, and the “Hubei Province Water Resources Bulletin (2020)”. Secondly, research data involve the subjective valuation of the wetland’s ecological products. This valuation is derived from a questionnaire survey that assesses respondents’ willingness to pay, thereby calculating the value of ecological products. This approach ensures that both objective and subjective aspects of value are integrated, providing a comprehensive assessment of the WeiShui Wetland’s ecological contributions.
Ecological Construction Phases
This study assesses the WeiShui Wetland in nine key areas through field research, categorizing it as a mature stage of ecological construction. The areas analyzed include water quality, landscape planning, transportation, integration of ecological agriculture with tourism, ecological branding, tourist volume, investment in construction, residents’ happiness, and perceptions of the wetland’s ecology. (Table 1)
Accounting for the Value of Ecological Products in the WeiShui Wetland
The WeiShui Wetland, presently at a mature stage of ecological construction, provides an opportunity to gather objective data. Therefore, this study utilizes the objective Gross Ecosystem Product (GEP) method alongside the subjective Choice Experiment (CE) method to scientifically quantify the ecological product value of the WeiShui Wetland. These methods are effectively applied given the wetland’s advanced stage of ecological development.
Value Accounting Based on Gross Ecosystem Product (GEP)
First, the system of accounting indicators:
Currently, the valuation of ecological products in China typically includes the value of ecosystem provisioning products, the value of ecosystem regulation services, and the value of ecological and cultural services, following the standards outlined in the “Technical Guidelines for Accounting for the Gross Product of Terrestrial Ecosystems” [37, 38]. Accordingly, this study adopts two dimensions—functional and value quantities—to accurately account for the value of ecological products. Specifically, the valuation of ecological products from the WeiShui Wetland not only quantifies the intrinsic value of the green hills and mountains scientifically but also provides theoretical support for realizing the value of ecological products. Moreover, this approach is a critical representation of the construction of ecological civilization and sustainable development [39-41]. The indicator system used for accounting the Gross Ecosystem Product of the WeiShui Wetland includes three primary indicators and nine secondary indicators covering supply, regulation, and cultural service functions (Table 2).
Table 1.
Division of the construction phase in which the WeiShui Wetland is located.
Table 2.
Indicator system for accounting ecological products of WeiShui Wetlands.ivision of the construction phase in which the WeiShui Wetland is located.
Second, functional volume accounting:
The accounting of functional volume for the ecological product value of the WeiShui Wetland encompasses three primary categories: supply products, regulating services, and cultural services. For each category, the process includes assessing the functional quantities and applying specific accounting methods to determine the value of these ecological products. Details of the two levels of indicators used in this accounting are organized and presented in Table 3.
Provisioning products comprise various material goods that humans obtain from ecosystems and are marketable, including food, fiber, wood, medicine, ecological resources, water, and other commodities [42, 43]. Taking into account the resource endowment and natural economic characteristics of the WeiShui Wetland ecosystem, this study categorizes the supply products of the WeiShui Wetland into three distinct groups: fishery products, water resources, and ecological resources.
In this study, data collection involved analyzing statistics and reviewing water resource bulletins related to the WeiShui Wetland ecosystem. This approach enabled the acquisition of data on the production of various products from the WeiShui Wetland ecosystem in 2020.
In equation (1): QP represents the total production of material products (t); Qi represents the production of the i product (t); and i represents the type of product in the study area.
Regulating services encompass the benefits provided by wetland ecosystems that enhance the environment for human production and living. These include functions such as water conservation, flood storage, carbon sequestration, and oxygen release, climate regulation, water purification, and soil conservation [44].
The water conservation function is a critical ecosystem service provided by wetlands, involving the interception and storage of precipitation, enhancement of soil infiltration, conservation of soil moisture, regulation of stormwater runoff, and replenishment of groundwater, thereby increasing available water resources. Wetlands play a vital role in water conservation, not only supporting water needs for production and living within the region but also fulfilling water resource demands in surrounding areas [45]. Consequently, the water conservation quantity is selected as the functional quantity for accounting.
Table 3.
Accounting for the amount of gross ecosystem product function in the WeiShui Wetland.
The amount of water conserved is primarily calculated using the water balance equation, which is detailed below:
In equation (2): Qm represents the total culvert (m3); Pi represents the annual rainfall (mm); ETi represents the annual evapotranspiration (mm); Ai represents the area of reservoir pond and paddy field wetland (m2); and i represents the two wetland types of reservoir pond and paddy field.
Flood storage is a critical ecosystem service provided by various wetland types, such as lakes, reservoirs, reservoir ponds, and rice fields. These ecosystems function by accumulating water during flood peaks and then gradually releasing it, effectively reducing the volume of overloaded flood peaks. This process is vital for mitigating the impacts of floods on the surrounding environment and the production and living conditions of local communities [46]. Given this significant role, wetland ecosystems are uniquely positioned to contribute to flood risk management.
The flood storage function in the WeiShui wetland is primarily managed by the reservoir ponds and paddy fields, which are crucial for flood control and water management. The flood control capacity of the reservoir ponds and the adjustable water storage capacity of the paddy fields were selected as the functional quantities for this study. The flood storage capacity was determined by analyzing the annual storage changes of WeiShui Reservoir, as reported in the water resources bulletin for Songzi City, WeiShui Town. This involved calculating the difference between the highest and lowest water levels in 2020 to estimate the total flood storage capacity of the WeiShui wetland ecosystem.
The adjustable storage volume is:
In equation (3): Qm represents the total amount of storage available in the reservoir pond and paddy fields (m3); Qk represents the flood control storage capacity of the reservoir pond (m3); and Qr represents the adjustable storage capacity of the paddy field (m3).
The flood storage function in the WeiShui wetland is primarily managed by the reservoir ponds and paddy fields, which are crucial for flood control and water management. The flood control capacity of the reservoir ponds and the adjustable water storage capacity of the paddy fields were selected as the functional quantities for this study [47]. The flood storage capacity was determined by analyzing the annual storage changes of WeiShui Reservoir, as reported in the water resources bulletin for Songzi City, WeiShui Town. This involved calculating the difference between the highest and lowest water levels in 2020 to estimate the total flood storage capacity of the WeiShui wetland ecosystem.
Considering the environmental characteristics of the WeiShui Wetland’s location, carbon sequestration and oxygen release have been selected as key functional quantities for valuation. The specific formulas used to calculate these functions are as follows:
In equation (4): Qc represents the amount of carbon sequestration (t); Qo represents the amount of oxygen released (t); Nm represents the net primary productivity of the wetland ecosystem (g/(m2 -a)); and Am represents the area of WeiShui Wetland (km2).
The climate regulation function of natural ecosystems involves the absorption of solar energy through the processes of vegetation transpiration and water surface evaporation. This function helps regulate local temperatures, increase air humidity, and enhance human comfort levels [48]. Both plant transpiration and surface water evaporation are crucial, as they remove heat and release water vapor, significantly influencing temperature and humidity control. This makes the climate regulation function vital for maintaining ecological balance and ensuring a favorable environment.
In this study of a wetland ecosystem, the actual annual evapotranspiration has been chosen as the index for accounting for the climate regulation function. The specific formula used is as follows:
In equation (5): Ew represents the amount of evaporation from the water surface (m3); q represents the heat required to evaporate 1 gram of water (J/g); and represents the density of water (1g/cm3). y represents, on behalf of the humidifier, 1m3 of water into steam power consumption (kW-h).
The water purification function of a natural ecosystem involves the capacity to cleanse water pollutants through the physical and chemical processes of various aquatic organisms, effectively improving water quality and reducing the concentrations of nitrogen, phosphorus, and other pollutants [49]. In line with China’s “Surface Water Environmental Quality Standards” (GB3838-2002), which dictate control projects and threshold values for water quality, appropriate indicators for evaluating the ecosystem’s water purification function are selected based on these standards.
Given that the surface water quality in the WeiShui Wetland meets or exceeds Class III standards, this study selects the reduction in water quality pollutants such as Chemical Oxygen Demand (COD), total nitrogen, and total phosphorus as the functional quantities for the water purification function. The specific formula used to calculate these reductions is as follows:
In equation (6), A represents the wetland area of Hubei Province (hm2), Ai represents the wetland area of WeiShui (hm2), and Q represents the amount of wastewater entering the river in Hubei Province (t).
Natural ecosystems provide intangible benefits such as knowledge acquisition, leisure, and recreation, often showcased through ecotourism. These ecosystems also preserve valuable historical and cultural heritage, enriching the human experience [50-52].
The ecotourism function involves tourism that focuses on the unique history and culture of natural ecosystems. Operating within the sustainable carrying capacity of the ecological environment, it employs an eco-friendly approach to offer nature education, recreation, and entertainment, ultimately providing physical and mental enjoyment to tourists [53].
Considering the specific characteristics of the WeiShui Wetland, this study has chosen the annual number of tourist visits (including visits to tourist attractions and farmhouses) as the accounting index for the ecotourism function. The specific formulas used to calculate this are as follows:
In equation (7): Qt represents the total number of annual tourist trips (ten thousand visits); Qti represents the number of tourists' visits to the tourist attraction or farmhouse (ten thousand visits); and Q represents the number of tourist attractions and farmhouses in the accounting region.
Third, accounting for value.
The accounting of ecological product value is a process that builds on the functional quantity assessment of ecological products. It involves estimating the monetized value of these products by utilizing reference prices for various types of ecological services and applying specific mathematical formulas [54]. For the WeiShui Wetland ecosystem, the value of ecological products is calculated using several valuation methods, including the market value method, the alternative cost method, the shadow project method, and the travel cost method [55]. This study outlines the functional categories, accounting items, value indicators, and evaluation methods used to value the ecological products in the WeiShui Wetland ecosystem, detailed in Table 4.
The WeiShui Wetland offers three primary types of supply products: fishery products, water resources, and ecological energy. Specifically, the fishery products comprise freshwater items such as fish, shrimp, and crabs, with no involvement of seawater products. Water resources encompass the domestic and agricultural irrigation water supplied by the WeiShui Wetland to residents. Ecological energy includes the hydroelectric power generation services provided by the WeiShui Reservoir within the wetland. The valuation of these supply products is conducted using the market value method, reflecting their direct economic contribution to the region.
In equation (8): Vm1 represents the value of fishery products in CNY. Qm1i denotes the production of freshwater product category i in tons (t), and Pm1i is the price per kilogram of freshwater product category i in CNY/kg, where i specifies the type of freshwater products, indexed as 1, 2, 3. The production volumes of these three types of freshwater products were determined using data from the Annual Report of Rural Statistics of WeiShui Township (2020). Prices for these products were established through a combination of market survey methods and data from the Huinong network, with approximate values of 14.13, 63, and 13.85 CNY/kg, respectively.
In equation (9): Vm2 is the value of water resources (CNY), Qm2i is the water supply quantity of freshwater resources of category (m3), and Pm2i is the price of the water supply of freshwater resources of category (CNY/m3), i is the type of freshwater resources, i=1,2. Combined with the existing literature and the market price survey of water, the price of water for agriculture and domestic use is obtained as 0.5 CNY/m3 and 3.15 CNY/m3, respectively.
Table 4.
Accounting for the value of ecological products in the WeiShui Wetland.
In equation (10): Vm3 is the value of ecological energy (CNY), Qm3 is the amount of hydroelectric power generation (kw), and Pm3 is the market electricity price charge standard (CNY/kw-h). In the calculation, this study mainly relies on the Jingzhou City Electricity Price Charging Standard, the Hubei Songzi WeiShui National Wetland Park Master Plan, and other ways to obtain the local average electricity price of about 0.558 CNY/kw-h and the total amount of hydropower generation.
The regulating services provided by the WeiShui Wetland encompass five main categories: water conservation, flood storage, carbon sequestration and oxygen release, climate regulation, and water purification [56]. The specific accounting formulas used to quantify the value of these services are as follows:
In equation (11): Vm4 is the value of water conservation services at WeiShui Wetland (CNY), Qm4 is the total amount of water conservation (m3), and Pm4 is the project cost per unit of reservoir capacity (CNY/m3). It represents the area of WeiShui Wetland (m2).
In equation (12): Vm5 is the value of the floodwater storage service of WeiShui Wetland (CNY), Qm5 is the total amount of flood water storage (m3), and Pm5 is the cost of reservoir unit construction (CNY/m3). On this basis, according to the "Hubei Province Water Conservancy Development "13th Five-Year Plan" in the construction of the Mianpanshan Hub Reservoir project, the total investment amount calculated for a reservoir unit construction cost of about 6.7 CNY/m3.
In equation (13): Vm6 is the value of carbon sequestration and oxygen release services of WeiShui Wetland (CNY), Nm6 is the net primary productivity of the wetland ecosystem (g/(m2-a)), and Am6 is the wetland area of WeiShui Water (km2), and Pc is the price of carbon sequestration (CNY/t), and Po is the price of industrial oxygen production (CNY/t). In the calculation, the average net primary productivity of wetlands in Hubei Province was about 942.7g/m2-a according to the formulae of the relevant literature and the results of the calculation, while the price of carbon sequestration and the price of industrial oxygen production were determined with reference to the cost of silviculture in China and the international standard of carbon tax, which were 510 CNY/t and 376.5 CNY/t, respectively.
In equation (14): Vm7 is the value of the climate regulation service of WeiShui Wetland (CNY), Qm7 is the energy consumed by the evaporation of the ecosystem of WeiShui Wetland (kw-h), and Pm7 is the average local electricity price (CNY/kw-h). In addition, Ew represents the water surface evaporation (m3), and q represents the amount of heat required to evaporate 1 gram of water (J/g).
In equation (15): Vm8 is the value of the water purification service of the WeiShui wetland (CNY), Qm8 is the volume of wastewater sewage into the river (t), Pm8 is the cost price of wastewater sewage treatment (CNY/t), A is the area of wetland in Hubei Province (hm2), Ai is the area of WeiShui wetland (hm2), and Q is the volume of wastewater sewage into the river of the whole province of Hubei Province (t). In the calculation, the average annual volume of wastewater effluent into the river is determined according to the data from the Hubei Province Water Resources Bulletin (2020), and the cost price of wastewater treatment is obtained as 1.19 CNY/t by combining the data from the statistical yearbook.
Table 5.
Accounting results of the value of ecological products in WeiShui Wetland.
In equation (16): Vm9 is the value of cultural education, leisure, and recreation services in the WeiShui Wetland (CNY), Qm9 is the total number of annual visitors to the WeiShui Wetland (person/year), and Pm9 is the average consumption level of each visitor (CNY/person).
In equation (17): GEP is the total value of ecological products of WeiShui Water Wetland (CNY), EMV is the value of supply products of WeiShui Wetland (CNY), and ERV is the value of regulating services of WeiShui Wetland (CNY), ECV is the value of cultural services of WeiShui Wetland (CNY).
In equation (18): Vm10 is the value of ecological products per unit area of WeiShui Water Wetland; GEP is the total value of ecological products of WeiShui Wetland (CNY); and Ai is the area of WeiShui Wetland (hm2).
By applying the calculations in Table 6, the total value of ecological products of WeiShui Wetland in 2020 amounted to 15.17×10^8, and the per unit area value was 66.79×10^4 CNY/hm^2. Among these, the value derived from supplying products was 7.523×10^8 (49.59%), the value from regulating services was 7.427×10^8 (48.96%), and the value from cultural services was 0.224×10^8 (1.45%). It is evident that the predominant contribution to the total ecological product value of WeiShui Wetland stems from supplying products, with the largest share being the supply of water resources (Table 5). This aligns with the wetland’s role as a crucial source of drinking water for WeiShui Wetland Town and adjacent areas. Additionally, the wetland’s services, such as flood water storage, carbon sequestration, and oxygen release, are also significant, underscoring the wetland’s vital role in enhancing the local living environment. However, compared to supplying products and regulating services, the contribution from cultural services remains relatively minor, indicating substantial potential for development in the leisure and tourism sectors. There is a need for further exploration and utilization of ecotourism resources to both safeguard the local wetland ecosystem and generate higher economic returns.
2.4.2. Value Accounting Based on the Choice of Experimental Methods
In this study, the choice experiment method and potential classification model are used to account for the value of the ecological products of the WeiShui wetland. The choice experiment method is based on the random utility theory and the consumer choice theory, and the respondents will make the choice of utility maximization based on their preference level [57, 58]. However, changes in any one of the attributes and attribute levels will affect respondents' preference choices, so respondents will make the best discrete choices in order to maximize utility. The LCM model is based on the classification of respondents into different categories to assess the value of the resource environment in order to reflect the randomness of the respondents' personal preferences and to analyze the heterogeneity of respondents, and it overcomes the problem of the existing research that treats respondents as completely homogeneous groups. The model overcomes the fact that existing studies have viewed respondents as a completely homogeneous group [59, 60].
According to the random utility theory, an individual's choice utility (U) is composed of an observable deterministic part (V) and a random error term (ε) (Manski, 1977), and then the utility of an individual p who chooses option i can be expressed as:
In equation (19): Uip is the total utility that respondent p derives from the program; Vip is the utility of the observable component of the total utility. Zi is the attributes of the chosen wetland improvement program, such as water supply, hydrologic regulation, biodiversity, wetland landscape, and the amount paid for the improvement; Sp is the socioeconomic attributes of individual p, such as age, highest level of education in the household, and annual household income; and
Table 6.
Total value of ecological products and value per unit area of WeiShui Wetland.
In equation (20): Prob(i) expresses the probability that a respondent chooses an option; the Uip and Ukp denote the total utility of choosing option and option k, respectively. Vip and Vkp denote the measurable utility of choosing option and k, respectively.
The probability that a respondent chooses option i out of n options is denoted as:
In equation (21): Vip usually consists of the Alternative Specific Constant (ASC) selecting the attribute Zi of scenario i and the socio-economic characteristics Sp of individual p. The ASC is a set of attributes that can be used in the selection process.
The model representation of the utility obtained by the respondents of this study from Scheme i is given as:
In equation (22): ABCi denotes the selection of a constant term corresponding to the level of a particular program attribute;
The amount respondents are willing to pay to protect and enhance the value of the ecological products of the Slippery Water Wetland is equal to the marginal value of the attributes of the different improvement scenarios corresponding to the maximization of their utility. It is specifically expressed as:
In equation (23): MWTPi is the respondents' willingness to pay for the function of each attribute of the WeiShui wetland ecological product;
Respondents' compensated surplus (CS) uses the difference between the initial utility state preferences and the final utility state preferences for each attribute combination scheme:
In equation (24): is the coefficient of optimal choice of centralized attributes; V0 is the initial utility state preference; and V1 is the final utility state preference.
In this study, the design of the WeiShui Wetland questionnaire was informed by a review of both domestic and international literature on the Choice Experiment (CE) method. Utilizing the principles and survey techniques of CE related to payment options, the study then structured the choice experiment design around three key aspects.
Determining Attributes and Attribute Levels
Initially, it is essential to identify the attributes of the ecological products of WeiShui Wetland. The most representative attributes should accurately and objectively reflect the functions of wetland ecological products. Davidson categorized wetland ecosystem services into four primary ecological functions: provisioning services, regulating services, supporting services, and cultural services [61]. Drawing on this classification and considering the regional specifics of WeiShui Wetland, this study selects three functional attributes and one economic attribute for inclusion in the choice experiment. This approach facilitates the analysis of respondents’ preferences and their willingness to pay for combinations of different attributes and levels:
① Water Resource Supply: This attribute is tied to the production and domestic water provided by WeiShui Wetland to residents, primarily reflecting the provisioning services of the wetland’s ecological products.
Table 7.
Attributes of ecological products of the WeiShui wetland and their level range table.
② Hydrological Regulation: This attribute highlights the wetland’s crucial role in water conservation and flood storage, representing the regulating services of the ecological products.
③ Wetland Landscape: This attribute captures the recreational and aesthetic value the wetland offers, providing a physically and mentally enriching countryside and tourism experience, thus reflecting the cultural services of the ecological products.
④ Payment: This economic attribute represents the monetary contribution respondents are willing to make towards the protection and enhancement of the ecological product values of WeiShui Wetland. The variation in willingness to pay was determined using a preliminary pre-survey and consideration of the residents’ income levels, with the following increments: 0 CNY/year per household, 50 CNY/year per household, 100 CNY/year per household, 150 CNY/year per household, and 200 CNY/year per household.
Additionally, the attribute levels in this study were established by synthesizing the findings from existing literature and the practical insights gathered from the preliminary survey. It is hypothesized that the absence of any protective measures for the wetlands will result in the gradual degradation of the ecological products’ functions. Consequently, the baseline level for each attribute is designated as the “deterioration” level [62]. The levels of each attribute are then adjusted under two conditions: “maintenance” and “improvement,” which represent different levels of ecological status that could be achieved with varying degrees of wetland protection. Essentially, different payment levels indicate the degree of protection desired for the WeiShui Wetland. In summary, the three functional attributes and one payment attribute identified for the WeiShui Wetland, along with their corresponding levels of change, are detailed in Table 7.
Determine the Selection Set
Assuming the absence of protective measures, the ecological functionality of WeiShui Wetland is experiencing deterioration. This scenario, where all three attributes are at a “deteriorating” level, serves as a benchmark for comparison. Notably, as attribute levels improve, so does the willingness to pay among respondents. Employing the permutations and combinations method, we initially generated 135 possible choices. However, considering the operational complexity and research constraints, this study applied the principles of feasibility to refine these choices. Using orthogonal experimental design and SPSS 26.0 software, choices that were logically inconsistent or unrealistic were eliminated. Consequently, 16 viable choices that correspond to various attribute level combinations specific to WeiShui Wetland were retained. These were randomly allocated into five sets (Table 8). Each set comprises four options, encompassing three progressive improvement scenarios of WeiShui Wetland— minor, moderate, and major improvements—alongside a baseline scenario. Respondents can select according to their preferences and the maximization of their utility.
The questionnaire for this study on the WeiShui Wetland comprised five distinct sections:
Ecosystem Perception: This section assessed residents’ awareness and perceptions of the WeiShui Wetland ecosystem. It included questions about their understanding of the wetland, its ability to provide ecological products, the impact of the wetland on their lives, the current state of its protection, and the extent of exploitation and utilization of its four main functions.
Ecosystem Services Perception: This part explored changes in the wetland’s ecosystem services over the past five years, querying whether these services have improved or deteriorated and why. It also asked respondents to identify the entities responsible for these changes.
Valuation of Ecological Products: The third section gathered data on residents’ willingness to pay for the ecological products of the WeiShui Wetland, focusing on their preferences for a predefined set of payment options.
Socio-Economic Characteristics: This section collected detailed demographic and socio-economic data from respondents, including age, gender, role in the household, income sources, occupation, place of residence, household registration, political affiliation, educational background, household size, labor force distribution, and annual household income.
Questionnaire Validity: The final part of the questionnaire aimed to ensure the integrity of the responses by requesting respondents to answer truthfully.
Given the abstract nature of the questionnaire content and the use of a virtual market survey approach, it was crucial for respondents to fully understand the questions presented. Therefore, prior to the commencement of the study, researchers were trained in research methodologies and communication techniques to facilitate clearer interactions. In June 2021, a preliminary small-scale survey was conducted at WeiShui Wetland through face-to-face household inquiries to establish a scientifically reasonable payment range. The main study was subsequently carried out from November 5 to November 13, 2022, employing random sampling and face-to-face interviews as the primary data collection methods. A total of 180 questionnaires were distributed during the field research at WeiShui Wetland. All questionnaires were recovered, and after discarding invalid ones, 170 were deemed valid, yielding a validity rate of 94.44%. Additionally, the KMO and Bartlett’s tests confirmed the reliability and validity of the research data. The survey covered four administrative villages surrounding WeiShui Wetland and the area around the WeiShui Reservoir Project Administration within WeiShui Town. The distribution of the samples varied due to the hollowing-out phenomenon and the terrain of the study area, with specific sample distributions detailed in Table 9.
Table 8.
Examples of selected sets for WeiShui wetlands.
Table 9.
Distribution of questionnaires in the sample area of the WeiShui Wetland.
| Shore | Sample size for placement | Effective sample size |
|---|---|---|
| Zhangmuxi Village | 75 | 70 |
| Nanzha village | 40 | 38 |
| Wangmayan village | 32 | 31 |
| Inside the town of WeiShui | 20 | 18 |
| Beizha village | 13 | 13 |
| (grand) total | 180 | 170 |
Following the selection of the experimental design and research methodology, the variables relevant to the study were clearly defined and assigned specific values, as illustrated in Table 10.
Table 10.
Variable Definitions and Assignments.
Potential Classification Model Estimation
Initially, the optimal number of potential categories was identified. This study utilized LatentGOLD 4.5 software to determine the number of categories. Concurrently, a review of existing literature and related information confirmed that the Akaike Information Criterion (AIC) and Bayesian Information Criterion (BIC) are crucial for measuring model fit, with lower values indicating a better fit [63, 64]. As depicted in Table 11, the AIC values gradually decreased as the number of categories increased, with the decline plateauing at three categories. Similarly, the BIC value was lowest for the three categories, after which it began to rise with additional categories. Given these statistical metrics and considering the reasonableness of the results, this study classified the respondents into three potential categories. The distribution percentages for these categories were 57.38%, 23.43%, and 19.18%, respectively. This categorization aligns with the criteria for model fit and provides a structured understanding of respondent segmentation.
The findings, detailed in Table 12, reveal key insights into respondent preferences for the WeiShui Wetland’s ecological attributes. In Potential Class 1, the coefficient for the water supply attribute is positive and significantly higher than for other attributes, indicating a strong preference for the water supply function of the wetland. This preference aligns with the wetland’s role as a critical drinking water source. Furthermore, the willingness of respondents in this class to protect the ecological products of the WeiShui Wetland is influenced by their residency in the area and their educational attainment.
In Potential Class 2, all three functional attributes and one payment attribute are statistically significant, except for the hydrological regulation improvement level. This suggests that the wetland’s regulatory functions are highly valued, and respondents are willing to pay for varying levels of improvement across all attributes of the wetland’s ecological products. The negative coefficient for the price attribute implies that respondents are willing to invest in the wetland’s ecological enhancement, provided the costs are within their financial capabilities. Consequently, Class 2 is defined as the no-difference preference type, with respondent decisions also being influenced by local residency and education level.
Table 12.
Parameter estimates for the potential classification model.
Table 11.
Classification table for potential classification model.
| Form | Log likelihood | AIC value | BIC value |
|---|---|---|---|
| 2 | -1095.6634 | 2255.3268 | 2407.1743 |
| 3 | -790.3630 | 1692.7259 | 1958.4592 |
| 4 | -737.6807 | 1635.3614 | 2014.9803 |
| 5 | -685.1247 | 1578.2493 | 2071.7539 |
In Potential Class 3, the landscape attribute shows the highest coefficient among the three functional attributes, indicating a pronounced preference for the wetland’s aesthetic aspects. Thus, Class 3 is categorized as the landscape preference type. Influential factors for this class include the respondents’ age, local residency, rural or urban status of household registration, education level, total number of laborers, and number of agricultural laborers in the household. This classification underscores the diverse factors contributing to the perceived value of the wetland’s ecological products and services.
Willingness-to-Pay Measurements
The choice experiment method employed in this study was designed to calculate the marginal value of each significant attribute of the WeiShui Wetland, enabling the determination of the price respondents are willing to pay to enhance these attributes, referred to as Marginal Willingness to Pay (Marginal WTP). This measurement is predicated on the assumption that the perceived utility gain from improving the ecological products of the WeiShui Wetland exceeds the cost of the benefits paid. Consequently, any negative values of the estimated attribute parameters—indicating a net loss in utility relative to cost—are not considered in the financial calculations and are marked as “NO” in the accounting process, as detailed in Table 13. This approach ensures that the analysis reflects a net positive willingness to invest in the wetland’s ecological improvements.
As can be seen from Table 13, no matter what type of preference, respondents are willing to pay a certain amount of money to improve the ecological products of the WeiShui Wetland to realize its value, i.e., the cost to be paid for changing the status quo. Among them, the willingness to pay of the respondents with landscape preference type is higher than that of the respondents with water supply preference type and no difference preference type The reason may be that the WeiShui Wetland is currently in the mature stage of ecological construction, and the development of ecotourism not only protects the ecological environment of the WeiShui Wetland, but also promotes the development of the local economy and the increase of the income of the livelihoods, so that the respondents' willingness to pay for the wetlands' landscape preference is very high. According to the Compensation Surplus (CS) formula, the average annual willingness to pay of residents with water supply preference in the WeiShui wetland is calculated to be 273.73 CNY/year household; the average annual willingness to pay of residents with no differential preference in the WeiShui wetland is 255.77 CNY/year household; and the average annual willingness to pay of residents with landscape preference in the WeiShui wetland is 11,889.23 CNY/year household.
The formula for willingness to pay per unit area is:
As illustrated in Table 13, respondents across all preference types exhibit a willingness to pay for improvements to the ecological products of the WeiShui Wetland, underscoring the value they place on altering the current state. Notably, the willingness to pay among those with a landscape preference is significantly higher compared to those with water supply or no differential preferences. This heightened willingness likely stems from the wetland’s mature stage of ecological development, where ecotourism not only safeguards the environment but also stimulates local economic growth and enhances livelihood incomes [65, 66]. Consequently, respondents highly value enhancements to the wetland’s landscape, reflecting their substantial willingness to invest. According to the Compensation Surplus (CS) formula, the average annual willingness to pay is calculated as follows:
Residents with a water supply preference: 273.73 CNY per household per year.
Residents with no differential preference: 255.77 CNY per household per year.
Residents with a landscape preference: 11,889.23 CNY per household per year.
Among others. WTPj denotes the willingness to pay per unit area, WTPk denotes the average annual willingness to pay of the residents of the WeiShui Wetland, N represents the total number of households in the WeiShui Wetland, P denotes the payment rate, and S denotes the total area of the WeiShui Wetland.
Table 13.
Willingness to Pay of Respondents in the WeiShui Wetlands.
Based on Formula (25) and incorporating data from the “Songzi City, Hubei Province, WeiShui Town Statistical Yearbook 2020,” the WeiShui Wetland covers an area of 2271.20 hectares. Remarkably, 94.44% of respondents indicated their willingness to contribute financially towards the maintenance and enhancement of the wetland’s ecological functions. The calculated willingness to pay for each of the three preference categories per hectare is as follows: Water supply preference: 3251.87 CNY/hm², no differential preference: 3038.51 CNY/hm², landscape preference: 141,242.23 CNY/hm². Furthermore, by integrating the proportional representation of each preference category, the overall average willingness to pay for ecological improvements per hectare of WeiShui Wetland is calculated to be 29,668.11 CNY.
Analysis of Realization Pathways
Given the global practices in realizing the value of ecological products and considering the resource endowments and regional characteristics of the WeiShui Wetland, this study proposes four strategic paths: ecological compensation, ecological industrialization, property rights trading, and green financial support [67, 68]. Each of these paths is tailored to leverage the wetland’s mature ecological construction stage and its unique regional advantages. The timing and extent of realization for these strategies are differentiated as follows, based on a synthesis of existing literature and empirical research findings:
Timing of Realization: Near Future: 1-2 years, Near-Medium Term: 2-3 years, Medium and Long Term: 3-4 years, Long Term: 4-6 years.
Degree of Realization: Moderate Development: This involves gradually integrating ecological strategies without major disruptions to the existing setup; Key Development: This focuses on significant areas of potential that can provide substantial ecological and economic benefits. Upgrading Development: This includes comprehensive enhancements and innovations in ecological product management and utilization.
The specifics of these realization paths are detailed in Table 14, illustrating the phased approaches and the expected developments at each stage. These paths are designed to optimize the ecological and economic benefits derived from the WeiShui Wetland, ensuring sustainability and robust community engagement. The specific realization paths are as follows:
Ecological compensation, or eco-compensation, involves compensatory measures taken by governments and relevant institutions to reward stakeholders who forfeit development opportunities or suffer from environmental damage, thereby facilitating the protection and enhancement of the ecological environment. This strategy represents the most direct approach to realizing the economic value of ecological products from wetlands through conservation efforts [69]. This study’s findings indicate that during the mature stage of ecological construction at WeiShui Wetland, government-led vertical ecological compensation has effectively contributed to the expansion and restoration of the wetland area. However, it has also been observed that stakeholders, particularly local residents, express dissatisfaction with the compensation standards applied to retired farmland and wetlands. This dissatisfaction highlights potential areas for improvement in compensation practices. Moreover, considering the supply of water resources to other provinces, cities, and counties, there is an emerging opportunity to develop a horizontal ecological compensation path that fosters inter-regional collaboration in the near future. Enhancing both horizontal and vertical ecological compensation systems is crucial for protecting the interests of WeiShui Wetland residents and effectively realizing the value of its ecological products. Such improvements will not only address stakeholder concerns but also bolster the sustainable development and ecological integrity of the wetland.
Ecological Industrialization Path. Ecological industrialization, along with industrial ecologization, constitutes a pivotal green development pathway. This approach is aligned with the “two mountains” theory, which posits that ecological and economic benefits are both vital for sustainable development. Leveraging local natural resources and ecological advantages to develop eco-agriculture is crucial for advancing the high-quality development of agriculture in China. By marketing eco-agricultural products that feature local characteristics, these products can attain both ecological and economic value [70]. In recent years, the WeiShui Wetland, with its distinctive natural resources and ecological agricultural product advantages, has made significant strides in the mature stage of ecological construction. The region has successfully branded and marketed agricultural products such as red grapefruit, kiwi fruit, and mandarin oranges. Innovations such as the establishment of the “Countryside Preferred” e-commerce platform and the Chaoqun Jelly Orange Planting Cooperative have notably enhanced the livelihoods of local farmers. Despite these advancements, there remains a need for more pioneering development efforts in the sector. Additionally, the WeiShui reservoir boasts abundant water resources that meet national drinking water standards. Although several water factories currently operate around the reservoir, they are relatively small and lack industrial linkage. There is a substantial opportunity in the near to medium term to robustly develop the mineral water industry. By fostering a deep integration of primary and secondary industries, such development would not only enhance the added value but also more effectively realize the ecological product value of the WeiShui Wetland. This approach would help transform the area into a model of ecological and economic integration, further promoting sustainable regional development.
Table 14.
Arrangement of the path to realize the value of WeiShui Wetland.
The path of property rights trading. This approach involves establishing a market-oriented mechanism that promotes endogenous incentives for ecological enterprises, facilitating the transformation of ecological resources into assets and capital. This conversion aims to change the non-market value of ecological products into market value, encouraging regional governments to explore market-oriented paths suitable for their development [71]. The WeiShui Wetland, rich in water resources and spanning across five counties in two provinces, shows a significant valuation in water supply and carbon sequestration through GEP assessments. However, the development of a property rights trading path for the WeiShui Wetland is currently slow. There is a clear need to prioritize this path in future development strategies to enhance ecological revenue streams.
Green financial support path. The green financial support path focuses on revitalizing ecological resource assets and boosting the supply of ecological products in regions that struggle with green economic development. This approach leverages tools such as green credit and green insurance to facilitate these goals [72]. Findings from two surveys and GEP value accounting indicate that the WeiShui Wetlands face challenges such as the slow development of ecological products and difficulties in financing their value realization. Nevertheless, the implementation of financial products tailored to the specific characteristics of each region can ensure the protection and enhancement of ecological product values. By exploring innovative financial solutions and new business models, this path can provide the necessary support to overcome these challenges and promote sustainable regional development.
Results and Discussion
Ecological product value accounting has emerged from the assessment of ecosystem service values and is a practical application of these assessments in China. This topic has attracted significant academic interest and is a key focus in the management of ecological environments. Current research primarily addresses the overall concept, meaning, classification, value creation process, realization mechanisms, and valuation of ecological products on a regional scale [73-77]. However, studies specifically focusing on the valuation of individual types of ecological assets remain limited. In their 2020 study, Xing et al. [78] developed a framework to value the ecological products of forests and applied the Gross Ecosystem Product (GEP) method at Beijing’s J-forestry farm in 2022. Their findings indicated that tourism services contributed the largest share of the value, while social services contributed the least. This differs from the outcomes of the present study, which assessed the overall composition of ecological product values in Weishui Wetland in 2020. Here, the predominant value was from supply products, amounting to 7.523×10^8 yuan, significantly higher than similar evaluations in other regional wetland ecosystems. The primary contributors to Weishui Wetland’s value were agricultural and domestic water supplies. Field research revealed that Weishui Reservoir within the Weishui Wetland provides multiple integrated functions, including water supply and power generation, serving five counties across the provinces of Hubei and Hunan, thus enhancing the value derived from water resource supply.
This study has its limitations, particularly in the area of data acquisition, resulting in the exclusion of air purification services provided by Weishui Wetland from the valuation. Additionally, refining the methods used to scientifically and accurately classify residents’ preferences within the potential classification remains an area for future research. The research primarily focuses on wetlands in a mature ecological construction stage, tailoring methodologies to the specific characteristics of such ecosystems. This approach has led to adjustments and enhancements in the existing methods for accounting for the value of ecological products, thus enriching the methodology and contributing to more accurate and reliable valuation results. Moreover, the current study predominantly analyzes the value of wetland ecological products from a static perspective at a specific point in time, without delving into the trends of these values over time. Future research could beneficially explore the temporal and spatial evolution characteristics of the ecological product value of Weishui Wetland, adopting a dynamic perspective to provide a more comprehensive understanding of its ecological contributions and changes.
Conclusions
The valuation of ecological products has predominantly focused on specific stages rather than considering the varied stages of ecological construction for a given land category. Addressing this gap, this study employs the WeiShui Wetland—currently in a mature stage of ecological construction—as the focal point. Utilizing both subjective and objective methods, such as the ecosystem gross product accounting method and the choice experiment method, this research comprehensively assesses and compares the value of its ecological products. Additionally, it evaluates the per unit area value of ecological products in wetlands and investigates strategies for realizing the ecological product value at this advanced stage of development. The study has yielded several important conclusions:
In 2020, using the objective Gross Ecosystem Product (GEP) method, the value of ecological products per unit area for WeiShui Wetland in its mature stage of ecological construction was calculated at 66.79×10^4 yuan per hectare, with a total value reaching 15.17×10^8 yuan. Analysis of different types of ecological products revealed that supply product value and regulating service value dominated, contributing 49.59% and 48.96%, respectively, while cultural service value accounted for only 1.45%, with the largest value contributions coming from the water supply function and flood storage function. Further insights were gained through the subjective choice experiment method and latent classification model, which segmented respondent preferences into three distinct classes: Class 1 as the water supply preference type comprising 57.38% of respondents, Class 2 as the no-difference preference type making up 23.43%, and Class 3 as the landscape preference type accounting for 19.18%. The calculated 2020 values of ecological products per unit area for these classes were 3251.87 yuan/hm^2, 3038.51 yuan/hm^2, and 141242.23 yuan/hm^2, respectively. When aggregated in proportion to their class distributions, the overall value per unit area for the WeiShui Wetland stood at 2.97×10^4 yuan/hm^2. Additionally, the study noted demographic and socioeconomic factors influencing respondent preferences: both the water resource supply and no-difference preference types were influenced by local residency and education levels, while respondents with a landscape preference were affected by age, local residency, rural or urban household registration status, education level, and the composition of their household labor force, including the total number and type of laborers. This detailed analysis underscores the complexity of valuing ecological products and the importance of considering both objective and subjective factors in ecosystem valuation studies.
The realization of the value of ecological products in local wetlands can follow four strategic paths: ecological compensation, ecological industrialization, property rights trading, and green financial support. Each path should be tailored to fit the specific stage of ecological construction and planned accordingly in terms of the timing and intensity of development efforts. Specifically, the WeiShui Wetland should focus on ecological compensation in the near future to immediately enhance its ecological services. In contrast, the paths of ecological industrialization, property rights trading, and green financial support should be emphasized in the near to medium term, with upgrades planned to integrate ecological functions more deeply with local economic activities, establish a robust market for ecological property rights, and leverage financial tools to support sustainable development initiatives. These targeted strategies are designed to optimize both the ecological and economic benefits of the WeiShui Wetland, aligning development with the wetland’s current maturity stage and future potential.

