

Introduction
One of the biggest problems today is that urbanization and the associated environmental problems affect the natural environment. Even in cities that offer many opportunities in terms of social, cultural, economic, and recreational aspects, people must live in an unhealthy environment due to pollution. In Turkey, the rate of urbanization is increasing rapidly, causing severe damage to the quality of life. In a region where urbanization is rising rapidly, it is very difficult to talk about ecology and environmental balance [1, 2]. Insufficient environmental policies fail to protect the natural environment. At the same time, bad policy means poor land use and less green spaces [3-7]. According to Doygun and İlter [8], not placing the necessary importance of urban green spaces in zoning plans and applications limits the city’s natural environment needs. The interaction and relation of open and green spaces, which are an important component of urban spaces, with the structural elements of the city constitute the general character of a city. For this reason, urban green spaces, have been a factor shaping the physical structure of the city. Although various definitions and classifications of urban green spaces exist, according to Öztan [9]; open spaces are places in the urban fabric, excluded from construction and transport. Green areas are natural and semi-natural areas covered with plants [10]. Sabyrbekov et al. [11] argue that urban open and green spaces provide positive effects on people’s physical and mental health by offering natural spaces. Urban green spaces have many positive effects on the people living around them, including psychological, physical, social, ecological, biological, hygienic, economic, and aesthetic [12-15]. In addition to improving air quality and human health, many benefits improve the urban environment [16, 17]. According to Yıldız et al. [18], the green space planned to be created in urban areas, besides physical factors such as climate, geology, hydrology, soil, flora, fauna, topography, cultural factors, and urban texture should be evaluated together. The incorrect positioning of urban green spaces in the city makes these spaces less accessible and underutilized for the population they are supposed to serve. Worse still, these spaces can be abused as spaces for illegal and criminal behavior [19, 20]. In this sense, measuring and understanding the accessibility of these areas, rather than just location-based metric distance, can play an important role in promoting the physical and social functioning of urban green spaces [21, 22].
Green areas support the ecological and social systems of the city as an established fact in public policies in the planning dimension [23-26]. Grahn and Stigsdotter [27] stated that urban open green spaces and urban landscape practices positively affect the health and comfort of individuals living in the city. The social and spatial effects of urban green spaces gain more importance in the urbanization process [28, 29]. Vegetative materials and water elements (pond, pool, etc.) in open and green areas in the city are very effective landscape elements in increasing urban comfort, especially in summer [30]. Jian and Kazunori [31] determined that urban parks have a relaxing effect by utilizing the acoustics of open spaces. Certain laws and regulations have been established in order to determine the urban green space adequacy in cities in Turkey. In July 1972, the green area amount, which was 7 m2 per person according to “Development Law No. 6785, was increased to 10 m2 in September 1999 [32]. For 15000 people, 2 m2/person neighborhood park and 2 m2/person sports area, for 45000 people, 3.5 m2/ person urban park and 1 m2/person sports area are foreseen [33]. Alkan [34] conducted a survey in the central neighborhoods of Çanakkale, in which he aimed to evaluate the users’ perceptions according to criteria such as area size, accessibility, security and adequacy/ equipment diversity. Accordingly, the most attractive criteria for users have been identified as safety, equipment variety, amount of green areas, aesthetics, accessibility and area size. Ersoy [35] stated in his study that according to the data of the Ankara Master Plan Bureau, children’s playgrounds should be calculated as 2 m2/person and playgrounds as 1 m2/person. Bakan and Konuk [36] emphasized in their study that children’s playgrounds are accessible 0-30 m for 0-2 years old, 30-70 m for 3-6 years old, 100-150 m for 7-11 years old, 0-350 m for 12-18 years old. Molina-García et al. [37], on the other hand, argues that the place where the house is located should have access to the playground in 2-3 minutes and the neighborhood park in 10 minutes. Park and Kim [38] states that the playground should be at most 400-800 m in distance. In short, accessibility should be at different standards for each unit in urban spaces.
In many studies on this subject, the amount of green space per person has been determined. Aksoy [33], 1.9 m2 in Istanbul, Karagüzel et al. [39], 3.1 m2 in Antalya, Yıldız and Yılmaz [40] in Kars, 2.2 m2 in Kırıkkale, Özcan [41] 5.44 m2 in Kayseri, Öztürk [42], Gül and Küçük [43] determined the amount of green space per 3 m2 in Isparta. GIS and remote sensing methods were used in similar studies to determine the adequacy of urban open and green areas, the amount of green space per person, and the carrying capacity of these areas [44-48]. Aklıbaşında [49] Data and analysis, satellite images, GIS and Google Earth were obtained in the study conducted to determine the distribution, amount, impact area and adequacy of active green areas in Nevşehir province. According to the results of the analysis, it has been determined that although the green areas in Nevşehir are quantitatively well below the standards, they have a high level of accessibility in the whole city according to the service impact areas. Aklınbaşında and Özdarıcı Ok [50] evaluated the change in the urban fabric in the province of Nevşehir with the integration of remote sensing (RS) and geographic information systems (GIS) over a 10-year period (2004-2014). As a result of the research, a decrease of 23.28% was found in urban open-green areas in Nevşehir province from 2004 to 2014. Colakkadıoğlu et al. [51] examined the quantitative adequacy and accessibility of existing and future open and green spaces in Osmaniye city center at the neighborhood level. Analyzes were performed using ArcGIS 10.0 software in accordance with the Spatial Plans Construction Code. Accordingly, it has been determined that there are 48 open and green areas with an area of 278566.33 m2, 1.15 m2 open and green areas per person in the city center of Osmaniye. However, it was concluded that none of the neighborhoods had enough open and green spaces. Sanesi and Chiarello [52], in their study to determine the amount of urban green space per capita in the city of Bari, Italy, found that the city had a lower and insufficient amount of green space compared to other cities in Italy. Lam et al. [53], in their study on the environmental quality of Hong Kong’s urban parks and open spaces, suggests that the role of urban parks in increasing urban livability needs to be reevaluated. In the planning of green spaces and their functions, criteria such as the general distribution and adequacy of existing green areas, accessibility to these areas, requirements in the areas they will serve, population density, and urban identity should be evaluated [54-56]. In this way, urban green space systems will create a functional and balanced structure that is compatible with the city’s functions and the whole city [57]. In establishing local standards in open and green space planning in cities, an expert commission should be established by the physical and social structure of the city, and the attractiveness of these areas should be increased with the planning dimension [58, 59]. According to the European Commission Urban Inspection report [60], when accessibility to urban green spaces is evaluated, the ideal walking time for urban green areas is given as 15 minutes. As a general rule, ensuring access to an adequate amount of urban green space is quality (universal access) for all population groups and users. 0.5-1 hectares (approximately 5 minutes walk) within a linear distance of 300 meters, with urban residents having access to at least public green spaces [61]. Xing et al. [62]; Whang et al. [63]; According to Chen et al. [64], the most suitable transportation and walking distances vary according to the types of green areas. Pamay [65] stated that neighborhood parks should be calculated as 2.5 m2 per person and the access distance should be 400m, while Ersoy [66] emphasized that 800 m would be sufficient for this distance. In this study, the green area system in the city center of Erzurum was evaluated within the scope of its competence and the area it serves and examined in terms of standards.
Material and Methods
Material
Erzurum is located in northeastern Turkey, between 40°15 10 and 42°35 35 east longitudes and 40°57 25 and 39° 10 25 north latitudes. Erzurum, with a population of 766,729 people, is 1853 m above sea level. There is a terrestrial climate, with an average temperature of 19,6ºC, a cold average of -8,6ºC, lowest temperature -35ºC, and highest temperature 35ºC. The neighborhood was divided into 3 neighborhoods in 2008, numbered 5747 [67].
Fig. 1.
Parks in Erzurum city center (a- 2020 existing, b- proposed according to the zoning plan) Distribution of park areas in Erzurum city center (c-2020 existing, d- proposed according to the zoning plan).
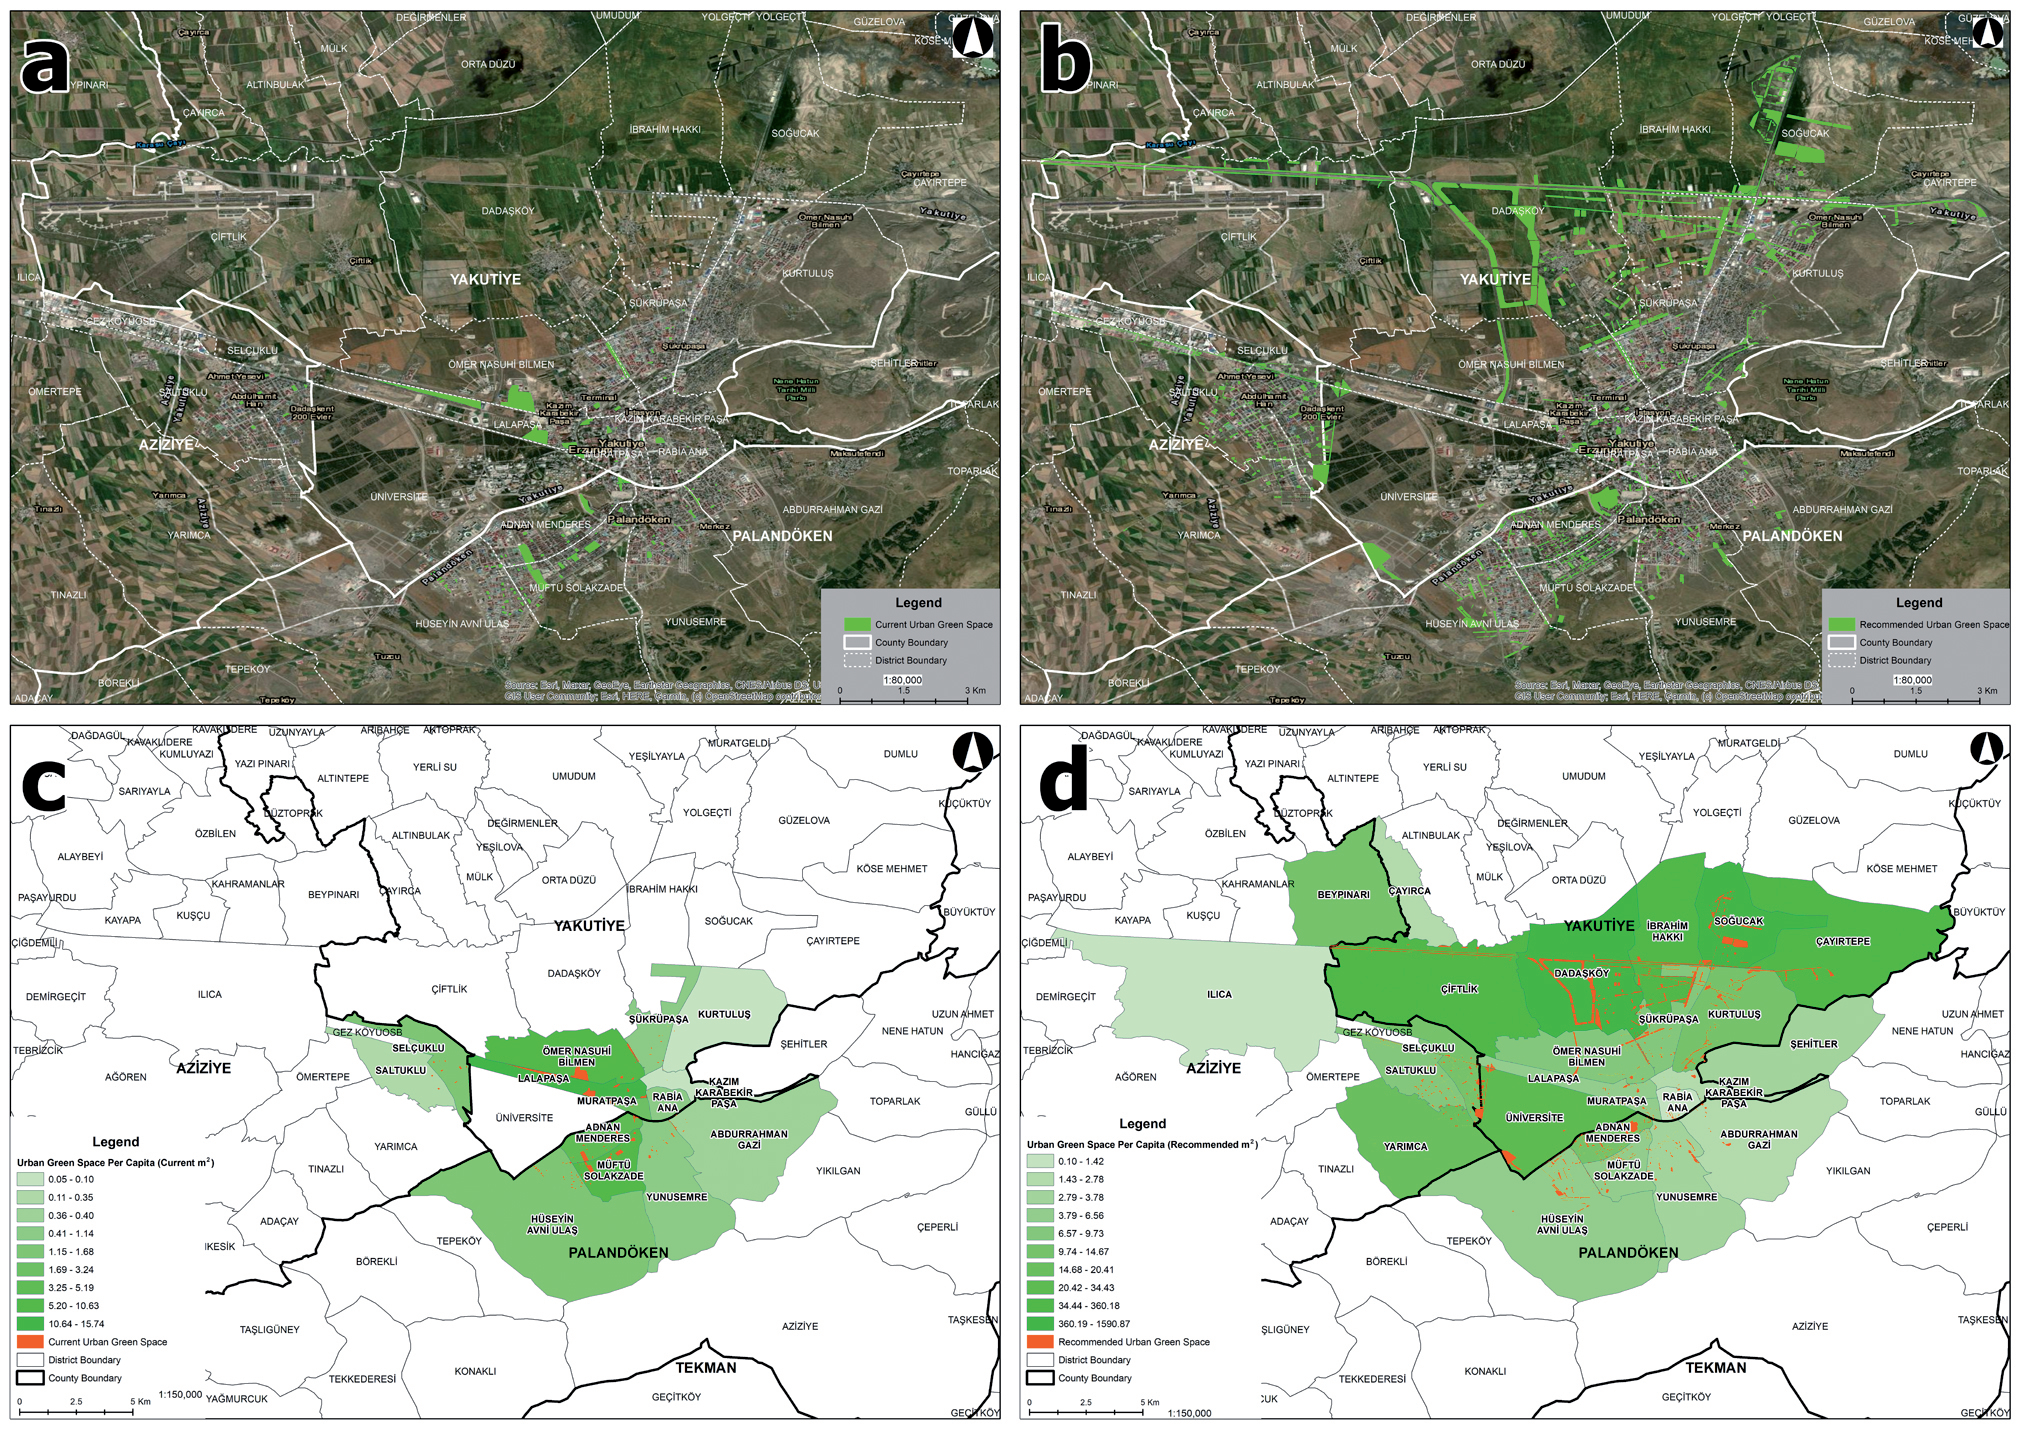
Table 1.
Status of the current park areas in Erzurum city center and the development plan.
Fig. 2.
Accessibility of parks (a,b-existing, c,d- Proposed according to the zoning plan), children’s playground. (e-existing, f- Proposed according to the zoning plan) and Parks walking distance.
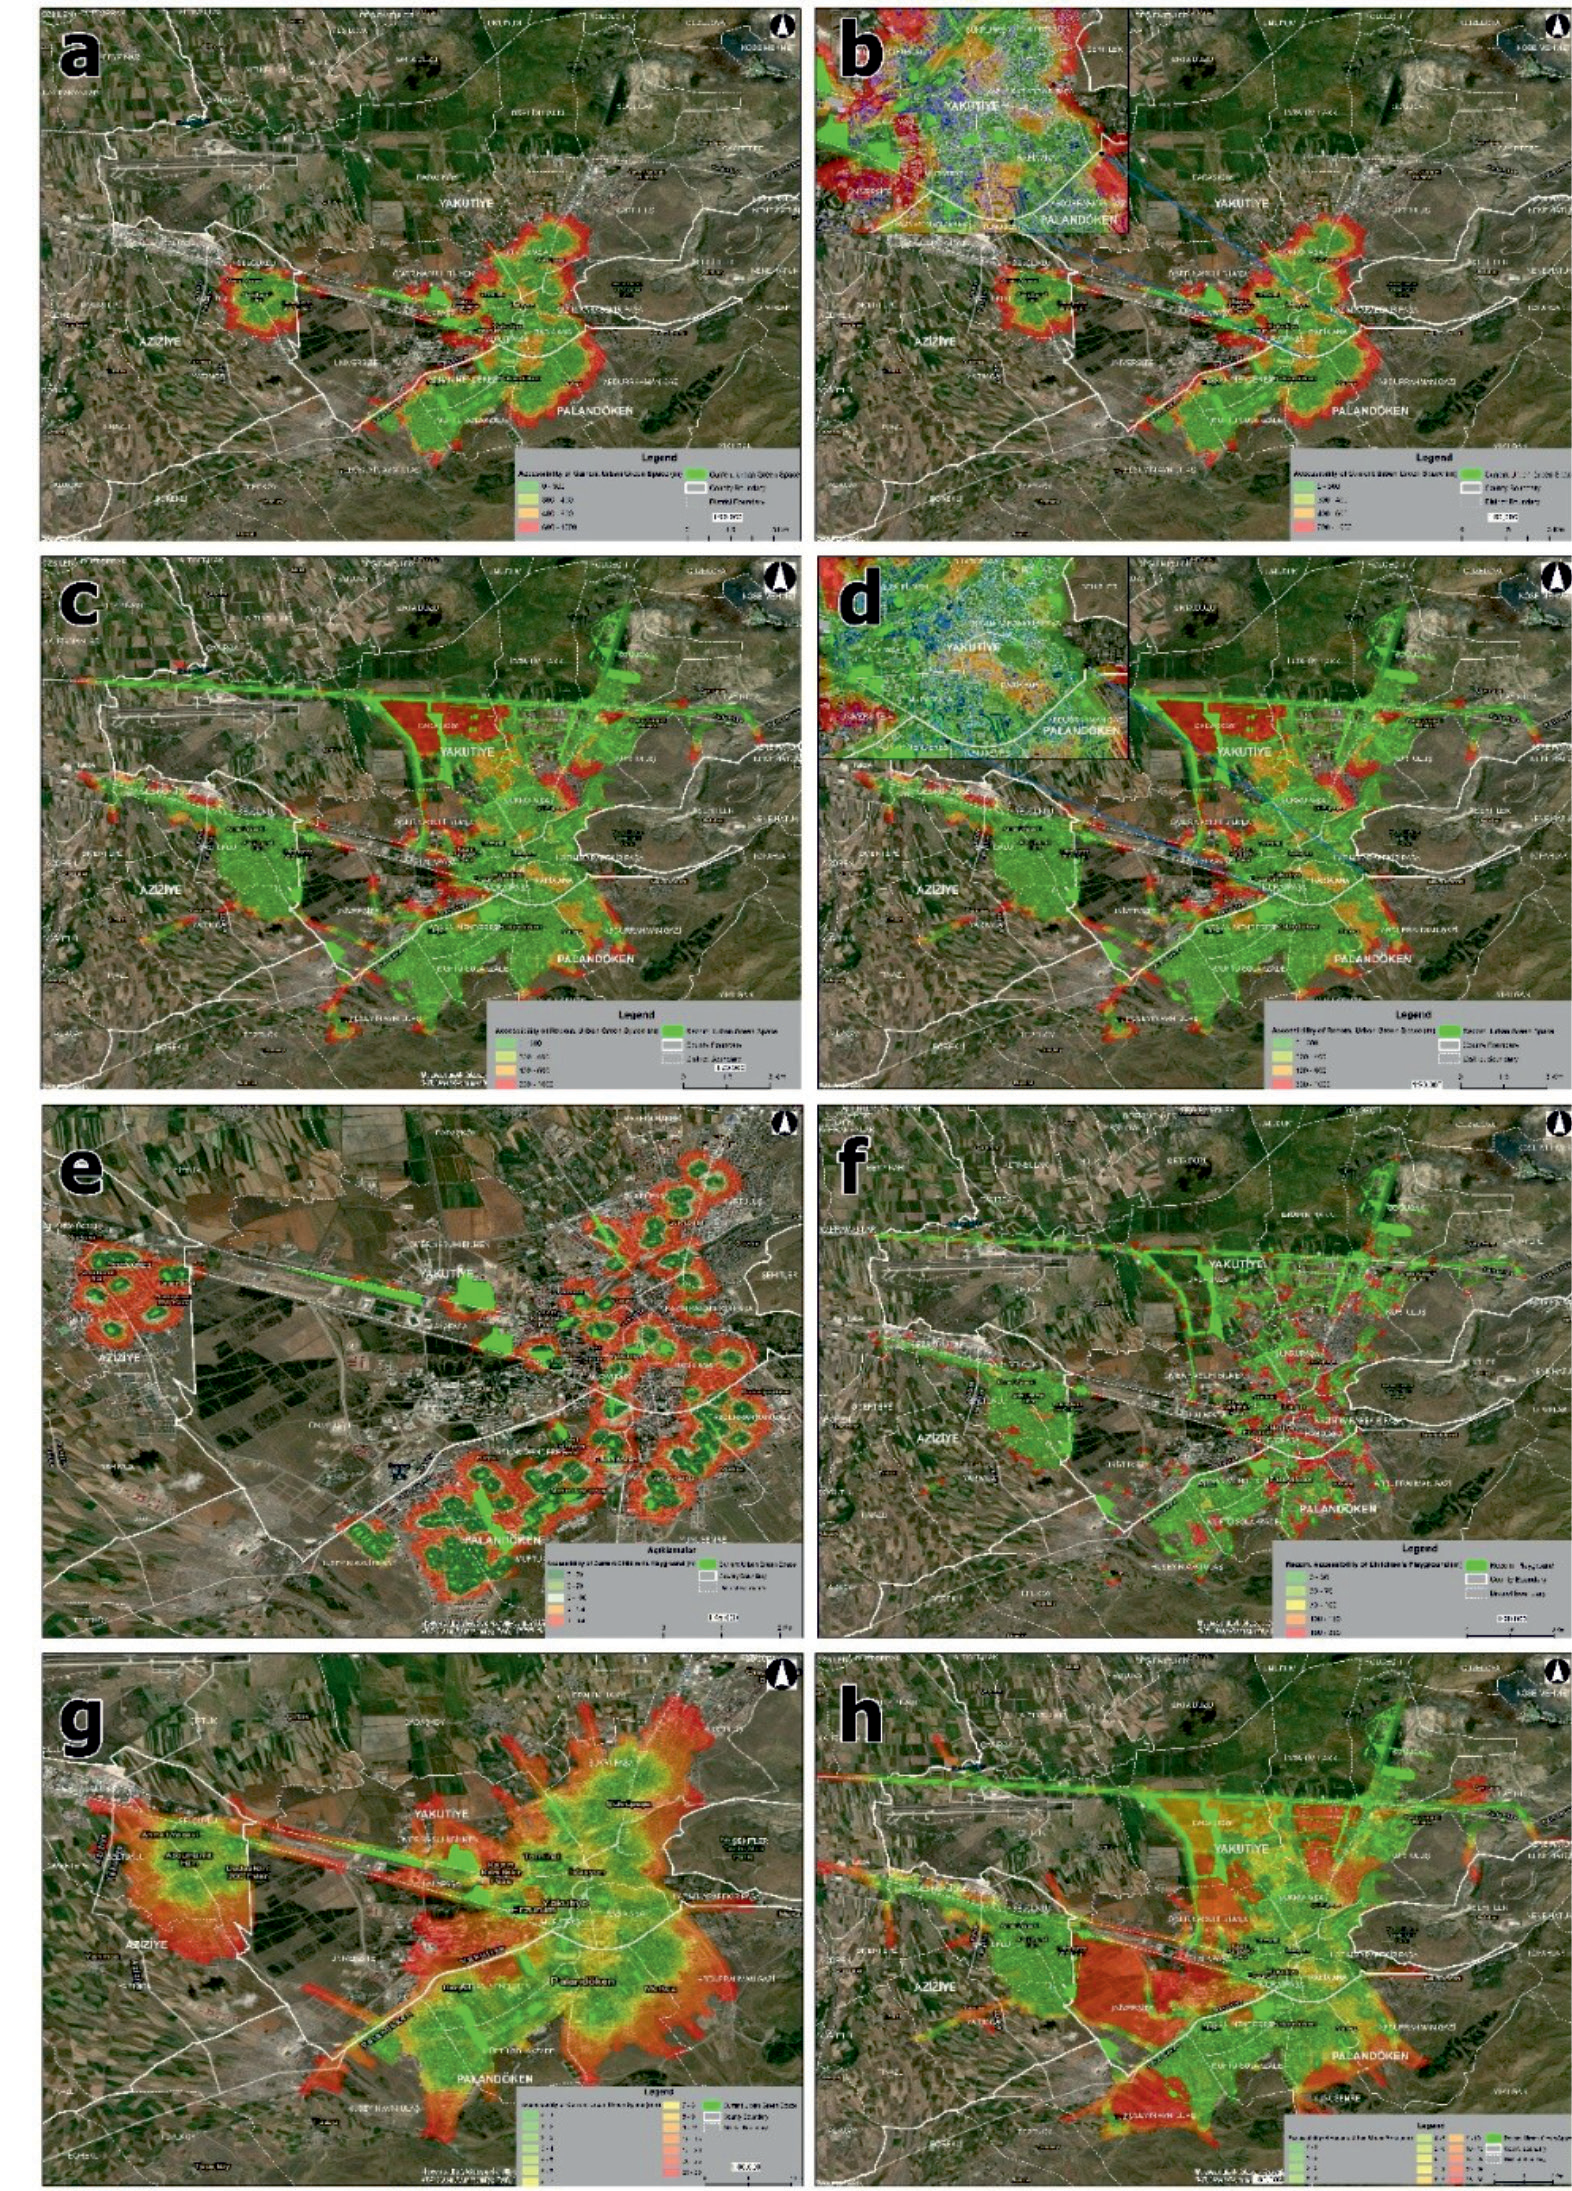
Table 2.
Accessibility of existing park spaces.
Table 3.
Accessibility of proposal parks spaces.
Table 4.
Accessibility to existing children’s playgrounds.
Table 5.
Proposed children’s playground accessibility.
Method
In the study, data collection, analysis, synthesis, and result methods were used. 1/5.000 scale master and 1/1000 scale implementation zoning plans and reports, orthophotos, and population data for 2015 were used in determining the existence of green areas belonging to the city center. Parks in the study area were determined by satellite images in 2020. The existence of parks planned to be built according to the zoning plan was determined by processing the plans obtained from the municipality. After determining the size and distribution of the park areas, according to the accessibility distances determined in other studies, 300- 400-600-800 and 1000m zones were laid around the park areas and 30-70-100-150 and 350 m zones around the children’s playgrounds [68, 69].
Table 6.
Walking distance to existing park spaces.
Table 7.
Walking distance to the proposed parks.
In the evaluation of accessibility, the building layer, the independent section table related to the building, the street layer suitable for establishing a network data set, the existing park and green areas layer, the park and green areas layer in the zoning plan, the neighborhood layer, and the neighborhood population data obtained from TUIK. The desktop is processed using the ArcGIS Network Analyst module. The number of independent units (flats) integrated into the Spatial Address Registration System (MAKS) in the City Information System (KBS) was extracted on a neighborhood basis, and the average number of people living in a residential type independent section in a particular neighborhood was estimated. The existing public parks and green areas have been updated with data obtained from the park gardens directorate. Assuming that a person walks an average of 4 km per hour, the Network data set is set to calculate service areas by using the network analysis toolbar in the ArcMap interface. The accessibility of green areas has been determined based on standards.
Results and Discussion
According to the data for 2020, the total population of Erzurum city center neighborhood was obtained from TUIK as 417,784 people. 43.3% of this population lives in Yakutiye, 41.4% in Palandöken, and 15.1% in Aziziye. The most populated neighborhoods in terms of population are Saltuklu Neighborhood (22.923 people) in Aziziye Neighborhood, Şükrüpaşa Neighborhood (36.294 people) in Yakutiye Neighborhood, Yunusemre Neighborhood (44.158 people) in Palandöken Neighborhood. All plans in the 1/1000 scale implementation development plan of Erzurum city center were combined and examined based on topological controls. Accordingly, the plan islands (excluding the road reinforcement area) have a total area of 91 km2. According to 2015 zoning data, it was found to be 672.90 ha when active and passive green areas in Erzurum city center are processed.
If the current place is evaluated in the parks in Erzurum city center, the existing park area in 2020 can be found as 120.24 ha after topology controls (Fig. 1). In the zoning plan, the total park area is thought to be 652.3 ha. As of 2020, when the existing parks were evaluated, a total of 121 parks were determined. The zoning park area is planned as 1329 units. When the existing parks in the city center are evaluated, the greatest number of parks is in the Hüseyin Avni Ulaş neighborhood (24), according to the zoning plan, it is located in Saltuklu Neighborhood (200 units). The maximum park area per person is currently determined as 15.7 m2 in Lalapaşa Neighborhood. According to the zoning plan, the size of the parking area increases by 82% in total (Table 1). According to 2020 data, the amount of park space per person has been determined as 3.07 m2. According to the zoning plan, the amount of park area will be 16.7 m2 per person. The distribution of existing and proposed parks in Erzurum city center per neighborhood is given ie Fig. 1.
According to the study, the 300-400-600-800, and 1000 m zones around the park areas are currently being actively used and the study area and planned area are both 91 km2 in size, with a population of 417,784 in the three neighborhoods, the 300 m accessibility to the park areas will amount to 16% and 50% of the population can access them. The zoning plan shows that the 300-400-600-800 and 1000 m zones thrown around the park areas cover 47% of the city center and 77% of the population can access the park areas within 300 m. (Fig. 2) (Table 2; Table 3).
When the existing parks are evaluated, it is seen that the accessibility of the parks is concentrated in the city center and the access to the urban fringe is reduced.
The accessibility of the children’s playground has been determined by throwing 30-70-100-150 and 350 m zones around the children’s playgrounds according to the current situation and the situation in the development plan (Fig. 2). The total area of the city center is 91 km2 according to the plan islands. For these children’s playgrounds, the distance of 30 m is 5% (Fig. 2). Considering the children’s playgrounds according to the zoning plan, this ratio will be 27% when the 30 m distance is considered (Table 4; Table 5).
When the number of people living in the city center and the accessibility of the available green areas are evaluated,20% of the population, 6% within walking distance 1. And 26% of them reach green areas in more than 10 minutes (Fig. 2) (Table 6; Table 7).
Conclusions
The intense industrial activities that developing societies are exposed to and the effects of the phenomenon of immigration directly affect the ecological, economic, social, and socio-psychological relations of the people of the city with each other and their environment. The healthier and better quality of these relationships and the desire of individuals from all walks of life to become urban depends on the structure, function, and density of open and green spaces in the city. In addition to the physical and ecological benefits of the open and green spaces in the city, these spaces also have social benefits that strengthen the educational and social communication of individuals.
Open and green spaces in cities are important for solving environmental problems in the city, creating a comfortable and relaxing natural environment for the city’s citizens, and showing an awareness of socializing and urbanization. Open spaces in the city play a crucial role in creating more modern, livable, healthy cities and societies. In determining the adequacy of green areas in ecologically-based strategic plans to be made in urban areas, not only their numerical size, but also their homogeneity to serve the entire city population and ease with which individuals can access them democratically without facing bias, should be considered. According to Sitorus et al. [70], in their analysis of the adequacy of public open and green spaces in the Capital City of Indonesia, Jember Regency, and thus the direction of the city’s development, public open and green spaces are inadequate. Bako et al. [71], in their study on the adequacy and use of open and green spaces in the city of Ikeja, Nigeria, found that open spaces, parks, and gardens are less than facilities, planning, management, and infrastructure in physical planning practices in the city.
Considering both the ecological characteristics and the economic and socio-cultural identity of the city of Erzurum, it was concluded that the long winter season in the city restricts the socialization of the city people and their use of open spaces. The people of the city meet their recreational needs indoors during this period. Especially in Erzurum, which is a university city, when the student population is considered, the urbanites move away from the activities and forms of socialization specific to their own culture. Yıldız et al. [72], in their study to determine the adequacy of student-oriented landscape use in the University Campus in Erzurum, found that the students’ outdoor use is not sufficient both on the campus and in the city and that there are few effective use alternatives in the city during the busy winter season. Therefore, it is understood that in addition to open and green areas, physical equipment in the city is not sufficient and efficient. Demircan et al. [73] examined the recreational behavior styles of urban people and their use of open green spaces in their study in Erzurum City. As a result, it has been determined that the long winter season in the city brings limitations for the people of the city, and although the presence of active open green areas per person seems sufficient when considering the dynamic urban population, the carrying capacity and physical equipment of these spaces cannot meet the needs of the whole city.
Erzurum city center population is 417,784 people according to 2020 data. 43.3% of this population lives in Yakutiye, 41.4% in Palandöken, and 15.1% in Aziziye. Erzurum city center has a total area of 91 km2 according to the 1/1000 scale implementation zoning plan (excluding road reinforcement area). When active and passive green areas in the city center are processed according to 2015 zoning data, it was found to be 672.90 ha. The current parks were found to be 120.24 ha, and in the development plan, the total park area was considered to be 652.3 ha. As of 2020, when the existing parks are evaluated, a total of 121 parks have been identified. The zoning park area is planned as 1329 units. When the existing parks in the city center are evaluated, the highest number of parks is in the Hüseyin Avni Ulaş neighborhood, and according to the development plan, in Saltuklu Neighborhood. The maximum area of parks per person is currently determined as 15.7 m2 in Lalapaşa Neighborhood. According to the zoning plan, the size of the parks increases by 82% in total. According to 2020 data, the amount of park space per person has been determined as 3.07 m2. That is, the amount of green space is satisfactory for the region.
According to the zoning plan, the amount of park area will be 16.7 m2 per person. When the different zones thrown around the park areas that are actively used in the study area are evaluated, it has been determined that the 300 m accessibility to the park areas covers 16% of the city center and 50% of the city population can access. As a result of evaluating the zones around the park areas in accordance with the zoning plan, it has been determined that the 300 m accessibility to the park areas covers 47% of the city center and 77% of the population can reach the park areas.
Based on the current situation of the children’s playgrounds and the development plan, zones have been established around them, and the accessibility of the children’s playground has been determined. For these children’s playgrounds, the 30 m reach is 5%. Considering the children’s playgrounds according to the zoning plan, this ratio will be 27% when the 30 m distance is considered. When the number of people living in the city center and the accessibility of the existing green areas are evaluated, 20% of the population and 6% of the area are within 1 minute. 26% of them reach green areas in more than 10 minutes. The existing open green areas, which are scattered in small pieces in the city center, will increase the efficiency of the green areas and increase the well-being of city people. Green areas determined in the zoning plans should be designed aesthetically and functionally, paying attention to the economic, social, cultural, and ecological characteristics of the city. The distribution and density of open green spaces should be equal for all neighborhoods in the city center.
In conclusion, to make Erzurum a modern, healthy, and livable place, it is necessary to increase the quality and quantity of open green spaces above the standards. In addition to the socio-cultural and traditional structure of the city, urban spaces should be created that can be used by individuals who live permanently or temporarily throughout the year, especially with open space management plans to be made on a large scale. As a means to ensure the sustainability of open and green spaces in the city, temporary changes in these areas should be included in the planning with technical and scientific principles, considering their quantity and quality. The findings obtained as a result of the study showed that the efficiency of active open and green areas in the city of Erzurum, the urbanization process and density, and the urban identity values of the city, have shown that planning systems and implementation methods are required for green areas. The intensity of practices and recreational activities that will support public awareness and love of nature should be increased in open and green spaces throughout the city, and in this way, the contribution of open and green spaces to urban development should be considered.

