

Introduction
Since people spend most of their time (80-90%) in indoor environments, it is necessary for public, commercial, and private buildings to achieve high indoor air quality (IAQ) and comfort levels [1]. IAQ has a substantial influence on human health and well-being. Prolonged exposure to indoor pollutants can result in building-related illnesses such as respiratory illness, cardiovascular lung disease, and sick building syndrome [2-5]. Moreover, poor IAQ also impacts on performance and productivity [6, 7]. A study showed that it can decrease office productivity by 6-9%. A cause of lower performance possibly comes from common symptoms such as headache and low comfort levels such as higher temperature which are related to poor IAQ [8].
Unlike outdoor pollutants, indoor pollutants are affected by occupant behavior and activity, building materials and furnishing, electronic equipment, consumers and cleaning products, cooling and ventilation systems, and outdoor air quality [4, 9, 10]. Type and quantity of indoor air pollutants are mostly affected by various forms of occupant activity in indoor environments [11]. Indoor pollutants include various toxic gases and vapors (such as ozone, carbon monoxide, formaldehyde, and volatile organic compounds), particulate matter (PM), fibers, and bioaerosols such as bacteria and fungi [9, 12]. Activities such as speaking, sneezing, and coughing can generate airborne biological particulates, and this is considered a major factor in the buildup and spread of bioaerosol contamination [13, 14].
Different variables impacting IAQ lead to a wide range of studies in various indoor environments including public, commercial, and private buildings, and other specific purposes [10, 15-17]. Several studies evaluated IAQ in libraries and investigated the impacts on human health, materials, or procedure products or procedures [18-20]. A study in Mexico reported that the mean hourly values of carbon dioxide (CO2), and temperature in a library and coffee shop are higher than the ASHRAE recommendation [21]. An IAQ of a library in China showed various concentrations of CO2, PM2.5, formaldehyde, and TVOC were found. CO2 and PM2.5 levels in reading rooms are greater than in book-holding rooms [22]. The investigation of IAQ in Turkey suggested that due to natural ventilation, the IAQ of libraries is influenced by many parameters related to both indoor and outdoor environments. Therefore, mechanical ventilation is more effective for controlling IAQ [23]. Modeling for airborne fungal concentration indicated that indoor environmental parameters such as %RH and PM2.5 and potential confounders were associated with fungal concentrations in university library rooms [24].
Although IAQ in libraries was studied in several countries, the data is lacking in Thailand. This study aims to investigate IAQ in different microenvironments of a university library in Thailand. The findings from the study will provide information and guidance for IAQ management and control for libraries.
Material and Methods
Site Description
In this study, IAQ measurements were conducted in a library located in the northeast region of Thailand. The library consists of three buildings with a total area of 23,434 m2. The first building with 4 floors (3,694 m2) and the second building with 6 floors (8,490 m2) are equipped with a central air-conditioning system; however, some areas employ a combination of central air-conditioning (CAC) ceiling diffusers and split-type air conditioning, such as reading rooms in the first building and librarian working areas in the second building. The third is the newest building with 9 floors (11,250 m2) equipped with CAC ceiling diffusers for air conditioning on each floor.
IAQ measurements at the library were performed in 35 areas and classified by different activities and tasks into 4 microenvironments: reading (RZ), librarian (LZ), cafe shop (CZ), and photocopy shop (PZ) zones. The main characteristics of each zone are shown in Table 1. The measurements were undertaken from September - December 2019, and this study protocol was approved by Khon Kaen University’s Ethics Committee.
Monitoring and Instruments
IAQ measured in each microenvironment was described by 4 parameters including particulate matter (PM), bioaerosols, carbon dioxide, and comfort parameters. These parameters were measured using real-time and offline methods with duplicate sampling.
Indoor particles in terms of PM2.5, PM4, and PM10 concentration were measured by real-time using a handheld aerosol monitor with a light scattering technique, a range of 0.001-150 mg/m3, and ±5% flow accuracy (DustTrak, Model 8533, TSI, USA). The PM was measured for 8 hours with data logged at 30 minutes. Moreover, respirable dust concentration was measured by the offline method in accordance with NIOSH method 0600. Sampling air was drawn through an aluminum cyclone and PVC filter at an airflow rate of 2.5 L/min using a personal pump (SKC, Model 224-PCXR4, USA) with 8-hour sampling time. The mass concentration was analyzed using a gravimetric technique and sampling air volume.
Bioaerosols were described as bacteria and fungal concentrations. Following NIOSH method 0800, the sampling was collected using a portable single-stage bio-impactor air sampler (SAMPL’AIR™Lite, BioMérieux, USA) with an airflow rate of 100 L/min and sampling time of 3 minutes (300 L) for each sampling. Tryptic soy agar and malt extract agar were used as sampling media for bacteria and fungi, respectively. After sampling, they were incubated at 37ºC for 24 hours for bacteria, whereas at 25ºC for 48 hours for fungi. The colonies formed on the plates were counted and bioaerosol concentrations were reported as colony-forming units per cubic meter of air (cfu/m3). During the sampling, temperature and %RH were also recorded using a digital thermo-hygrometer, 0-50ºC with ±1ºC accuracy for temperature, and 10-95% with ±5% accuracy for %RH (Solution Corner 1998, Thailand).
CO2 concentration and comfort parameters in terms of temperature and relative humidity (%RH) were recorded with a real-time instrument (Q-TRAK, Model 7575, TSI, USA), 0-5,000 ppm with 3.0% accuracy for CO2, 0-60ºC with ±0.5ºC accuracy for temperature, and 5-95% with ±3% accuracy for %RH. The data were corrected every 30-minute average for 8 hours. Air velocity was also determined by a hot wire anemometer with a range of 0-30 m/s, and ±3% accuracy (TSI, Model 9545, USA). All samplings in this study were collected at a height of 1.2 meters above the ground, corresponding to the sitting breathing zone.
Table 1.
Characteristics of the library zones.
Statistical Analysis
Data analysis was performed with STATA Statistics software version 10.1. Due to non-normal distribution, Kruskal-Wallis tests were applied to compare the median values of IAQ parameters in different zones. Correlation analysis was analyzed using Spearman’s correlations for the real-time indoor pollutants of the library (CO2, PM2.5, PM4, PM10, air temperature, and %RH).
Results
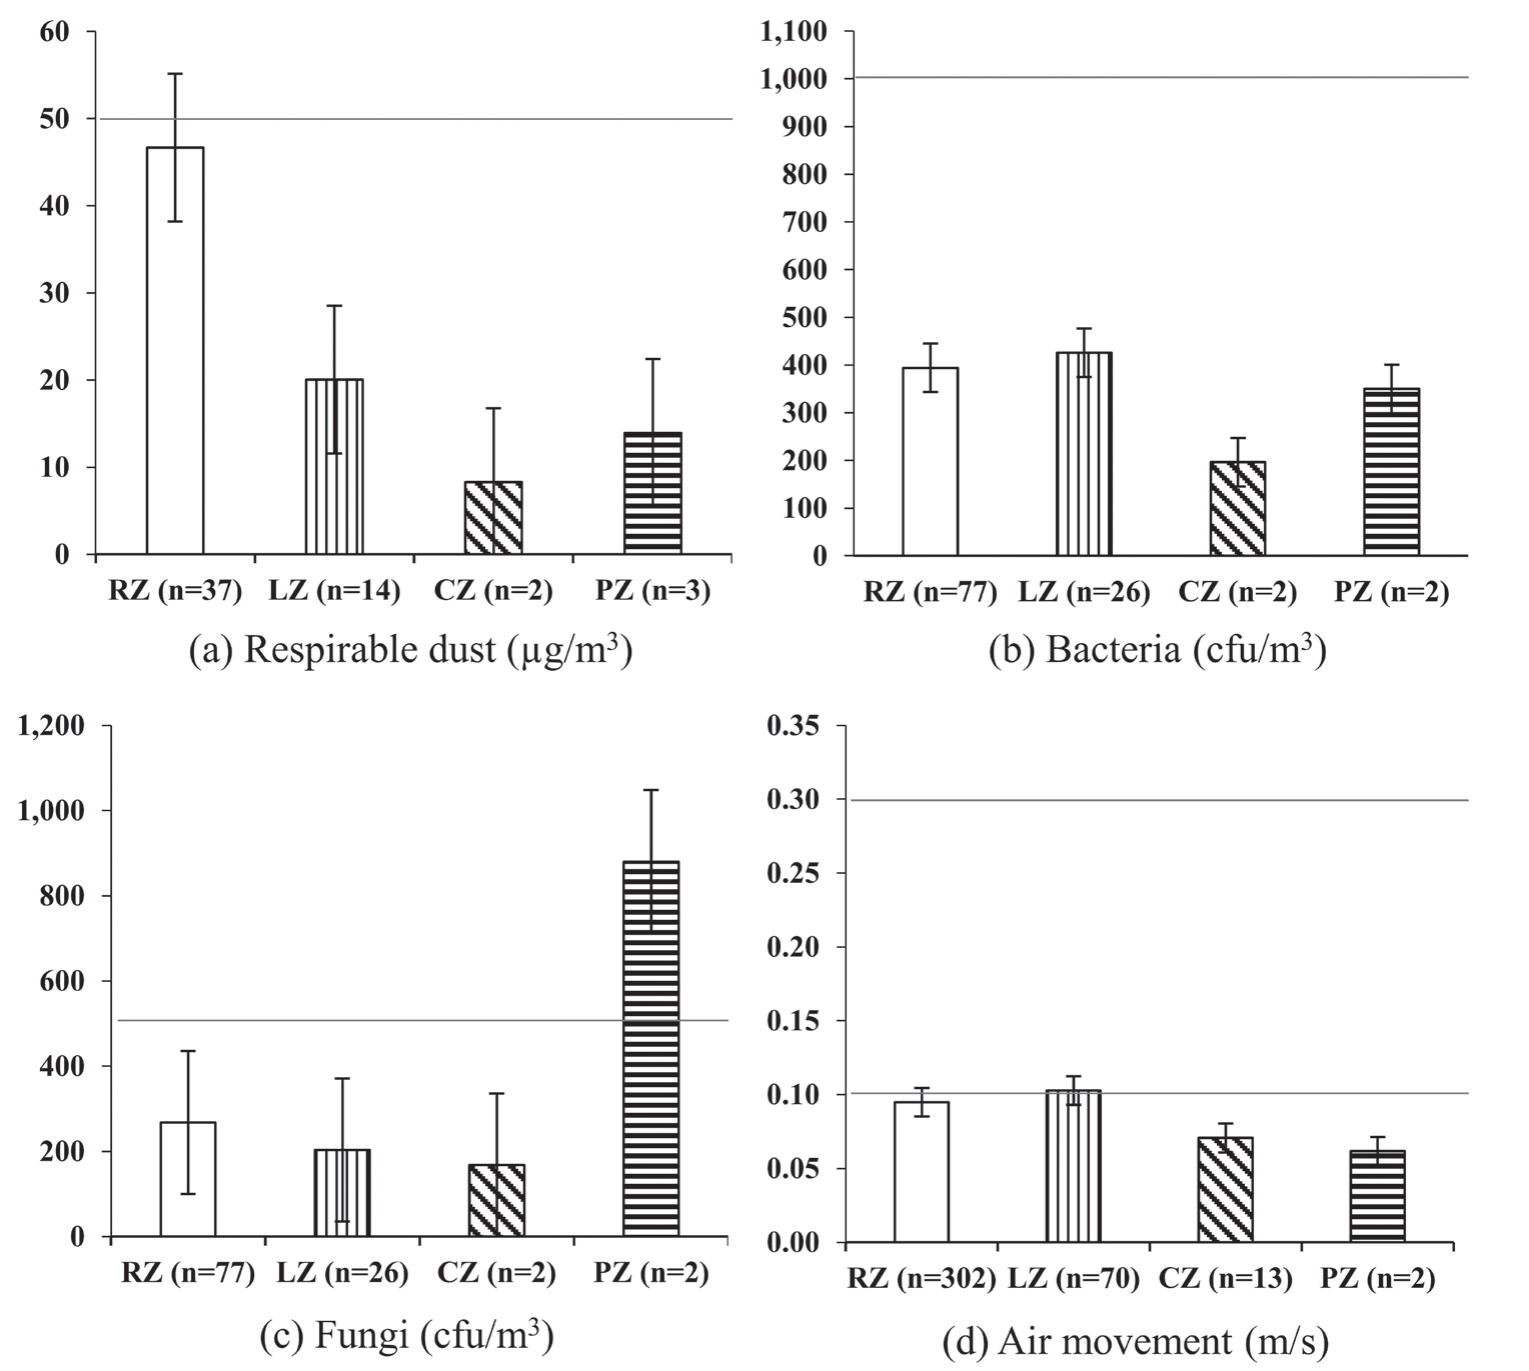
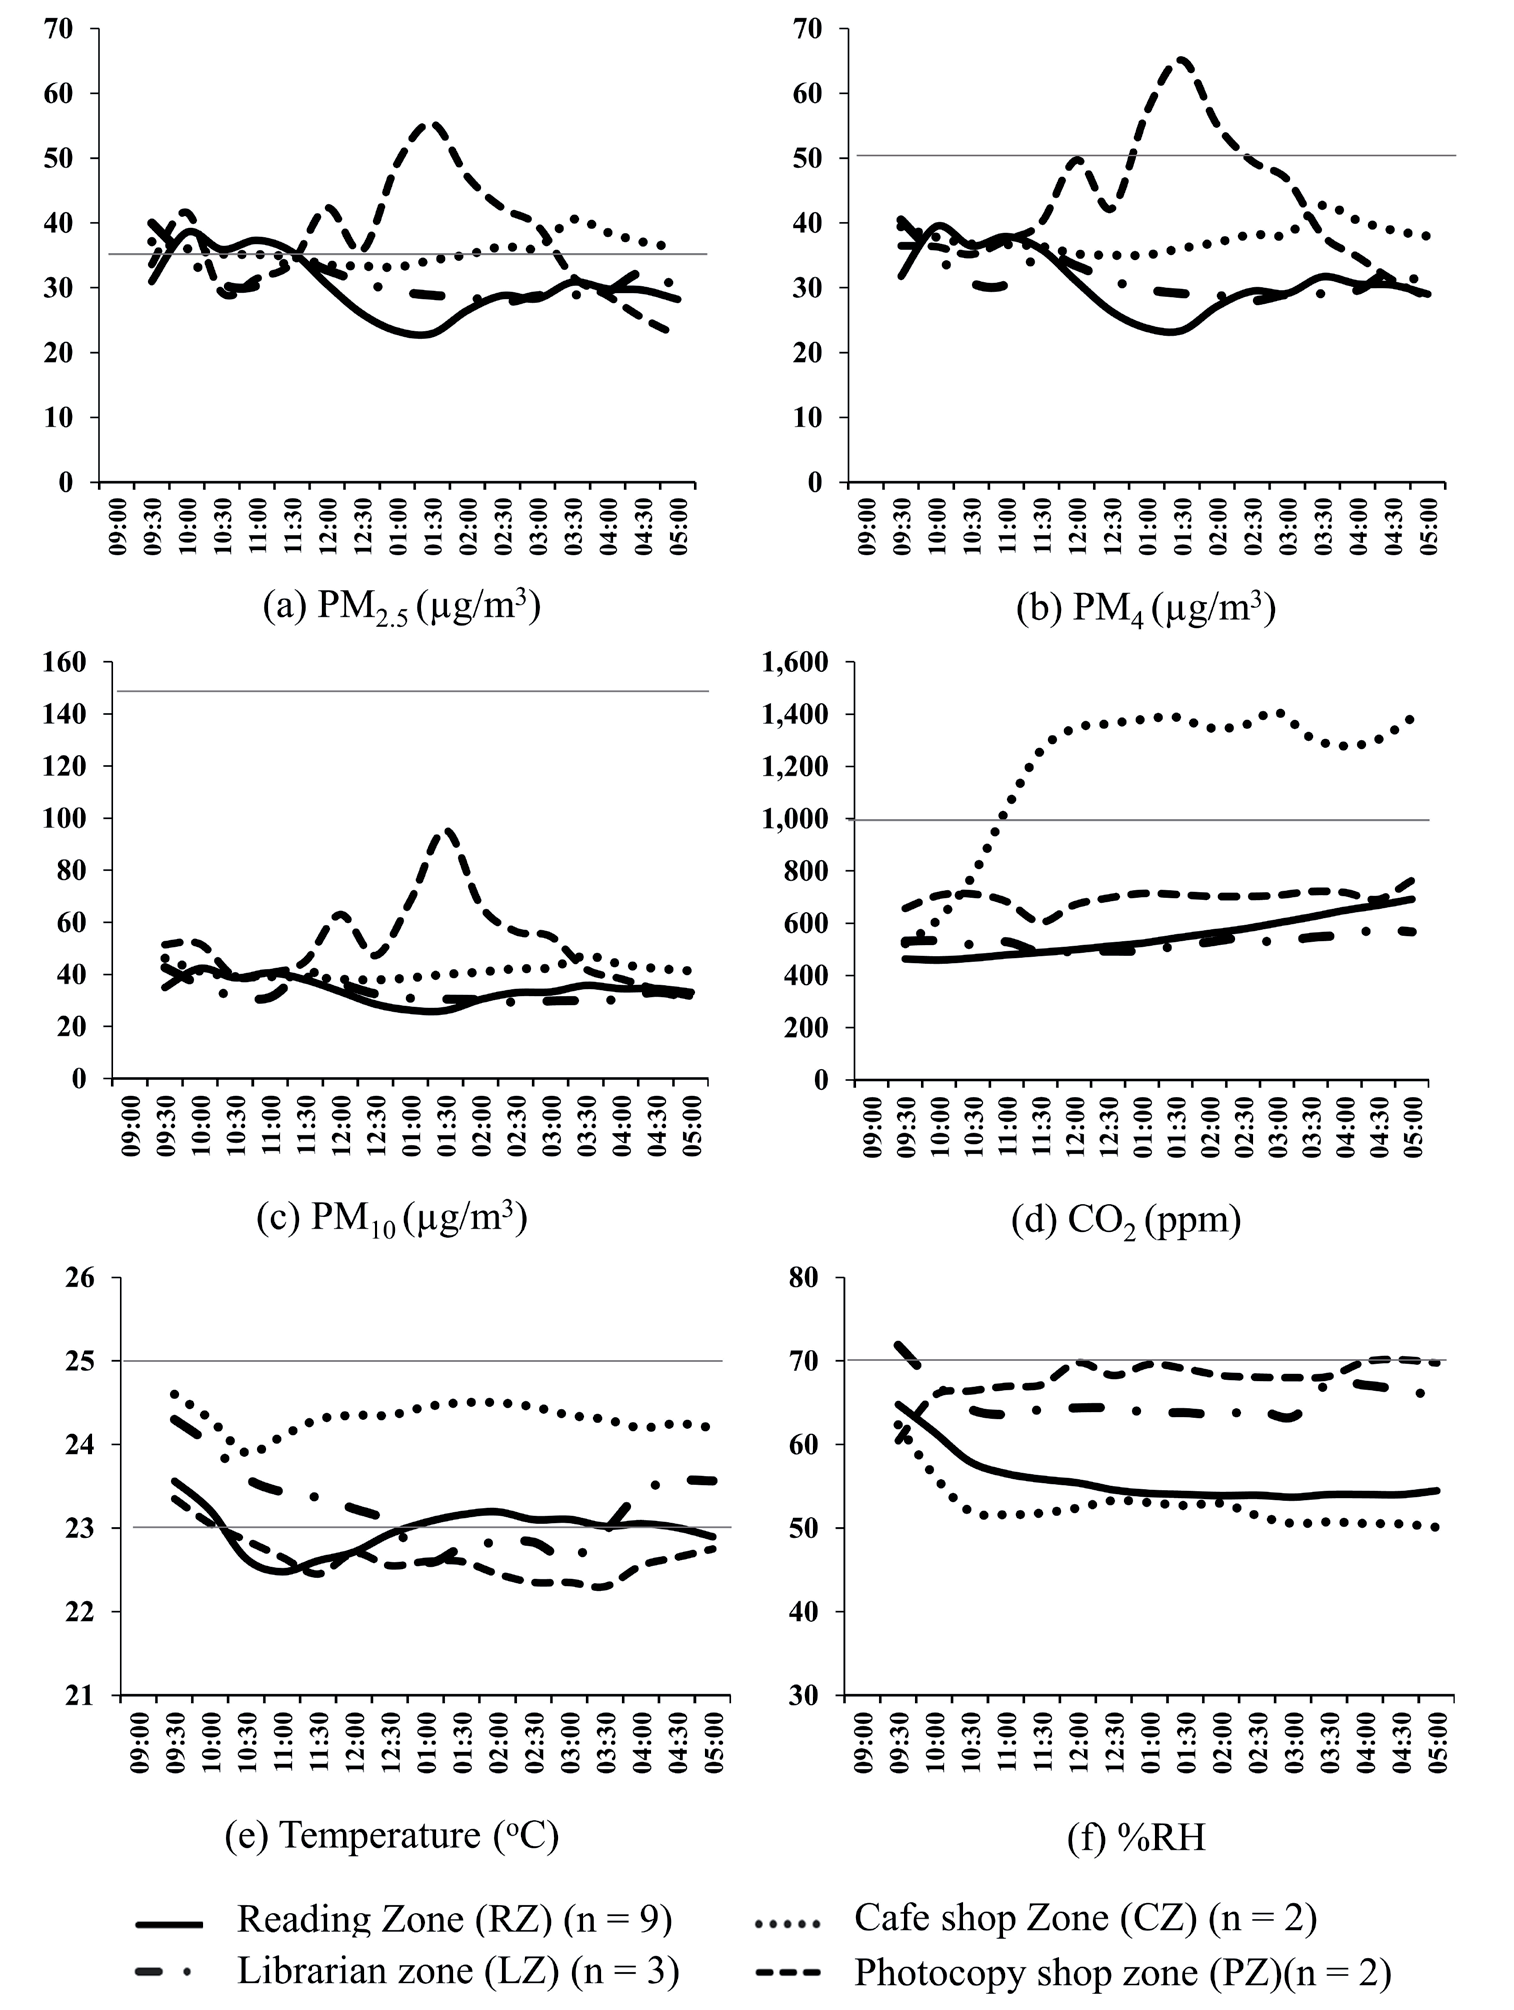
IAQ parameters measured by the offline method were described in Fig. 1, and the real-time method in Fig. 2. Table 2 shows the mean and median of data from both methods.
The mean respirable dust in the library ranged from 4.1-46.7 ug/m3 with the highest mean in RZ and the lowest in CZ (Table 2). Some data in RZ exceeded the Singapore standard (50 ug/m3) (Fig. 1a). PM2.5, PM4, and PM10, were found highest in PZ with the mean of 36.9, 42.7, and 51.6 ug/m3, respectively (Table 2). The temporal variation showed that PM2.5 in PZ was higher than the standard during 11:30 am-3 pm, whereas 12:30-2 pm for PM4 (Fig. 2(a, b)). Moreover, PM2.5 in CZ was also above the standard during 3-5 pm (Fig. 2a).
Bioaerosol mean concentrations in different library zones varied from 196.1-425.8 cfu/m3 for bacteria and 167.8-879.9 cfu/m3 for fungi (Table 2). The bacteria mean concentrations in all zones were lower than the standard (1,000 cfu/m3), with the highest mean concentration in LZ (Fig. 1b). However, we found some bacteria concentrations were above the standard in LZ and RZ at the maximum of 1,265 and 1,820 cfu/m3, respectively (Table 2). For fungi, most mean concentrations in all zones were below the standard (500 cfu/m3), except in PZ (879.9 cfu/m3) with 3.3-5.2 times higher than the other zones (Fig. 1c). However, we found some data were above the standard in RZ at the maximum of 2,481 cfu/m3. During the biological sampling, the temperature and %RH ranged from 24.9-26.8ºC and 55.5-68%, respectively.
The mean concentrations of CO2 across 4 zones ranged from 526.9-1,192.6 ppm with the highest in CZ and the lowest in LZ (Table 2). The temporal variation of CO2 concentrations showed that during 10:30 am- 5 pm, the concentration in CZ exceeded the standard (1,000 ppm). During 11:30 am-5 pm, CO2 concentrations in CZ were approximately 2-3 times higher than in the other zones (Fig. 2d).
For the comfort parameters, the temporal variation showed that all temperature in CZ and most in LZ and RZ met the standard (23-25ºC), whereas temperature in PZ was below the standard (Fig. 2e). %RH of all zones were below the standard (70%), with the highest in PZ and the lowest in CZ (Fig. 2f). The means of air movement in library zones varied from 0.06-0.1 m/s with the highest in LZ, only one met the standard (0.1-0.3 m/s) (Fig. 1d and Table 2).
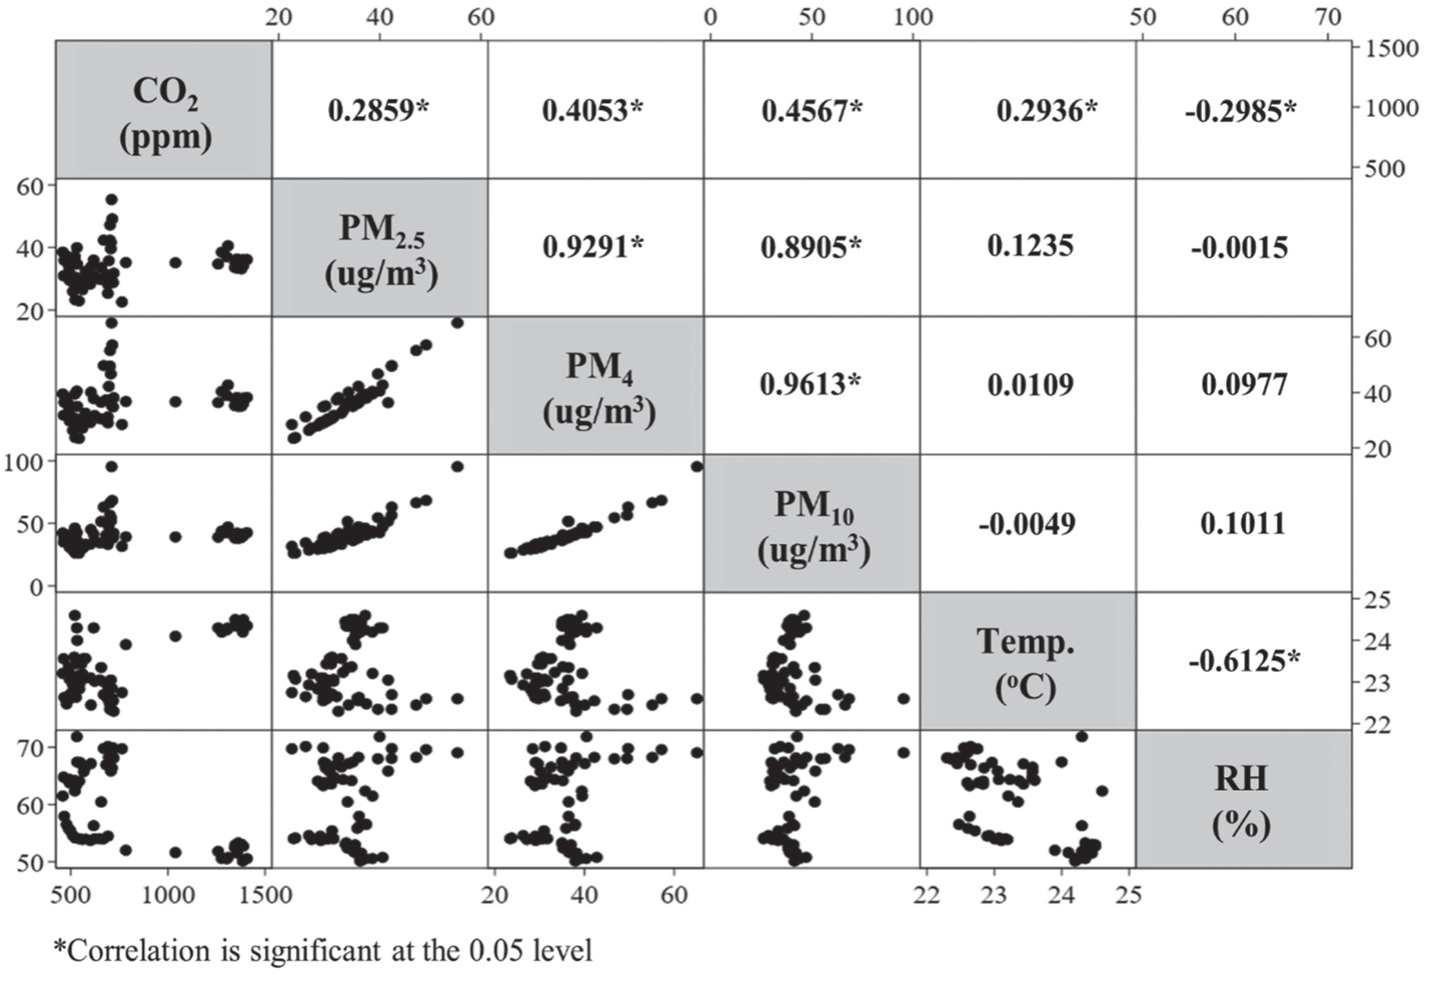
Correlation among real-time IAQ parameters was demonstrated in Fig. 3. According to the interpretation [25], PM4 concentration was the highest correlated and very strong correlation with PM10 (rs = 0.96) and PM2.5 (rs = 0.93). PM2.5 and PM10 had a strong correlation (rs = 0.89). Some parameters were found the moderate correlation including %RH and temperature (rs = -0.61), CO2 and PM10 (rs = 0.46), and CO2 and PM4 (rs = 0.41). All correlations were statistically significant.
Discussions
Particles and Bioaerosols in Different Library Zones
PM2.5, PM4, and PM10 concentrations were found to be the highest in PZ when compared with other zones, especially in the afternoon due to more photocopy printing operations in the library. This aligns with other studies reporting that PM2.5 was above the permissible levels during working hours in photocopying machine areas [26, 27]. The maximum of PM2.5 and PM10 concentration was reached below the limit value after air exchange and forced ventilation were implemented, due to the efficient reduction of the dispersion of suspended particles [27]. In addition, PM0.23-20, PM2.5, and PM10 generated by printers and photocopiers significantly impact particle mass concentrations during printing 500 pages [28]. However, the respirable dust concentration was the highest in the RZ. This situation might be influenced by decorating and constructing some areas next to the RZ in the library during the period of sampling. Respirable dust could be emitted from interior decoration and construction processes of buildings [29, 30].
The mean bacteria concentration in LZ was highest when compared with the other zones, but it was lower than the recommended value. The temperature at LZ was lower than in RZ with statistical significance. The temperature could affect bacteria concentration which is supported by a study reporting that a reading hall in a library found 1,460 cfu/m3, the highest concentration when compared with the other zones. The temperature in the reading hall was the lowest (27.4ºC) when compared with the other zones [31]. In addition, the frequency of cleaning in LZ might be less than RZ, and higher numbers of trash bins in LZ were observed. The results were consistent with a study suggesting a positive relationship between culturable bacteria and the number of garbage cans and freezers [32].
The average fungal concentration in PZ (879.9 cfu/m3) was highest when compared with the other zones and was triple of these concentrations at RZ, LZ, and CZ. This was caused by the highest %RH in PZ than other zones and the same as the limit value and some sampling points were higher than the standard. In addition, PZ had the highest PM2.5, PM4, and PM10 concentrations could result in the highest fungal concentration because of carried fungi on dust [33, 34] A research of fungal concentrations in a Chinese library indicated that the concentrations were significantly 1.7 times higher in rooms with %RH≥60 compared to rooms with %RH<60 [24]. The finding supported our study that the highest fungal concentration was found in PZ with %RH reaching nearly 70. From observation during the sampling, water condensation in air ducts was found in PZ which may promote fungal growth according to the study reporting the effect of condensed water in a supply air duct on spore increase in an experimental ventilation setup [35]. These variations potentially result from the main activities, seasonal variation of the sampling site, regularly cleaning the facilities, and air filtration, according to several studies [32, 36]. Therefore, occupant activities, ventilation, sample source, and interior microclimatic conditions play major roles in the variation of airborne fungal concentrations.
CO2 and Comfort Parameters in Various Library Zones
The average CO2 concentration in CZ was the highest and exceeded the standard when compared with the other zones. The higher occupancy and visitors were observed in CZ. Particularly in the afternoon, around 70 people or more visited and spent time in CZ which may increase the CO2 level. Similar results were found in the studies reporting that CO2 concentration was shown to be influenced by occupant-related parameters such as CO2 emission rate and occupancy density [37, 38]. Moreover, a study illustrated that periods of increased occupancy were associated with transient peaks in CO2 levels in the library area [39].
Table 2.
. Comparison of indoor air parameters in different zones of the library.
Fig. 3.
Spearman’s correlations coefficient matrix for the real-time indoor pollutants and comfort parameters of the library.
In this study, the air movement in most zones was lower than the standard. In particular, the average air velocity at PZ and CZ was the lowest when compared with the other two zones. As a result, the workers and students might be affected by perceived thermal discomfort. Thermal comfort, air conditioning, and ventilation for indoor air in the library should be monitored and maintained because of its increased performance and well-being for occupants and visitors, and ventilation energy consumption. This reason was supported by the prior study [40]. In addition, lower air movement in PZ and CZ could affect IAQ pollutants accumulation in PZ (fungal concentration) and CZ (CO2 level). This aligns with the results of a study reporting that setting the air conditioning to the ON position (window closed) in the private car cabin, could reduce exposure to CO2 and PM to acceptable limits [41]. The real-time temperature data in RZ and LZ sometimes were below the lower limit value. However, in PZ they were lower than the limit almost all day, and the trend of real-time %RH almost reached the limited value (70%). This might cause worker discomfort. Ramalho et al. [42] reported a weak correlation between CO2 and PM (PM2.5 and PM10) in dwellings. However, the authors suggested that the correlation might be stronger if both parameters were measured in the same room which aligned with this study reporting the moderate correlation between CO2 and PM (PM10 and PM4). In addition, the authors endorsed the recommendation of CO2 monitoring as an indication of air stuffiness. However, although low CO2 levels are frequently seen as good ventilation, reducing pollutant sources is required to obtain satisfactory IAQ.
Application of Research Findings
For the finding, IAQ in PZ and CZ needs to be improved by the application of suitable methodologies. For PZ, periodic cleaning and maintenance of air conditioning systems help to maintain acceptable IAQ. To improve IAQ, specifically CO2 in CZ, it should be applied and integrated survey sensor technology into the central mechanical ventilation systems or split-type air conditioners to provide the optimal IAQ for the zone and contribute to energy-efficient CAC systems.
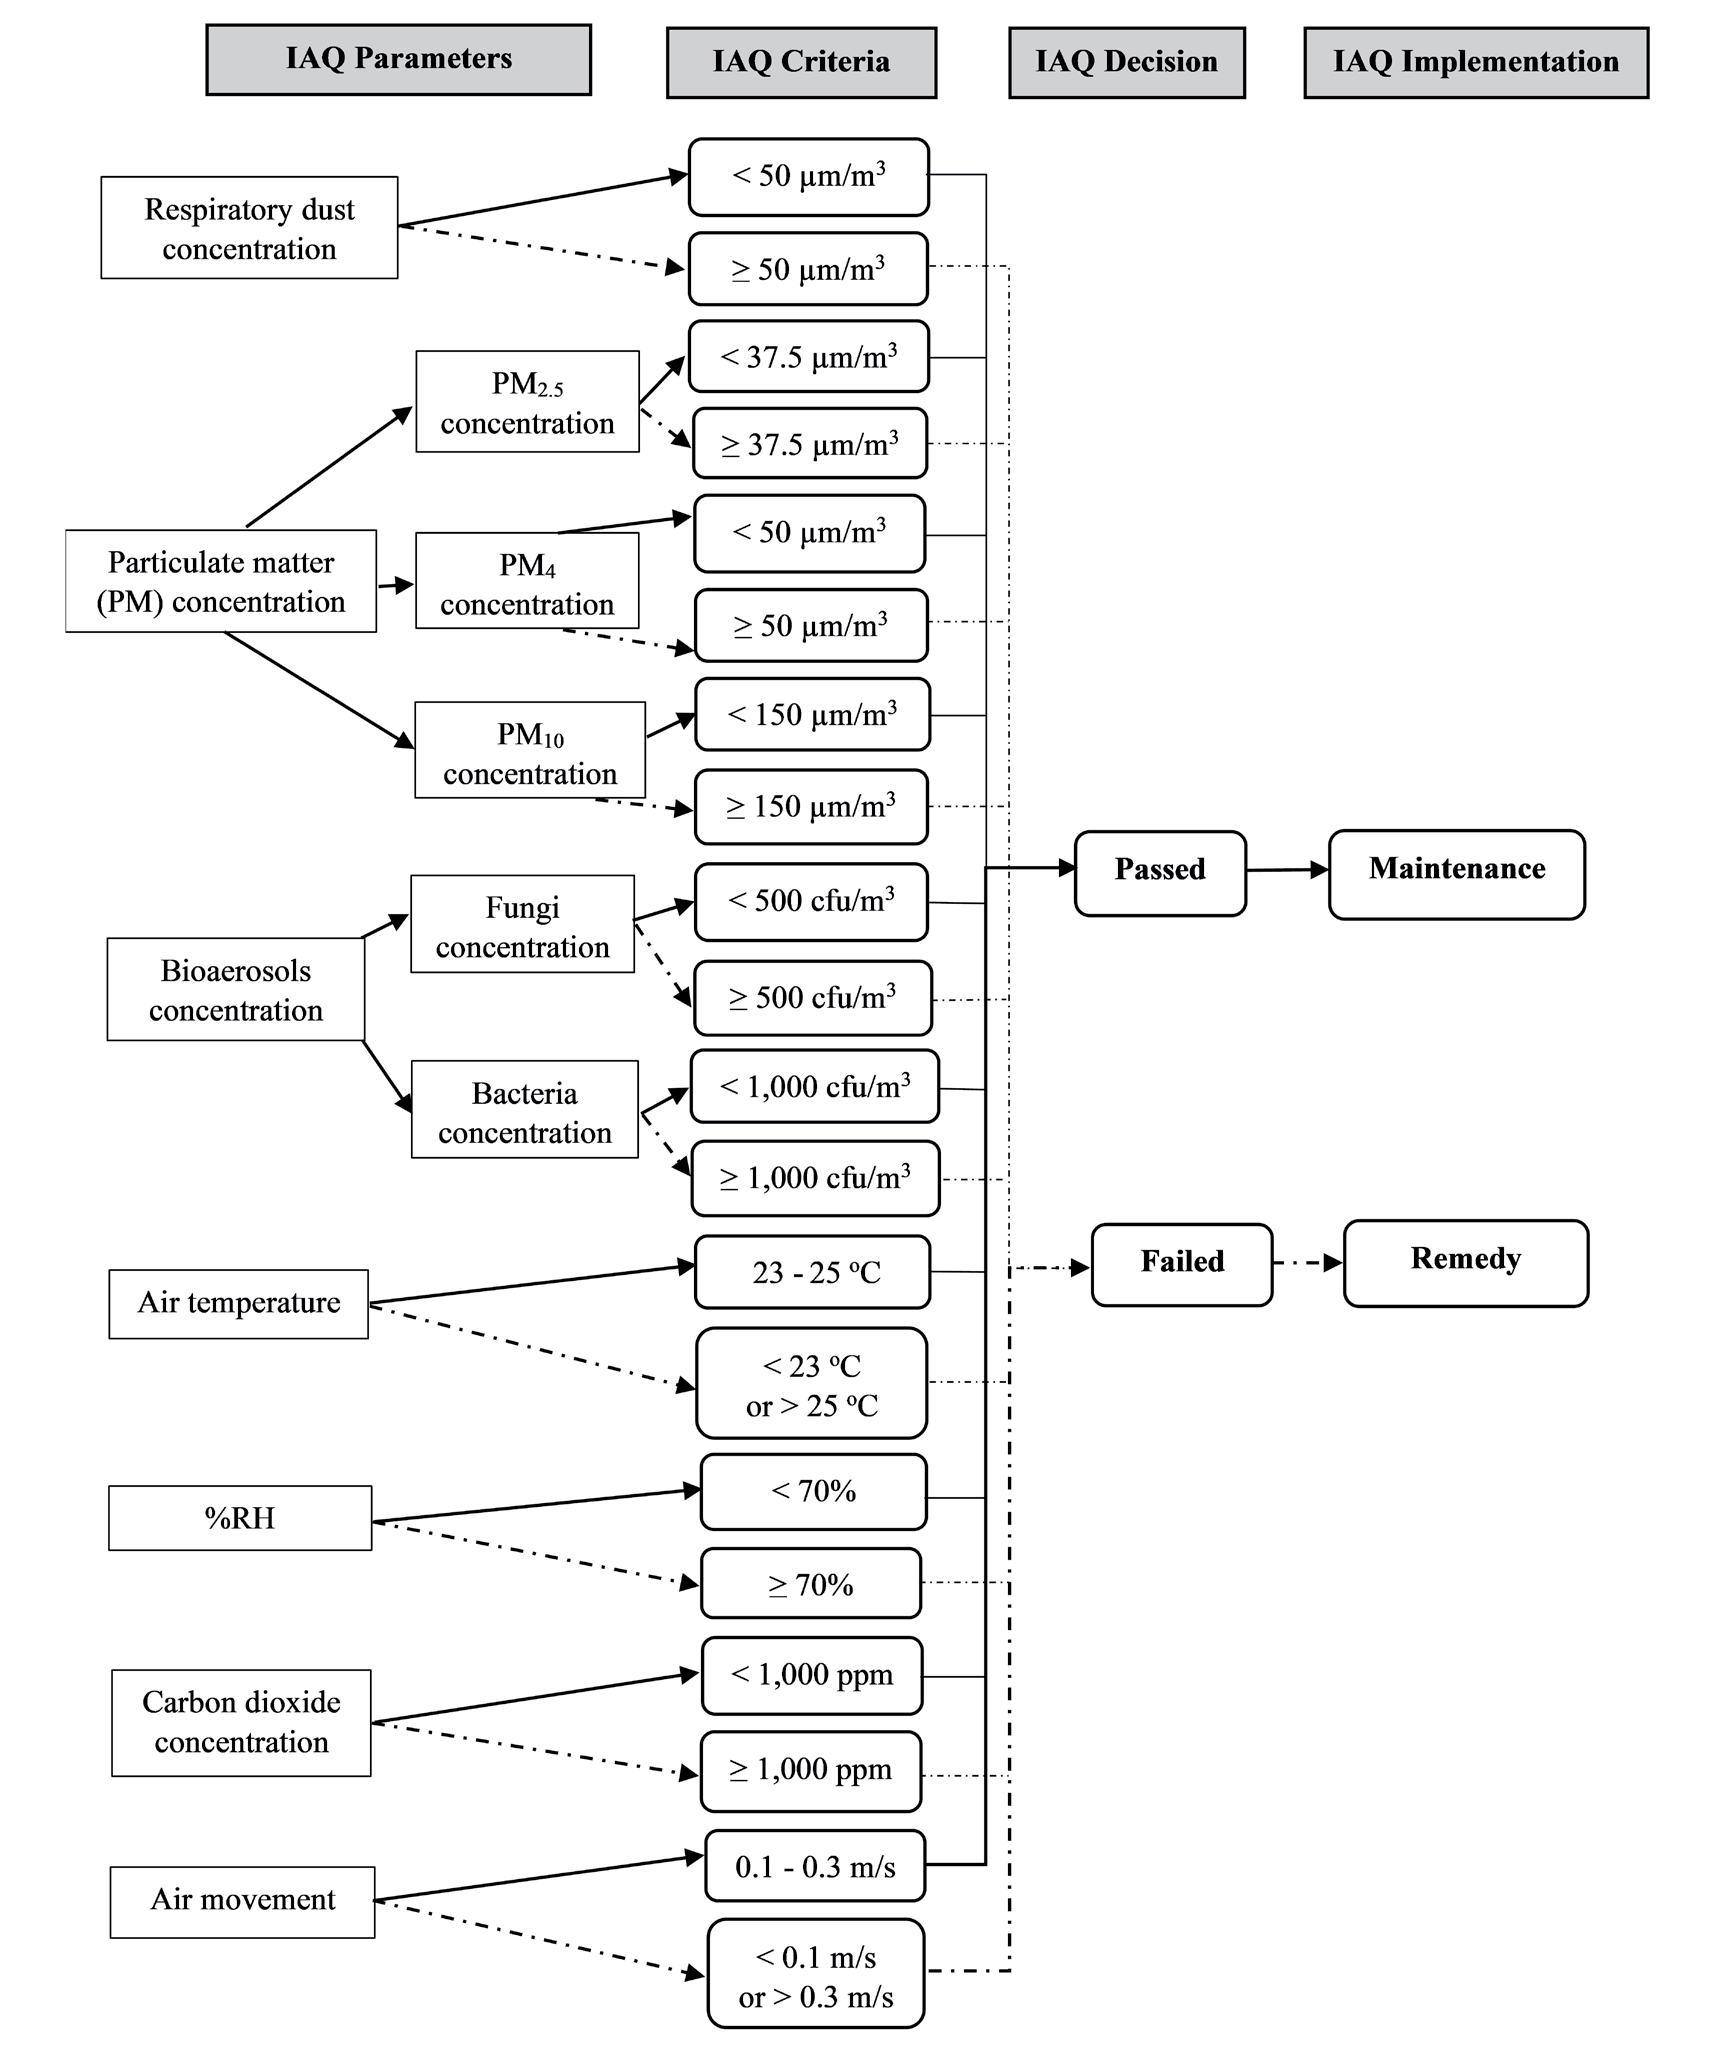
In addition, the results of this study imply that assessing and improving IAQ in libraries are critical concerns that require more examination by stakeholders. They could also be useful sources of reference for policymakers, professionals, and practitioners to quantify the IAQ issues and make decisions on how to solve them and achieve good IAQ. Fig. 4 showed a decision tree for indoor pollutant management in the library based on parameters and their standards used in this study. Improved IAQ can benefit not only health but also economic sectors. The advantages include increased work productivity, such as work speed and quality, decreased absenteeism, and lower healthcare expenditures [43]. Therefore, the intervention for IAQ improvement should be developed and tested in the library for further studies.
Limitation and Further Study
In this study, only respirable dust, PM2.5, PM4, PM10, CO2, bacteria, fungi, air temperature, %RH, and air movement were investigated. Other indoor contaminants such as formaldehyde and VOCs should be included in a more extensive investigation. The measurements of a long-term and wide range are crucial. To evaluate the indoor-outdoor interactions during natural and artificial ventilation of the building, measurements should be conducted both in and outside the library room. The health effects of indoor pollutants, especially formaldehyde and VOC, should be studied.
Conclusions
This article presents the onsite investigation of IAQ in a university of Thailand. Respirable dust, PM2.5, PM4, PM10, bioaerosols, CO2, air temperature, %RH, and air movement were measured. Main findings revealed that indoor air pollutants and comfort parameters with various concentrations were detected in different library zones depending on the activity, utility, number of occupants, type of air conditioner, and potential sources of indoor pollutants in each zone. The mean of CO2 and fungal concentration exceeded the limit value at CZ (1,193 ppm) and PZ (880 cfu/m3), respectively. Although the mean of PM2.5 and PM4 in PZ met the standard, the real-time data showed that they exceeded the limit value for 2-3 hours in the afternoon. The air movement in all zones is quite low. The real-time data revealed significant strong correlations between the different PM sizes, a moderate correlation between %RH and temperature, and CO2 and PM. To enhance IAQ, the PZ and CZ require appropriate enhancement techniques. The PZ should undergo regular cleaning procedures and maintenance of air conditioning systems to achieve good IAQ. To reduce CO2 concentration in the CZ, increase the supply air by mechanical ventilation or include CO2 monitoring technology into the area, so that the automated system manages the delivery of fresh air when CO2 levels surpass the threshold.

