

Introduction
In early 2020, the United Nations declared Coronavirus disease 2019 (COVID-19) to be the greatest challenge facing mankind since World War II due to the significant number of confirmed cases and deaths [1]. In response to the outbreak, Chinese regions and cities implemented policies and sanitary regulations that locked down administrative boundaries and restricted city-level commuting. This major public health event significantly impacted the city’s economy, public mood, and daily life, leading to social isolation to prevent COVID infection and dissemination, resulting in a “desperate plea” [2].
Social media has emerged as the primary platform for timely information exchange and fostering connectedness, serving as a vital conduit for social support and facilitating the dissemination of information, the expression of emotions and the exchange of opinions [3]. As a result, it has been recognized as a valuable tool for examining the interplay between emergency response and building resilience [4]. Open-access geographic information data released by users in large quantities can be analyzed to obtain public attitudes and implement intervention measures during epidemics [5]. Spatio-temporal information about the public’s response to the COVID-19 epidemic, gathered from social media, can better guide disaster preparedness, mitigation, and urban recovery, enhancing and improving community resilience. Although the literature on community resilience often explores social media use as a component of crisis management, scholars have yet to thoroughly examine its impact on perceived community resilience [6]. Furthermore, limited research has examined the impact of individual community members’ social media behavior on the dynamic process of collective adaptation during a shared crisis.
While previous research has highlighted the importance of social media data in comprehending the impact of epidemics on community resilience, there is a current deficiency of an encompassing framework that considers both spatial and temporal differences in the public’s reaction and correlation with urban factors during outbreaks. This research seeks to examine the viability of leveraging social media data to enhance community resilience, particularly in times of a worldwide health emergency such as the COVID-19 pandemic. Taking the city of Harbin as the case study, the study concludes with a series of practical recommendations and suggests potential avenues for future research.
Perspectives of Community Resilience in the Face of the COVID-19 Pandemic
Since the beginning of 2020, the COVID-19 pandemic has posed a significant threat to the health and well-being of cities and citizens worldwide, resulting in “alarming levels of spread and severity” [7, 8]. This global disaster has had a widespread negative impact on human life, society, the economy, and international political relations, attracting the attention of scholars worldwide who are interested in studying the resilience of cities and communities in recovering from its effects [9, 10]. Community resilience, defined as the ability to resist, absorb, adapt, and recover from hazards while maintaining functioning, has practical value in coping with uncertainty and disasters at the community level [11]. It combines individual-level coping and preparedness with a community’s social support system to withstand and recover from public health emergencies [12].
Facing COVID-19 outbreaks, public health researchers have reached a consensus that community resilience is an essential factor in mitigating the physical and emotional tolls on individuals and communities [6]. Studies on the pandemic have shown that strong neighborhood governance, civic participation, institutional trust, and compliance with government advice can influence how the epidemic unfolds in communities [13]. At the initial stage of the epidemic in China, citizens in quarantined areas, such as Wuhan and Shanghai, were engaged through questionnaires and in-depth interviews to examine the influence of pandemic strategies on community resilience [14]. A quantitative study was proposed to evaluate the perceived community resilience based on the first lockdown in Eilat, Israel from April 16 to May 4, 2020. Psychometric questionnaires were used to measure its impact on out-migration [15].
Perceived Community Resilience and the Role of Social Media in Post-Pandemic Management
Perceived community resilience reflects the public’s confidence in a community’s ability to withstand and recover from disasters [16, 17]. Perceived community resilience can be evaluated based on social capital, psychological cohesiveness, belief in leadership, collective efficacy, place attachment, and social trust among the community [18]. Community identity refers to an individual’s sense of belonging and connection to their community, which can enhance their connection to others through shared experiences, values, and emotions [19]. These factors are crucial in building community resilience during public health crises.
The measurement of community resilience remains a topic of ongoing debate, with several recognized frameworks such as the TOSE framework and the CDRF. Building on these two frameworks, Shi et al. constructed a four-dimensional community resilience assessment framework, spatial resilience, capital resilience, social resilience and governance resilience [20]. Zhang devised the Spatially Interrupted Time-Series (SITS) framework utilizing a large mobile phone dataset spanning five months during COVID-19. SITS enables evaluation of policy interventions in both temporal and spatial dimensions [21]. In the midst of the COVID-19 pandemic, engaging in community information support, social support seeking, information seeking and information avoidance through social media platforms serves as a valuable resource for individuals to foster connections within their community and effectively manage the challenges associated with social distancing and isolation caused by the pandemic [22]. Previous studies have demonstrated that coping strategies emphasizing problem-solving, such as engaging in actions to support fellow community members, enable individuals to reassess the crisis situation based on their proactive effort [23]. This reassessment, in turn, influences subsequent coping behaviors.
Social media platforms allow for real-time information sharing, emotional expression, and connection during and after crises, providing researchers with valuable data on public reaction [24]. Community identity highlights social media engagement as a coping strategy for building community resilience. Social media use for social support fosters social capital and enhances collective resilience perception [6]. Qiu reviewed over one thousand resilience articles from Web of Science and proposed social media can aid epidemic management, enhance resilience, and aid in pandemic detection, particularly for China and Singapore [25]. By examining social media activity, researchers can gain a more comprehensive understanding of the impact of the pandemic on the social, economic, and physical fabric of urban areas, as well as identify potential solutions for building more resilient communities in the future [26]. Social media platforms also have a strong potential to replace physical spaces damaged by disasters and promote active citizen participation and increase social resilience in the face of emergencies and disasters [27]. The community resilience literature often discusses social media’s role in crisis management, but communication scholars have not extensively theorized or researched its impact on perceived community resilience. There is a lack of research on how individual social media use during a crisis impacts collective adaptation and perceptions of community resilience.
The Introduce of Social Media and GIS for Enhancing Post-Pandemic Community Resilience
In the field of post-pandemic community resilience, various social media platforms, such as Twitter and Facebook, are widely used at a global level [28, 29]. The application of Chinese social media data to promote positive impacts in the recovery process has also received attention in regional studies. Weibo, often regarded as China’s equivalent to Twitter, is one of the largest social media platforms in the country. It serves as a highly efficient channel for rapidly distributing questionnaires among particular ethnic groups, facilitating an in-depth comprehension of their recovery processes [30]. The extraction of information from the hot-search topic list of Weibo has been used to measure public concern about public health emergencies [31]. Emotional expression is evaluated to characterize the psychological dimension of collective resilience by analyzing Weibo texts, examining the temporal evolution of public opinions on COVID-19 during China’s first anti-pandemic cycle [32].
The integration of social media data with Geographic Information Systems (GIS) provides a powerful approach for enhancing post-pandemic community resilience studies. GIS technology facilitates the visualization, analysis, and interpretation of spatial data, while social media data provides valuable insights into the public’s experiences and reactions during and after a crisis [33]. Researchers utilize social media data to study the public’s experiences and reactions during and after a pandemic, and integrate it with GIS technology to map spatial and temporal patterns of public behaviors and emotions [34, 35]. Together, these tools can provide valuable insights into post-pandemic community resilience and inform the development of targeted interventions and policies to build more resilient communities in the future [36, 37].
Emotional Responses and Sentiment Analysis to Understand the Implications for Community Resilience
Sentiment analysis is a powerful tool for understanding individual and community intentions during disasters and for comprehending the emotional state of individuals [38]. Sentiment analysis uses natural language processing and machine learning algorithms to analyze the sentiment of social media posts. By applying sentiment analysis to geotagged social media data, researchers can generate a spatially explicit representation of the public’s emotions and reactions to the pandemic [39]. Studies have also revealed that the emotional valence displayed on government social media can promote citizen engagement and self-resilience during epidemic crises [40]. Emotional value assessment can provide valuable insights into the factors that influence post-pandemic community resilience, as well as help identify areas where targeted interventions and policies may be required [41].
A wide range of emotional responses, stemming from an individual’s perception and assessment of the “person-environment” relationship, can influence the actions individuals take in response to a crisis. A dimensional framework for understanding emotions suggests that emotions can be classified based on two evaluative valence dimensions: positive and negative emotions. Negative emotions have been found to be positively linked to active information seeking and processing, yet negatively associated with trust in an organization during a crisis [42]. Conversely, the role of positive emotions in the context of a crisis is less well-explored. Some existing studies indicate that positive emotions can co-occur with negative emotions during a crisis, and these positive emotions can play a significant role in mitigating the adverse effects of the crisis [43]. While previous research has examined emotional responses to crises in various contexts, such as flooding, hurricanes, and influenza, and in relation to constructs like trust, information processing, and perceived responsibility, there has been relatively less investigation into the connection between emotions and perceived community resilience [44].
Material and Methods
The city of Harbin, located in the northeast region of China, is selected as the primary case study for this research. In order to obtain social media data pertaining to the study, a cross-search approach is employed, utilizing a series of epidemic-related keywords aided by web crawler tools to access the Weibo API. The social media data collected includes users’ information, geolocation data, post time, and post content. Furthermore, an innovative assessment framework is constructed by combining the social media data with traditional data sources, such as land use data, to evaluate the urban resilience of Harbin. The structure of assessment comprises four dimensions: User Information, Spatial Distribution, Temporal Dynamics, and Intercorrelation Statistical Analysis. This comprehensive framework blends spatial information with temporal patterns to accurately detect and display people’s responses to adverse public events over time. Additionally, the framework uses the Pearson Correlation Coefficient to explore the relationships between variables, assisting in identifying the crucial factors that affect urban resilience in Harbin.
Research Area Selection: The City of Harbin
Harbin, situated in the northeastern region of China, holds the distinction of being the city with the largest land jurisdiction – 53,186 square kilometers – among all the provinces and municipalities in China [45]. The city experiences severely cold and relatively extreme climatic conditions, with temperatures plummeting to around minus 40 degrees Celsius during the winter season. Despite the harsh climate, Harbin boasts a unique and westernized urban landscape, featuring the Chinese Baroque district, which is a result of its rich developmental history and frequent trading activities. In the 1920s, Harbin became a booming city due to its status as the Russian administrative center of the railway. The Russian colonial rule brought European architecture to the city, resulting in the creation of the Chinese Baroque architectural style, which is a fusion of Baroque façade and Chinese traditional quadrangle. Even today, Harbin, particularly its Daowai District, features a plethora of Chinese Baroque buildings. In recent years, the district has undergone an urban development project driven by the preservation of its heritage. Additionally, Harbin is home to over 50 colleges, universities, and research institutes, including the prestigious HIT, resulting in a young and diverse community.
The study focuses on the main urban area of Harbin, which comprises seven built-up urban administrative districts [46], covering 598 square kilometers of land. The selected area has a population of 5.265 million, representing 53.26% of the total population of Harbin, and is the primary focus of the research [47].
Data Collection and Purification
The research conducted in this study employs limitations in both temporal and spatial dimensions for data acquisition. The time range considered for data acquisition is from January 25, 2020, to May 22, 2022, covering the initial outbreak stage of the new crown epidemic in 2020 to the first half of 2022, when the epidemic situation in Harbin became stable. The geographical scope of data acquisition is restricted to the main urban area of Harbin.
To begin the data acquisition process, a search string is constructed. First, a preliminary keyword library is generated by manual reading and sorting to create a search string consisting of multiple keywords, including “Harbin,” “mask,” “resumption of work,” “isolation,” “positive,” and “epidemic,” to access the Weibo API. This step resulted in the acquisition of 32,315 posts containing relevant information, such as posting time, text content, geographical data, and user profile information, including gender, registered IP, and current IP.
Data purification comprises two steps. Firstly, a computing approach is utilized to identify and remove completely duplicated posts, resulting in 11,559 posts being eliminated. Secondly, irrelevant Weibo posts are screened out through manual reading and marking based on criteria, such as meeting the selected geographical scope, restricted time frame, and content relevance. For instance, any post specifically mentioning other cities will be deemed outside our geographical focus, despite their association with a geo-location or hashtag linked to Harbin. Furthermore, we have excluded articles discussing topics from previous years that were published during the COVID era. Posts that are unrelated, such as those criticizing traffic accidents, have also misused the hashtag “covid in Harbin” to gain more visibility and have consequently been removed. As a result, 13,453 Weibo posts were identified as valid data (Table 1).
Table 1.
Screening process of obtained Weibo data.
Table 2.
Examples of original tweets along with their corresponding classified results
Data Analysis
The present study investigates data obtained from four distinct perspectives: user information, spatial distribution, temporal dynamics, and variables impacting urban resilience. Firstly, user information is scrutinized, including gender ratio and whether the user is local, to establish user profiles for relevant groups. Secondly, geolocation data is analyzed. Following correction of the latitude and longitude information, it is combined with Harbin urban planning geographic information data. The point density analysis method is employed within the GIS to analyze the spatial distribution evolution characteristics of epidemic-related microblogs in Harbin. Subsequently, the study combines the timing of Weibo releases with that of local epidemic prevention and control policies at different stages and examines the response of Harbin’s community resilience to the epidemic at different times. Finally, by means of statistical correlation analysis, specific variables that impact community resilience are explored.
User Information Statistics
This study examines user information, specifically gender and local residency status. The study calculated the number and proportion of male/female and local/ non-local users and drew the response of different groups to the epidemic from the user portraits of relevant groups, ultimately identifying the impact of the epidemic on urban resilience. As the IP obtained by Weibo is divided into the posting IP (the location of Weibo is automatically displayed to be accurate to the province) and the user IP (set by the user to be accurate to the city), the study comprehensively considered both IP indicators when judging the IP and then determined whether the post belonged to a local or non-local resident.
Spatial Distribution of People’s Sentiment
In this study, a novel approach was utilized to explore public attitudes towards the pandemic by combining social media data, land use data, and other information. The social media data was processed and visualized using ArcGIS to investigate the spatial distribution of user sentiment. Land use information was obtained from the “Harbin Master Plan (2011-2020) revised version in 2017” at a scale of 1:2000. Specifically, the textual content collected from Weibo was semantically determined and combined with geographic location data to create a spatial pattern of sentiment.
In this study, a novel approach was utilized to explore public attitudes towards the pandemic by combining social media data, land use data, and other information. The social media data was processed and visualized using ArcGIS to investigate the spatial distribution of user sentiment. Land use information was obtained from the “Harbin Master Plan (2011-2020) revised version in 2017” at a scale of 1:2000. Specifically, the textual content collected from Weibo was semantically determined and combined with geographic location data to create a spatial pattern of sentiment.
Sentiment analysis was used to examine people’s mood by assigning sentiment scores or levels based on the text content. A classification-based method was employed that manually labeled tweets as negative, neutral, or positive, and then used supervised classification to classify instances [48]. Table 2 provides examples of original tweets along with their corresponding classified results. This addition will enable readers to better understand and evaluate the accuracy of our classification process. By presenting concrete examples, we aim to provide a clearer picture of how the subjective interpretation was applied and showcase the reliability of our approach. It should be noted that manual recognition of text content was employed in this study, as opposed to the use of machine learning tools for semantic recognition. This was mainly due to the limited amount of data available for training machine learning algorithms, which was around ten thousand. Future research and practical applications should aim to employ artificial intelligence tools, such as natural language processing, to recognize larger amounts of textual content.
Table 3.
Descriptive statistics of the variables based on Weibo data.
Table 4.
Correlation analysis results between attitudes and various variables in relation to COVID-19.
Following the correction of the latitude and longitude coordinates of the microblogs gathered in the initial stage and their importation into Geographic Information System (GIS) to ensure congruence with the city data, this research established the microblogs’ location within the main urban area. Of the 13,453 data examined, none were deemed invalid, and N.A. was used to denote instances where location data was unavailable due to users not enabling the positioning system. Similarly, invalid default geolocations represented instances where the default location point was displayed due to the user not turning on the positioning system when posting a tweet.
We used the spatial analysis tool, specifically the kernel density detection tool in ArcGIS 10.8.2, to estimate the kernel density of Weibo posts within Harbin city. To capture the spatial distribution patterns and features of the pre-filtered Weibo posts, a fixed search radius (bandwidth) of 0.01 degrees and a cell size of 0.001 degrees were utilized. The concentration of feature points within each output area image was then calculated using kernel density analysis. The resulting plot shows a smooth vertical line for each location, illustrating the density of Weibo posts. The use of kernel density estimation is crucial for accurately estimating probability distributions and allows for a more comprehensive examination of the probabilistic model under investigation, overcoming the limitations of traditional bitmap techniques.
Temporal Dynamics of Posting Activities
The present study initially delimited the time frame for collecting relevant Weibo data from January 25, 2020, which marked the closure of all public places in Harbin due to the pandemic, until May 22, 2022, when the epidemic situation in Harbin stabilized, and no new local cases were reported. This time frame spans the entire period of in-creasing cases, from the issuance of the No. 2 Announcement on Epidemic Prevention and Control by the Harbin Municipal Government to the issuance of the No. 66 Announcement on Epidemic Prevention and Control. Based on the changing epidemic situation and policies in Harbin, we divide the whole period into seventeen phases (see Appendix A). This study further classifies the prevention and control policies at each stage of the epidemic based on the level of strictness as outlined in the policies. Table 3 presents the number and proportion of blog posts in each period, corresponding with policy tendency level.
Variables Affecting Community Resilience
The data analysis in this study utilized statistical analysis approaches, where Table 3 displays six independent variables and one dependent variable. In terms of sentiment assignments (V0), the correspondence with attitudes followed a low-to-high order, with negative sentiments assigned 1, neutral assigned 2, and positive sentiments assigned 3. For the independent variables with binary options such as gender, local residence, and IP location in the main urban area, the research assigned 1 to male users and 2 to female users, 1 to local users, and 2 to non-local users, and 1 to main urban area and 2 to non-main urban areas. The nature of land use was divided into seven sub-categories, with values of 1 to educational land (Institute and college), 2 to residential land, 3 to commercial entertainment, 4 to tourist attractions, 5 to public facilities, 6 to green spaces, and 7 to other categories. Additionally, the level of policy strictness was classified into four categories, ranging from low to high strictness. Missing data, except for epidemic situations, were assigned a value of 0.
Pearson Correlation Coefficient was employed to investigate the difference between categorical variable X and quantitative variable Y. The analysis involved determining whether there was a significant difference between X and Y (p<0.05 or 0.01), followed by comparing the average value to describe specific differences if the result was significant. Then, Correlation analysis was employed to investigate the correlation between different data information, with the aim of identifying the dependent variable, i.e., the degree to which emotion (V0) is affected by independent variables (V1-V6). The correlation coefficients were used to express the relationship between the analyzed variables. The research first determined whether there was a relationship between the variables when presenting the conclusions.
Fig. 1.
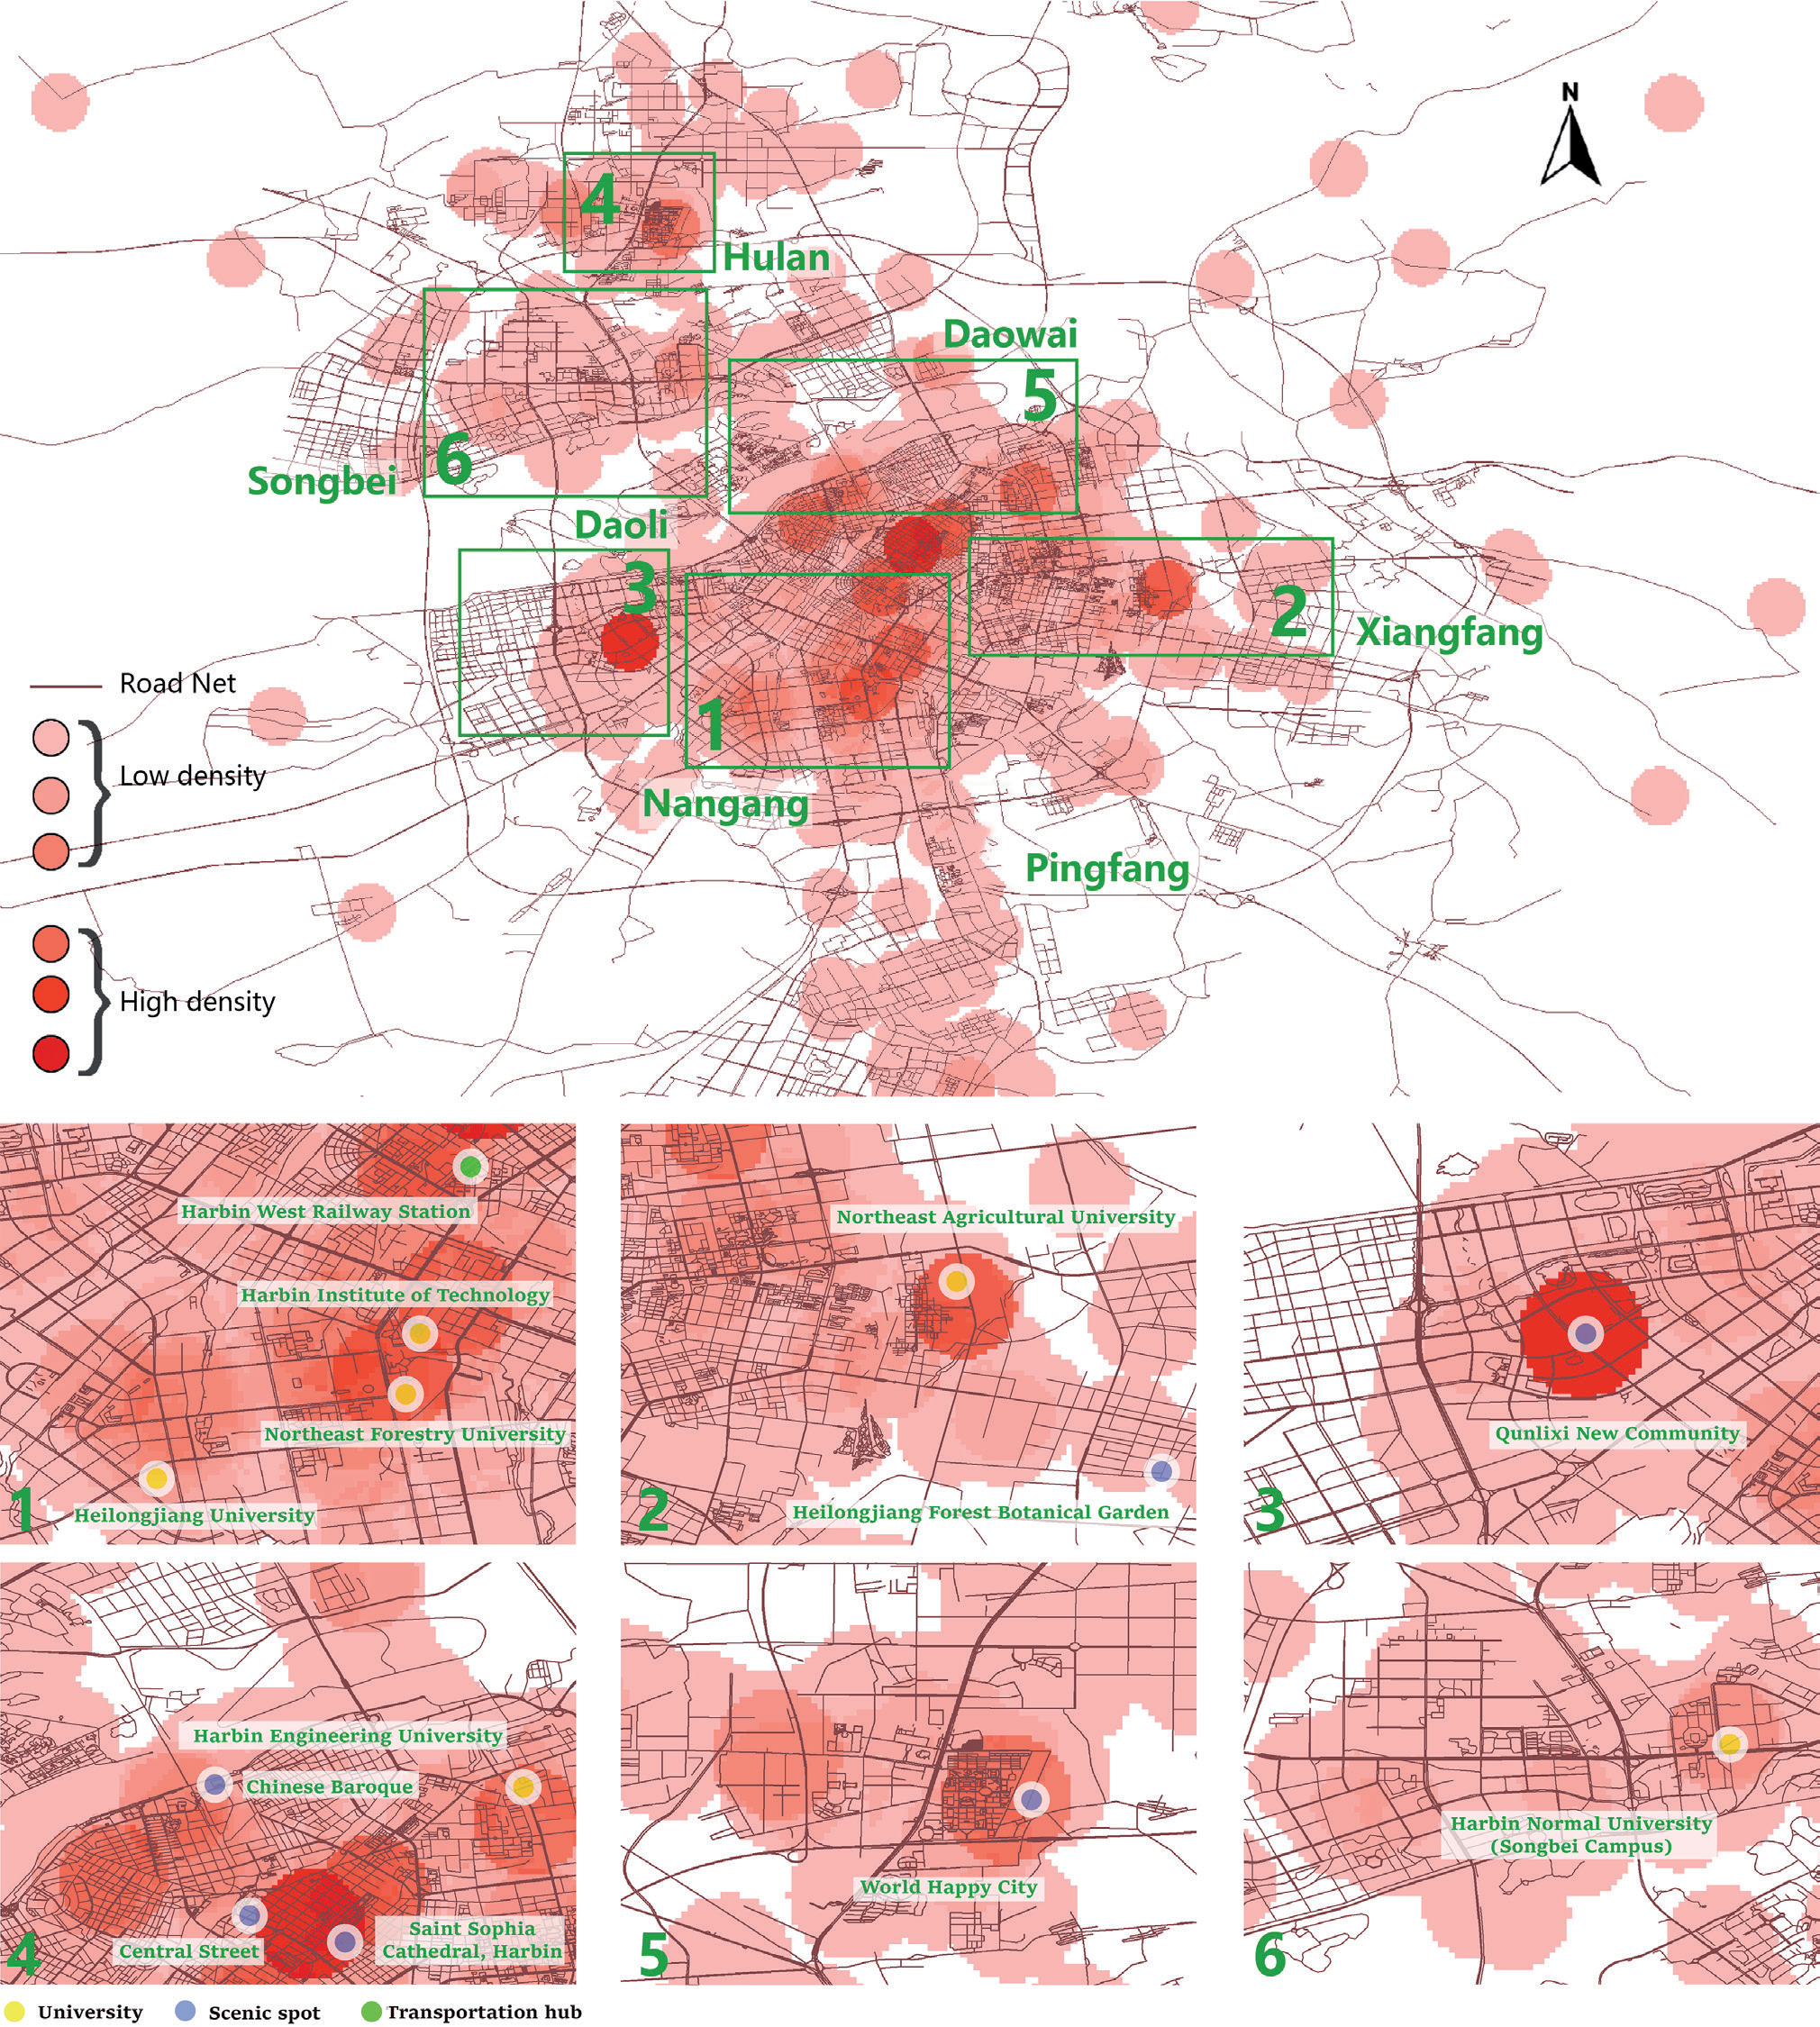
Upper. Density and spatial distribution of public responses on Weibo in Harbin during the COVID-19 (total). Lower. Close-up of the enlarged Harbin urban area. a) Cluster 1, Nangang district; b) Cluster 2, Xiangfang district; c) Cluster 3, Daoli district; f) Cluster 4, Daowai district; e) Cluster 5, Hulan district; f) Cluster 6, Songbei district.
Results and Discussion
User Information Analysis
The analysis of user information provided important insights into the distribution of tweets related to COVID-19 in Harbin city, highlighting the gender and local residential status of users, as well as the spatial patterns of tweet posting locations. The user information included gender and local residence status, which were categorized and presented in Table 3.
Fig. 2.
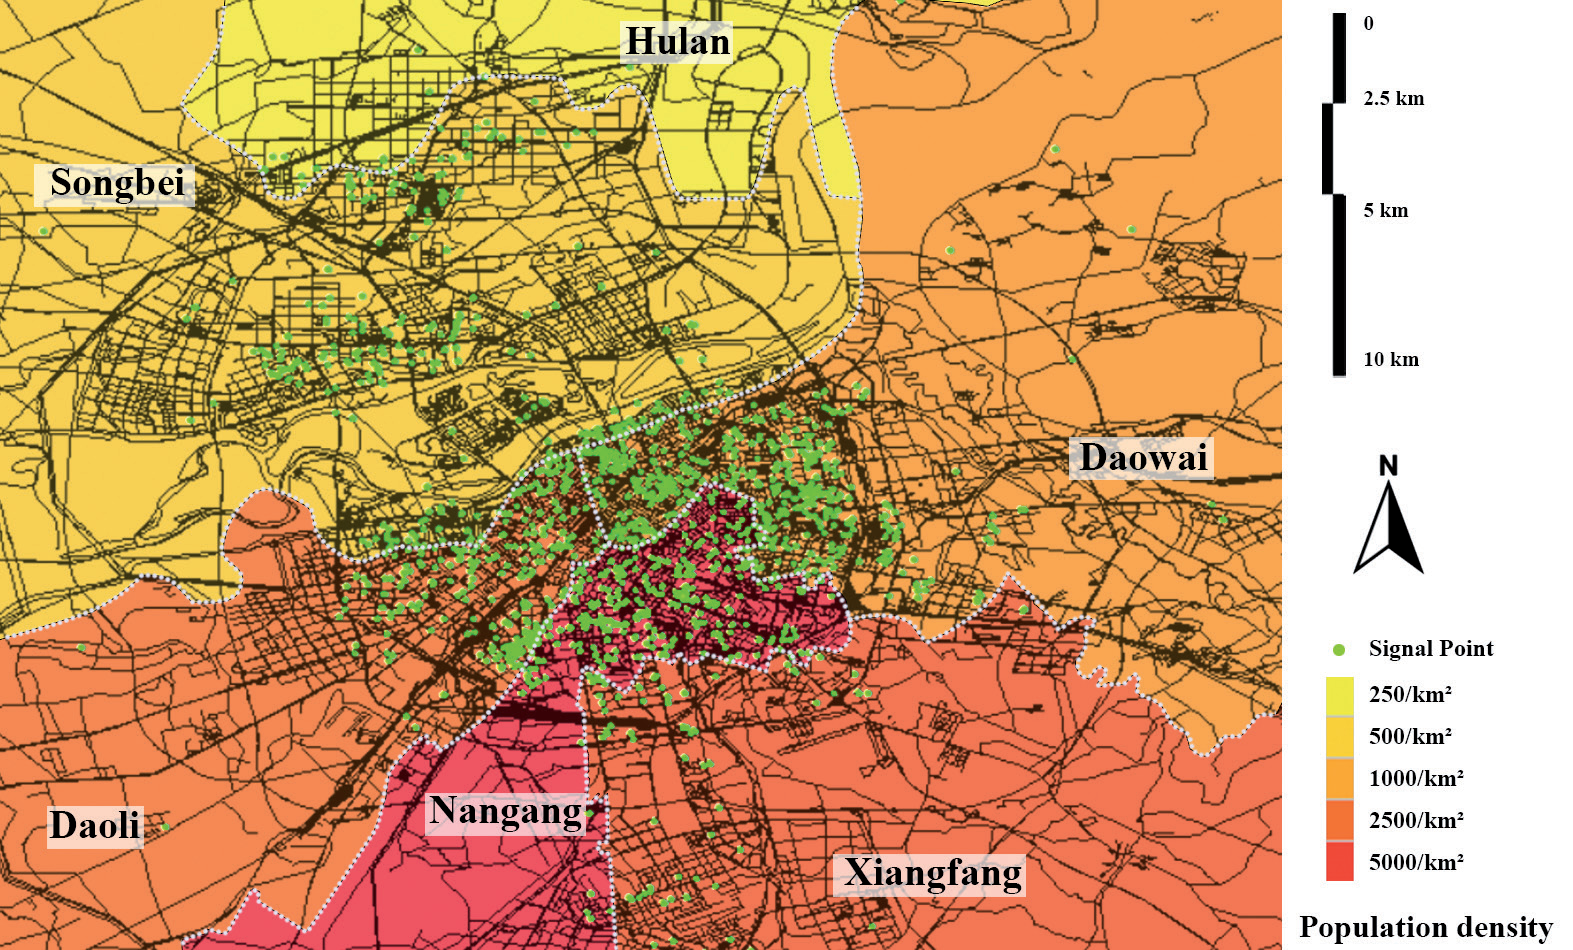
Population density distribution in the Harbin urban area (data source: open street map, accessed on 15 June 2023) overlapping posts’ hotspot map.
The study identified 6342 Weibo users as male, accounting for 47.31% of the total, and 6813 Weibo users as female, accounting for 50.87% of the total (see Table 3). In addition, 244 tweets had missing gender information, representing 1.81% of the total. The study also categorized users who posted valid Weibo data according to their local residence status. Table 3 shows that there were 7,349 local tweets, accounting for 54.63% of the total, and 5,860 non-local tweets, accounting for 43.56% of the total. The study also analyzed the real-time location of the tweets and found that over 95% of the tweets were posted within the Harbin city area. 12,793 tweets were posted in the main urban area, accounting for 95.09% of the total, while only 660 tweets were posted outside the main urban area, accounting for 4.91% of the total. The study also categorized the posting locations according to land use functions, such as institutes and colleges, residential areas, commercial areas, tourist attractions, public facilities, green areas, and others.
Mapping the Spatial Distribution of COVID-19 Related Posts in Harbin City
The present study investigated the distribution of postings across different land use types in a given area. A total of 2512 postings were analyzed, and it was found that the number of postings for education sites was significantly higher than for other land use types, accounting for 18% of the total sample. The second-highest number of postings was found for residential sites (N = 1636), while postings positioned in the urban green space function accounted for only about 1% of the total sample (see Table 3). These findings highlight the importance of education sites as a popular destination for posting on social media, while urban green spaces appear to be less frequently visited and photographed.
The study revealed a clear spatial pattern in the distribution of tweets related to the COVID-19 epidemic in Harbin city. The distribution can be classified into six distinct clusters, each with multiple patterns of distribution and aggregation. The most concentrated hotspots are in and around the Qunlixi residential area (cluster 3) and the historic central city of Harbin (cluster 4), as shown in Fig. 1. The general pattern of Weibo hotspots is broadly consistent with the distribution of population density in the Harbin urban area, as shown in Fig. 2.
Cluster 1 is located in the Nangang district of Harbin, with Harbin Railway Station as its center. The high level of concern expressed on social media platforms about the epidemic is likely to be driven, in the main, by the high density of the population [49]. In addition, a number of university campuses in clusters 1 and 2 are also recognized as the core area with a high density of postings, such as HIT, Northeast Agricultural University. This is strongly related to the relatively younger and denser population of users in universities and research institutes, who are more likely to use online platforms to express their views. In addition, the higher number of activities at home during the pandemic allowed students to participate more actively in online discussions about the epidemic.
Fig. 3.
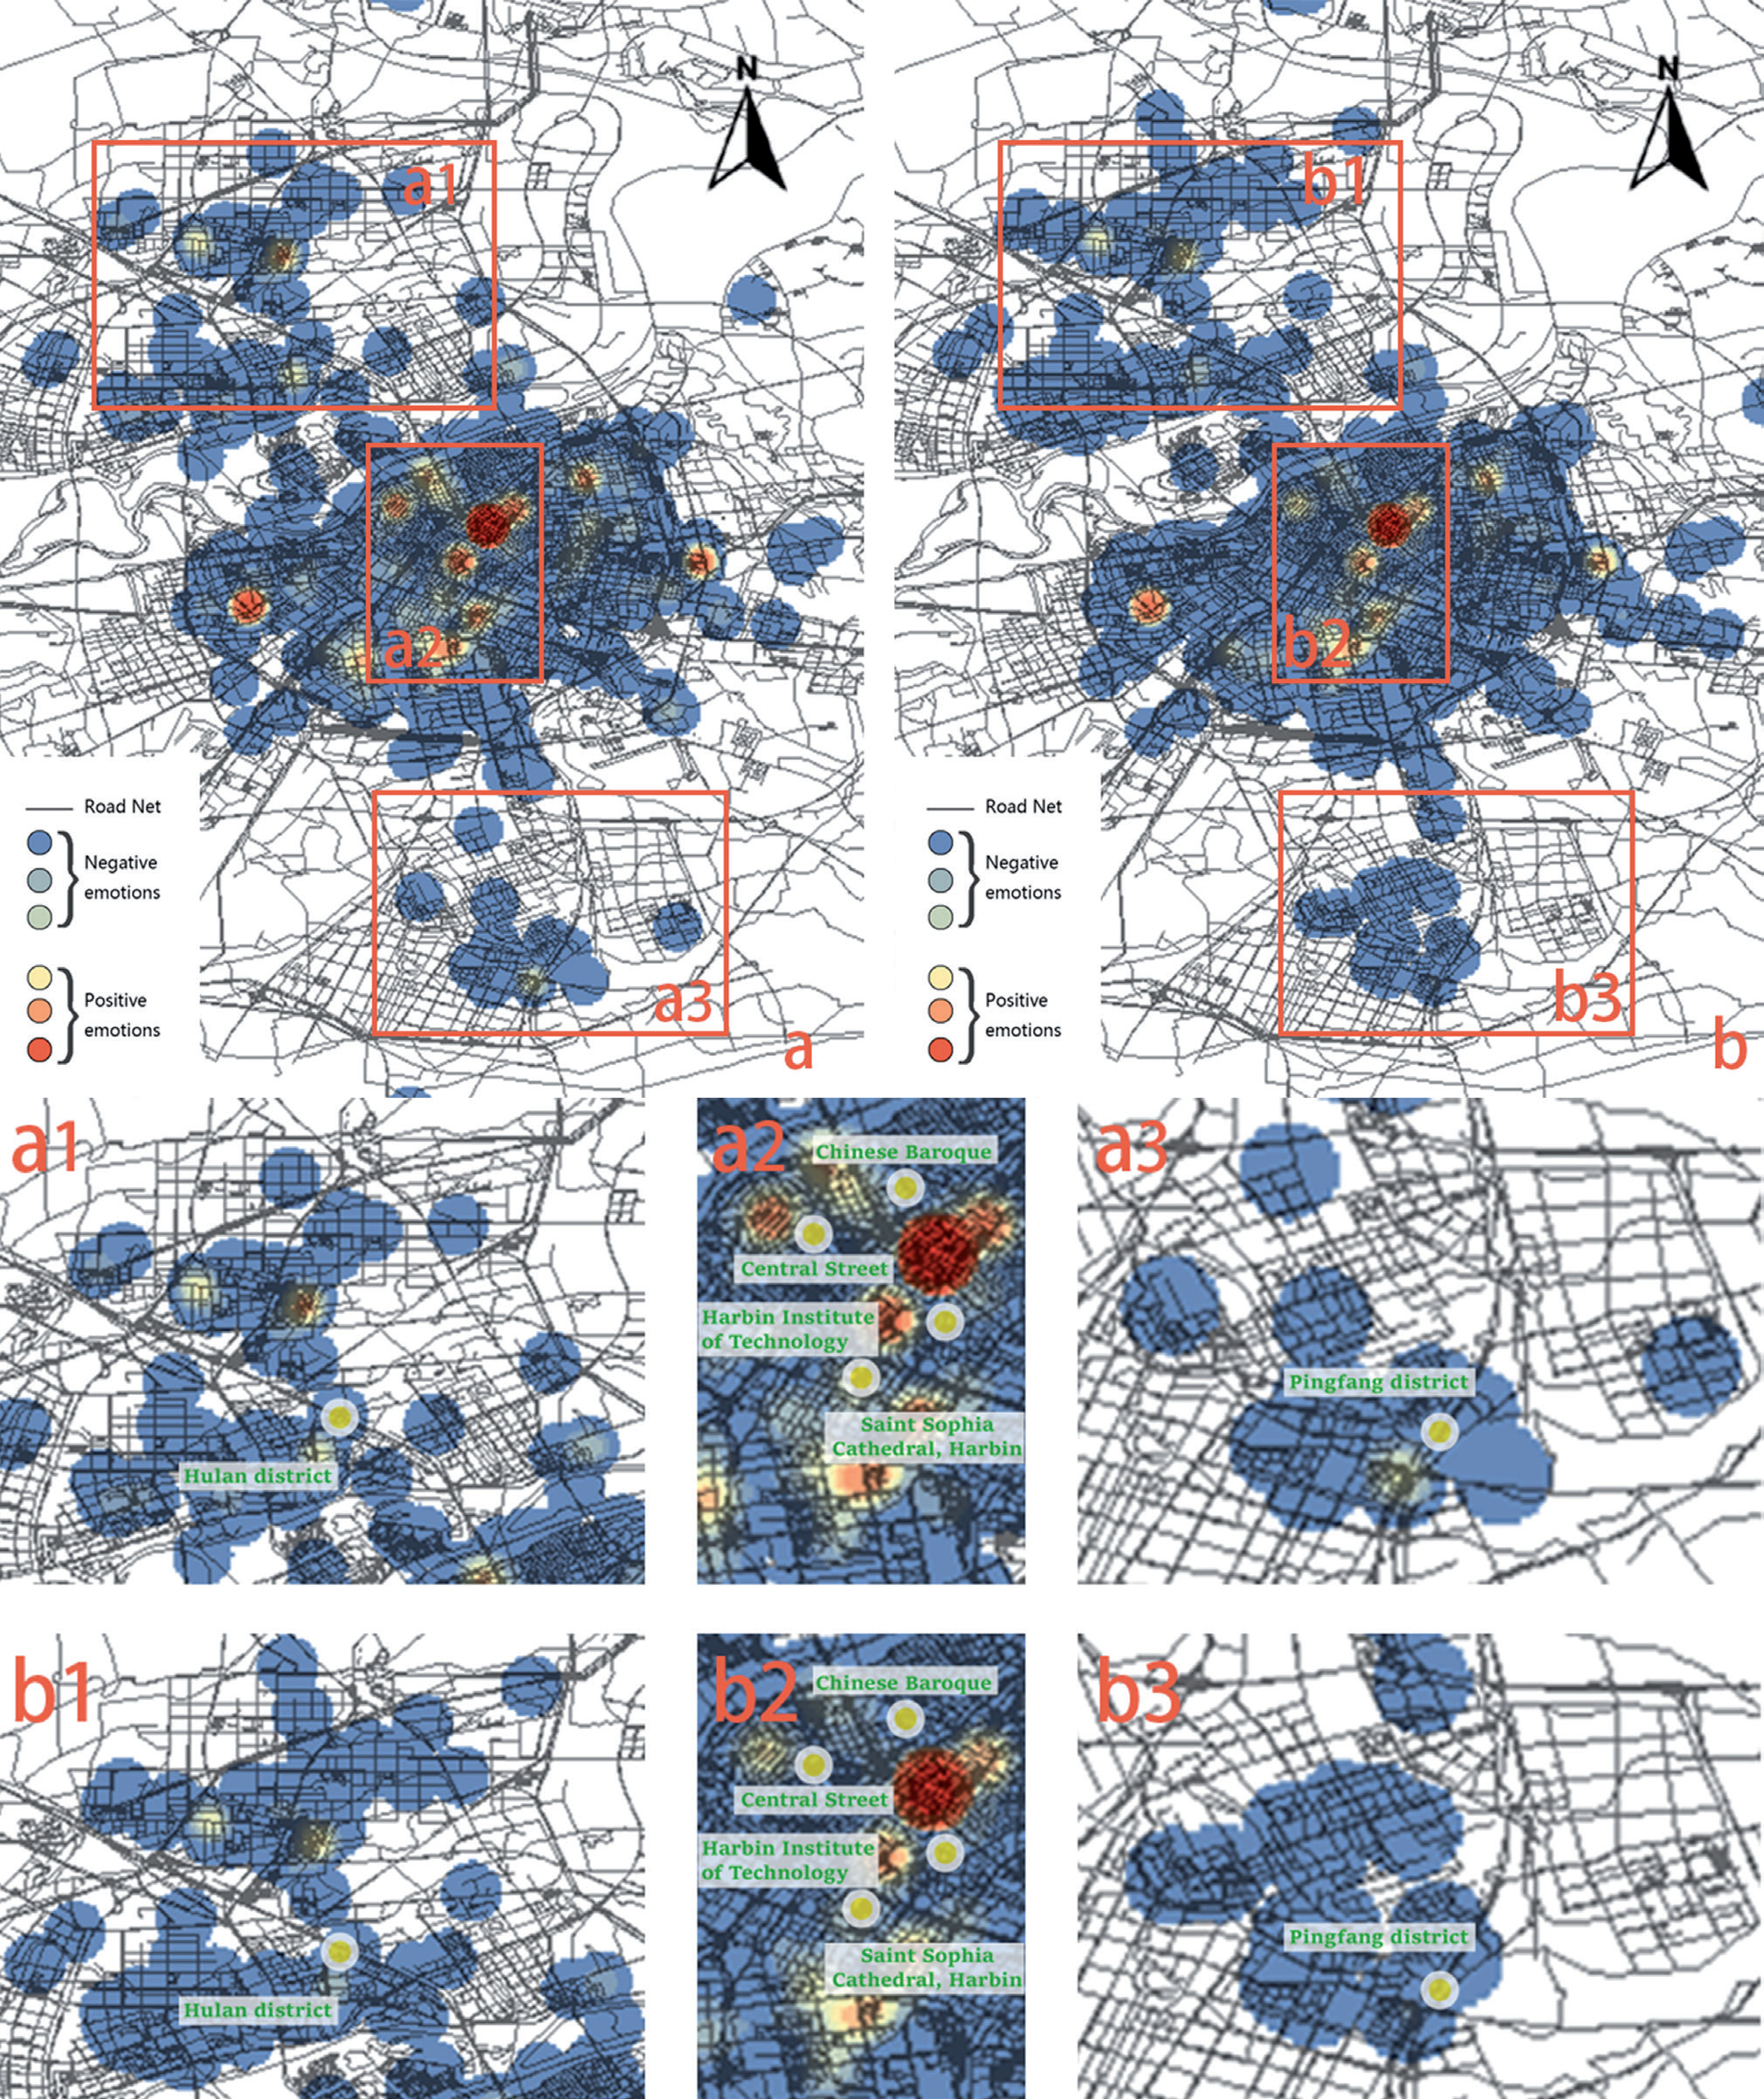
The geographical pattern of public sentiment responses towards the epidemic in Harbin. a) geographical pattern of positive sentiment; b) geographical pattern of negative sentiment; a1, b1) Hulan district; a2, b2) The historic city center; a3, b3) Pingfang District.
Cluster 3, situated in the Daoli district, shows a high concentration of posting users in densely populated super high-rise residential areas, particularly in the Qunlixi residential area. It is evident that after more than a decade of construction, Qunlixi area now boasts a significant number of contemporary, high-end residential and commercial projects that are well established, coupled with a relatively youthful demographic and benefiting from the centralized, top-down urban master planning process implemented by the government. However, this new urban neighborhood is located some distance from the city center, due to the still inadequate public transport system.
Fig. 4.
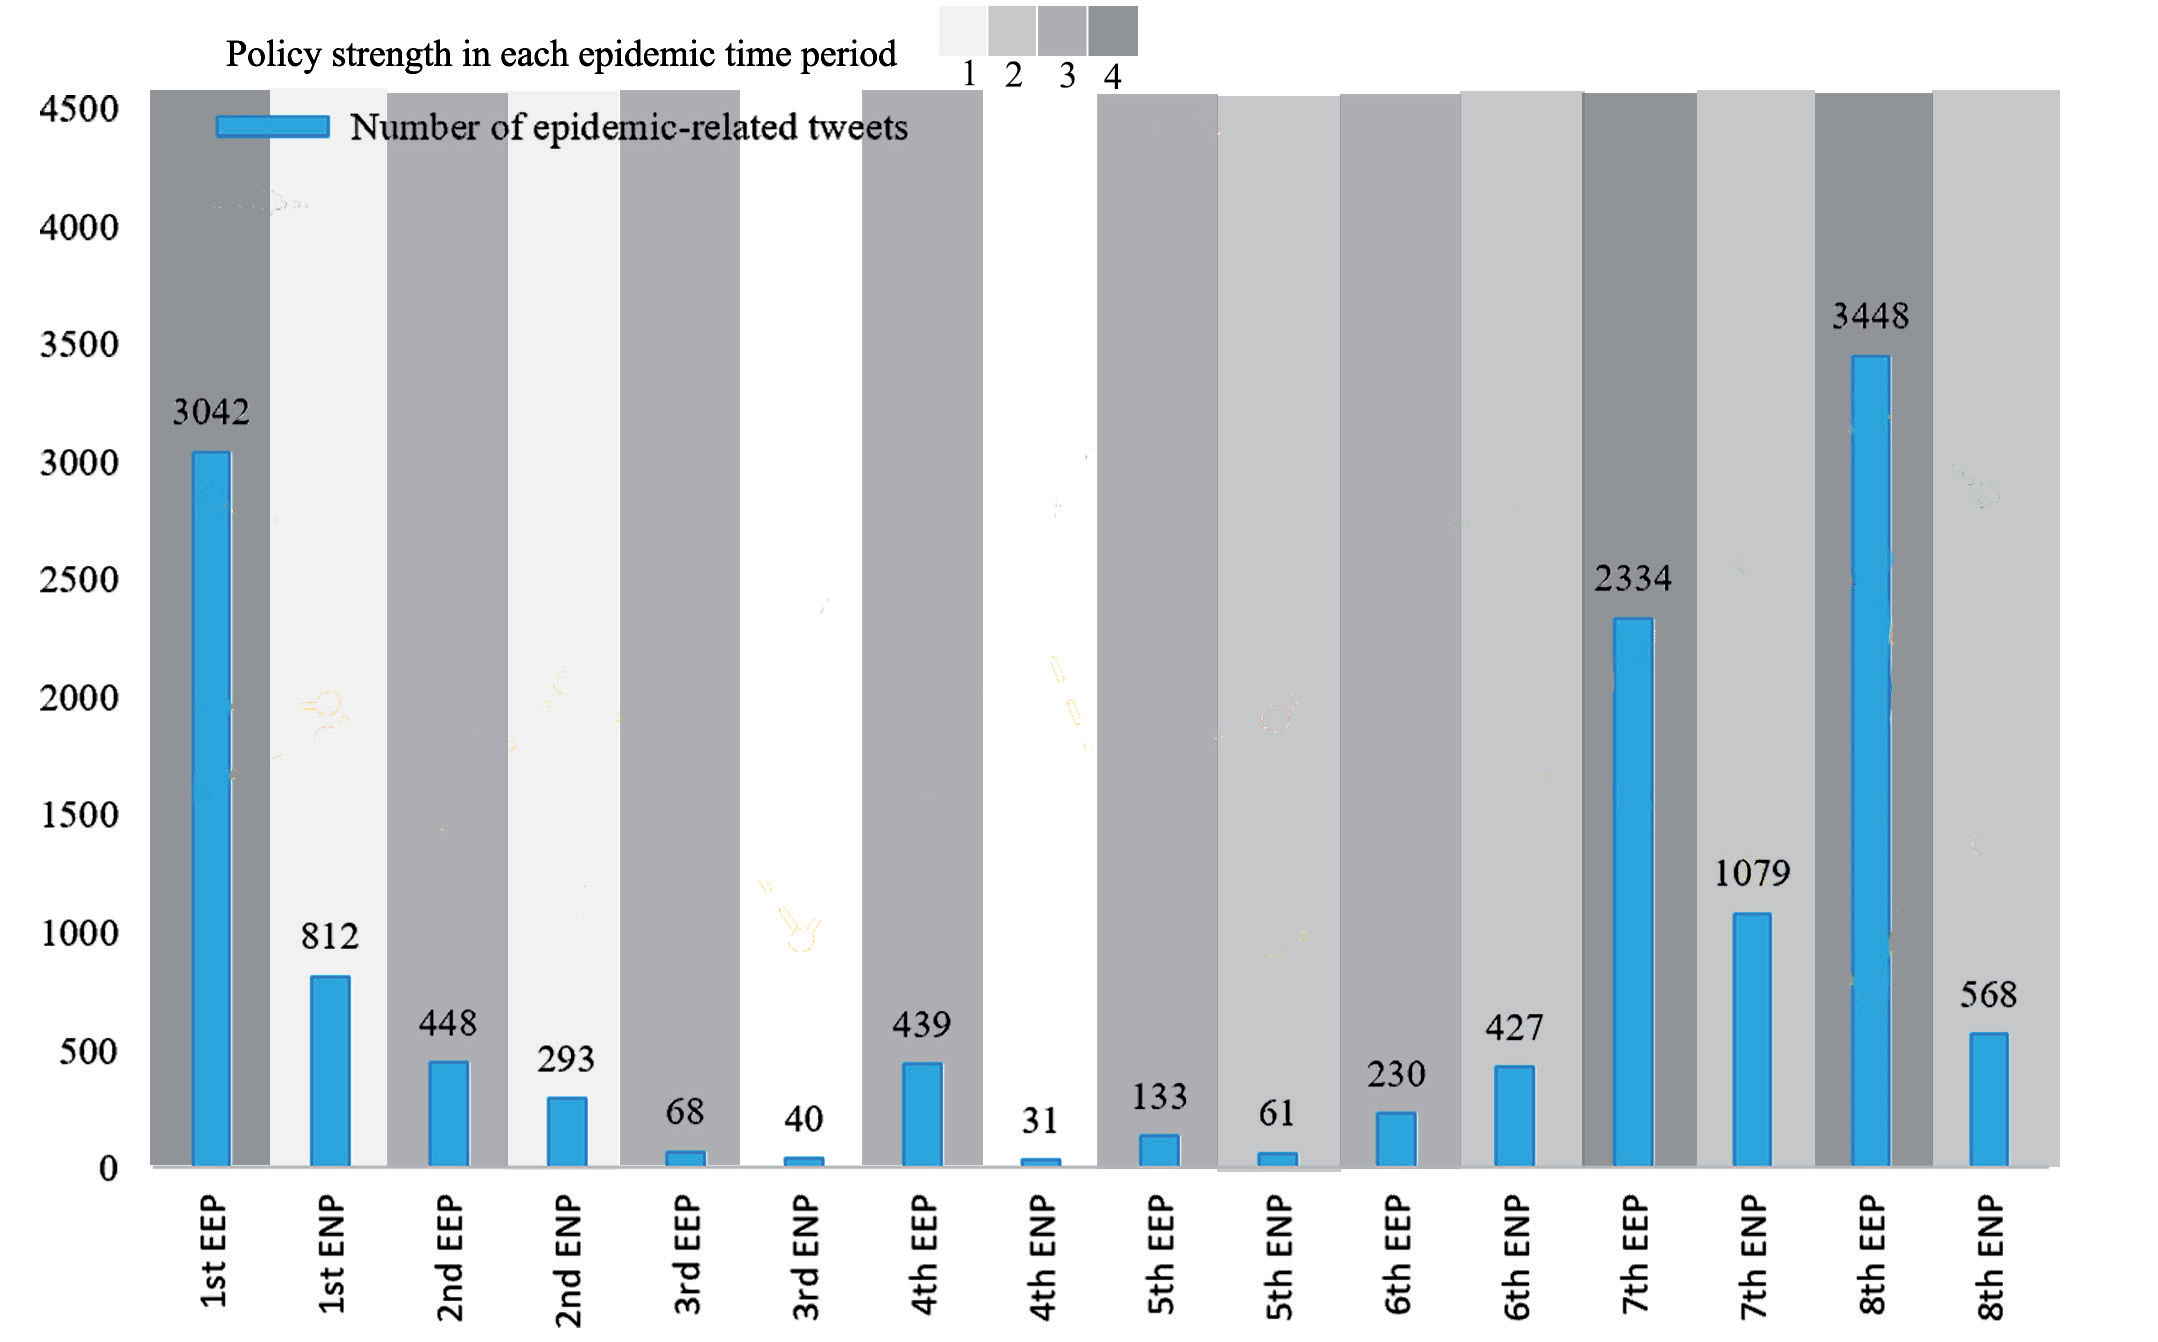
Trends in tweets of public responses to COVID-19 in Harbin during different epidemic periods.
Concurrently, Cluster 4 exhibits a distinct tendency towards the aggregation of posting frequency within the historic urban localities, notably the Chinese Baroque Quarter, Central Street, and St. Sophia’s Church, situated within the historical city center of Harbin. Generally speaking, urban heritage regions, after undergoing urban renewal, have garnered more attention compared to their unrenovated counterparts. Popular tourist destinations, such as the Harbin Central Street precinct, exhibited a posting frequency similar to that of the University district, while historic districts with a more pronounced local resident presence, such as the Chinese Baroque area, were subject to considerably less attention.
In contrast to other clusters, Cluster 5 and Cluster 6 have relatively low population densities. Hulan district and Songbei district are located north of the Songhua River, which are widely recognized as having lower levels of urbanization. Since 2015, Hulan district has been designated as an important new district to promote the Belt and Road Initiative and accelerate the revitalization of old industrial bases in northeast China.
Processing the geographical location data of Weibo posts showed that the hotspots (places where more posts were made) in the city were the historic city center of Harbin Core, followed by the residential and commercial center of Daoli District, and some other scattered hotspots (Fig. 3). This finding aligns with research into Covid-19 infection rates in urban areas of London, whereby infection rates are typically lower in public buildings and higher in residential buildings [50]. Interestingly, when comparing the hot maps of positive and negative sentiment expressions, the historic city center, including St. Sofia Church Square and part of its urban extension, Zhongyang Avenue (built in 1898 by Russian builders when the city was in its semi-colonial period), and the Chinese Baroque Quarter, stand out as common hotspots (Fig. 3).
Positive sentiment was found to be highly concentrated in central areas of the city, such as the Qunlixi residential area, HIT and Northeast Agricultural University. In contrast, negative sentiment posts were scattered across different parts of the city, with no particular concentration. These negative sentiment posts covered larger areas, including less popular regions with smaller populations.
Apart from a few pockets of positive sentiment in the city center, negative sentiment appeared to be more evenly distributed across the city, with a tendency to spread out towards the suburbs. It is worth noting that residents in the northern area of Harbin, such as the Hulan district, may require more attention and support due to their relatively lower level of discussion and higher prevalence of negative sentiment towards the epidemic.
Temporal Analysis on Public Attitudes Towards COVID-19 During Different Epidemic Periods in Harbin City
According to the announcement of the Harbin City Response to the COVID-19 Work Headquarters, the overall epidemic duration (Jan. 25, 2020 – May 22, 2022) is recognized into eight Epidemic Emergency Periods (EEPs) and corresponded Epidemic Normalization Periods (ENPs). Fig. 4. portrays the alterations in the quantity of tweets during each epidemic period. It can be seen that most epidemic-related tweets (75.39% in total) were posted during the EEPs. At the same time, the amount of Weibo posted during the ENPs has reached just 24.61% which is just around a quarter of the whole. This confirms that social media activities regarding adverse events, especially small-scale hazards, tend to peak during the events happening or activating when people’s daily lives are directly affected [51]. Overall, the total number of tweets reached 3 peaks, during the 1st EEP, the number of tweets (3042) reached the first peak, the 7th EEP (2334) reached the second peak, and the 8th ENP (3448) reached the third peak, which is also the highest point. Between the 1st and 2nd peak, the number of tweets has remained low.
Fig. 5.
Trends in attitudes of public responses to COVID-19 in Harbin during different epidemic periods.
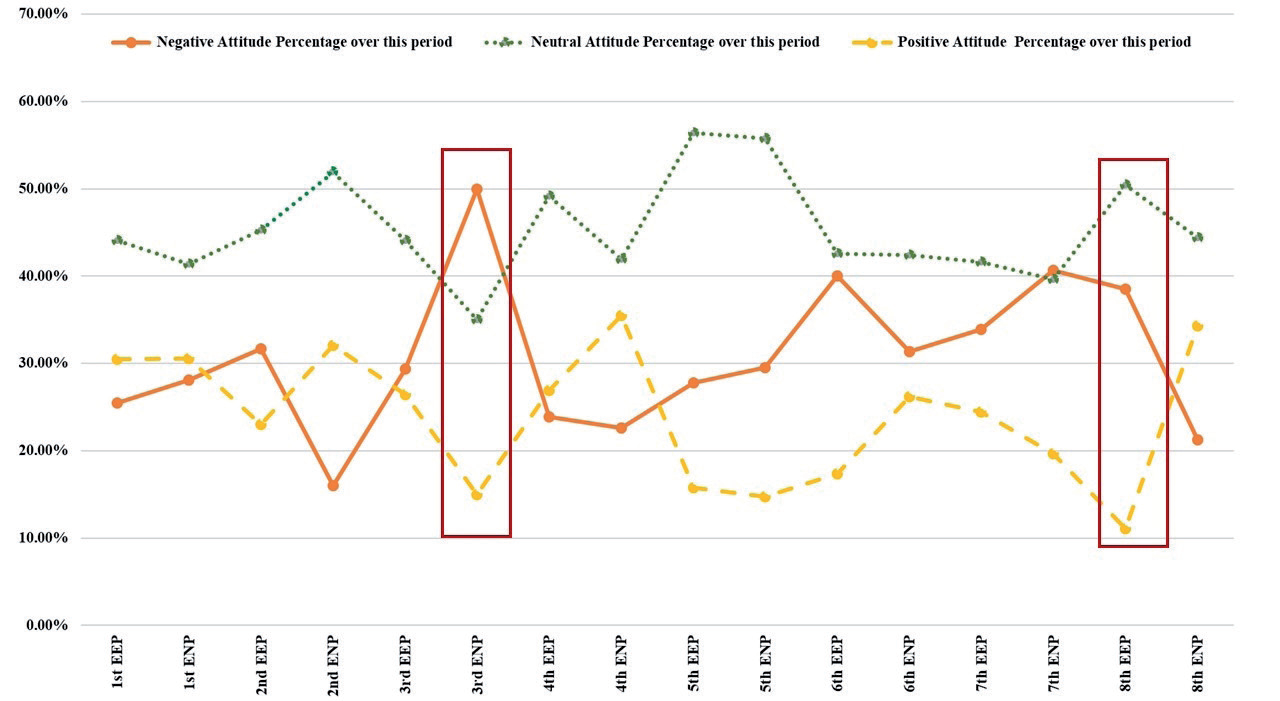
In terms of public attitude, Fig. 5 shows that attitude changes are divided into three stages, the first stage is 1st EEP-4th ENP, the Positive Attitudes (PA) and Negative Attitudes (NA) are repeatedly crossed, the second stage is 5th EEP-8th EEP, NA is always higher than PA, and the third stage is 8th ENP, PA rose significantly. During the entire time period, Neutral Attitudes are consistently far higher than the tweets that clearly stated attitudes (both PA and NA). Starting from the 1st ENP, the percentage of NA and the PA alternated on the rise, showing up with five intersections until the 5th EEP. In which, the largest difference occurs in the 3rd ENP as 35% between NA (50%) and PA (15%). Moreover, it is not until the 3rd ENP that Neutral Attitudes (35%) is below NA (50%) for the first time. It is worth mentioning that the total number of tweets during this period is the lowest in the whole period, only 1% of the peak. Since the 5th EEP, it has entered the second stage in which NA continue to be higher than PA. Since then, the PA remains steadily at a lower status than NA until the end of the 8th EEP. When Neutral Attitude (39.67%) is below NA (40.68%) for the second time in the 7th ENP, the amount of their tweets is very close. The second difference peak emerged during the 8th EEP at 27.44%, where NA (40.68%) is again higher than PA (11.05%) From the 8th ENP, the PA suddenly had a rapid upward trend, surpassing the NA by 13.03% in 8 days (May 15, 2022 - May 22, 2022).
Based on the content of the policies, this study categorizes strict intensity assignments to the prevention and control policies at each stage of the epidemic (see Appendix B). During the emergency period of most epidemics, there are more epidemic-related tweets than during the normalization period. The number of epidemic-related tweets in 1st EEP is 2230 more than that in 1st ENP. During the emergency period, the country and local governments took very strict measures to deal with the epidemic, and the public reacted strongly to the epidemic. However, the number of Weibo posts in 6th ENP is higher than that of 6th EEP, probably because it is during the Spring Festival, when the public is more concerned about the epidemic. From the 3rd EEP to the 6th ENP, which concentrated within four months, no very strict policies were implemented, and the number of epidemic-related tweets has decreased significantly (10.62% in total epidemic waves). However, in the7th EEP and 8th EEP, the number of epidemic-related tweets has risen sharply, even reaching the highest value since the epidemic (3448). From this it is clear that, during the severe period of the epidemic, the central and local governments and communities took strict prevention and control measures, and the daily life and emotions of the public have been seriously negatively affected. In summary, a lesson is obtained that community resilience requires all parties to get more prepared for the incident together [52]. For example, in the early stage of the epidemic, more accurate epidemic prevention measures are not sufficient, but more regional static management, while precise measures to prevent the epidemic in the later stage of the epidemic have achieved significant results.
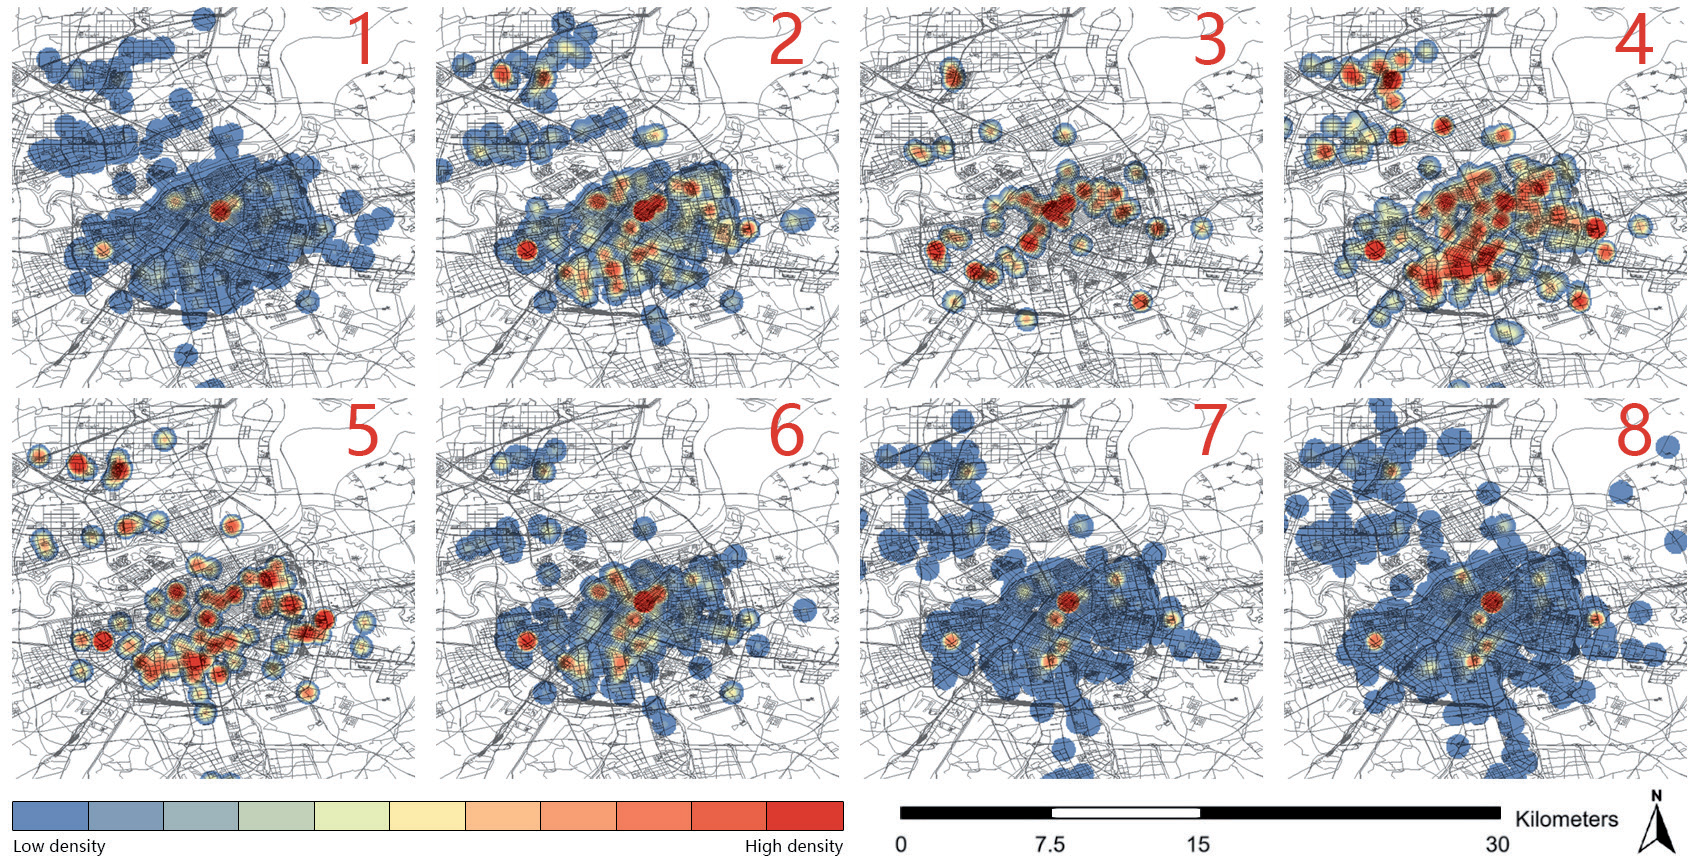
The hotspot maps for each of the eight phases of policy management consistently showed high levels of user engagement in outbreak prevention and control in the historic central district of Harbin (see Fig. 6). Throughout the course of the epidemic, the distribution of user-generated posts showed a dispersal-concentration-dispersal pattern that evolved over time. During the initial phase of the epidemic and the near-closure phases (7th and 8th), the distribution of posts was more widespread and evenly distributed, indicating a lower level of concentration. However, during the intermediate phases (2, 3, 4, 5 and 6), a remarkable pattern of centripetal, multiplicative and clustered distribution of posts emerged. Importantly, this clustering pattern coincided with a period characterized by the absence of extremely strict quarantine policies. The implementation of highly restrictive traffic control policies had a greater impact on residents living in the peripheral areas of the city, whereas moderately restrictive traffic control policies had a greater impact on residents living in the central areas.
This observation is also linked to changes in the emotional state of the population. In the early stages of the epidemic, a more dispersed population had difficulty adapting to abrupt lifestyle changes. As users gradually adjusted to the inconveniences of travel restrictions in the middle phase, only a portion of habitual Internet users continued to actively post on Weibo. Towards the end of the epidemic, residents’ dissatisfaction with the mandatory quarantine policy and related implementation issues again attracted national attention.
Correlation Between Attitudes and Various Variables in Relation to COVID-19: an Investigation Using Pearson Correlation Coefficient
In this study we examined the correlation between attitudes and various variables, including policy, land use function and others, using the Pearson correlation coefficient. This study aims to investigate the correlation between specific urban factors and the satisfaction of residents, with a primary focus on the individual effects of these factors rather than their interrelationships. Therefore, the problem of multicollinearity among urban factors is not considered a major concern when choosing the regression model [53]. A significant correlation in statistics indicates a relationship that is unlikely to have occurred by chance. A significant negative correlation indicates an inverse relationship between two variables, while a significant positive correlation indicates a direct relationship between two variables. The results presented in Table 4 show that attitudes were significantly correlated with certain variables, while no correlation was observed with others.
In particular, a significant positive correlation suggests a consistent pattern where neutral attitudes are associated with higher scores on the variable related to the location of the account IP (V2). As V2 increases, scores on the positive sentiment variable also tend to increase. This implies that non-local users tend to post more neutral sentiments compared to locals, while locals are more optimistic about the pandemic. On the other hand, significant negative correlations were found between negative attitudes (V0.1) and the geotagged location of the post (V3) at the 0.001 level of significance. At the same time, significant positive correlations were observed for neutral sentiments at the same level of significance. These results suggest that users located in the city center tend to post more negative sentiments on social media, while individuals from outside the central urban area tend to adopt a neutral attitude.
Furthermore, the variables strictness of quarantine policy (V4) and stage of epidemic (V5) show significant correlations with all three categories of feelings. Both variables show a positive correlation with negative and neutral feelings and a negative correlation with positive feedback. These results suggest that the increasing strictness of the quarantine policy and the repeated extension of the quarantine period have a negative impact on public sentiment. Interestingly, users living in residential areas (V6.2) and commercial areas (V6.3) express positive feelings about pandemic measures. Residents in residential areas tend to express more complaints, while people in commercial areas give more positive feedback. Users of tourist attractions (V6.4) express a mixture of negative and positive feelings. Public facilities (V6.5) show a significant positive correlation with neutral and positive feelings, while users of green areas (V6.6) have a negative impression.
Further Discussion and Limitation of the Research
Since 1989, Harbin has experienced rapid urban expansion. By 2013, Harbin’s construction land area had expanded 1.80 times, its economy had grown 31.85 times and its population had increased by 9.02% [54]. In the last 20 years, the focus has been on developing new areas, while renovating old urban areas, gradually raising the level of housing and improving the living environment in new areas and old areas in stages, such as the construction of the Hulan district. With such rapid urbanization, Harbin’s urban resilience has been challenged by the sudden outbreak of the pandemic. The study encourages government and decision-makers to consider the needs and preferences of the community when formulating policies and managing urban planning. This can con-tribute to the overall resilience of the community and ensure that urban development is aligned with community interests.
This study analyzed the spatial distribution of tweets related to the COVID-19 epi-demic in Harbin city. The results suggest that users located in areas with universities and research institutes showed a higher positive sentiment towards the epidemic. In contrast, negative emotions were more prevalent in areas outside the central city of Harbin, suggesting the need for targeted interventions and communication strategies to promote public health and well-being in these peripheral regions. Improving the response to pandemics or other emergencies requires a comprehensive approach involving multiple stakeholders, including government agencies, healthcare providers, community organizations and individuals. Community engagement is therefore essential to better understand the needs of these stakeholders and to develop appropriate strategies. It is worth noting that this approach must include several components, including strengthening health infrastructure, raising public awareness, improving communication and coordination, developing a comprehensive response plan and supporting vulnerable populations.
Analysis of the temporal dimension of community resilience shows that a coordinated effort by all parties is needed to prepare for and respond effectively to events. The results showed that during the emergency period of most epidemics, there are more epidemic-related tweets than during the normalization period. This is because during the emergency period, the national and local governments took very strict measures to deal with the epidemic, and the public reacted strongly to the epidemic. This suggests that effective communication channels with the public and other stakeholders are essential to provide accurate and up-to-date information about the epidemic, to prevent the spread of misinformation and rumors, and to ensure that resources are allocated effectively. Meanwhile, increasing public awareness and education about the epidemic helps to reduce panic and fear, while increasing compliance with preventive measures, including signs and symptoms of the disease, preventive measures and appropriate responses.
The Pearson correlation analysis demonstrates the correlation between attitudes and various variables in relation to COVID-19. The positive correlation between positive attitudes and commercial land suggests that businesses and economic activity can contribute positively to community resilience. It is therefore recommended that financial or other incentives be provided to local businesses offering outdoor recreational activities such as skiing and ice skating to stimulate the local economy while encouraging the use of natural areas and recreational spaces. Such a strategy can help promote wellbeing in times of crisis, while providing an additional outlet for physical activity and stress reduction. In addition, from the policy-making point of view, policy makers should establish and enforce regulations that protect natural areas and recreational spaces, such as parks and trails, from the threat of development and such ensure the availability of these spaces in times of crisis.
This study has several notable limitations that deserve attention. First, in addition to the brief comparison made between Weibo hotspots and population distribution, it is important to acknowledge that population hotspots may also show interrelationships with Weibo hotspots. Future studies should aim to explore the unique phenomena that Weibo hotspots may reflect, and to elucidate the behavioral responses they elicit in scenarios beyond those related to COVID-19.
Second, although our assessment approach was innovative, further investigation is needed to improve the inference of spatiotemporal causality. While this study examines changes in the spatial distribution of hotspots in relation to temporal dynamics, it is crucial for future research to further consider spatially varying counterfactuals based on time-varying factors. This approach would allow analysis of the causal relationships underlying spatial changes. Our use of Pearson correlation analysis as a non-spatial linear statistical analysis approach serves as a starting point for exploring the relationships between the variables of interest. It is recommended that Geographically Weighted Regression (GWR) analysis be included in future studies as it can provide valuable in-sights by capturing spatial autocorrelation and potentially uncovering localized relationships between variables. Future research could consider incorporating spatiotemporal heterogeneities into causal analyses by accounting for temporal and spatial autocorrelations within traditional spatiotemporal models.
Finally, it is important to acknowledge that the current social media dataset does not cover the entire duration of the pandemic. This limitation may introduce bias in the estimation of the impact of interventions over time. To address this, future work should track a longer time series of mobility behaviors following the COVID-19 outbreak and policy implementation, provided the necessary data are available. Future work is encouraged to develop a more comprehensive understanding of the spatiotemporal dynamics and causal relationships within our research domain. In addition, the subjective nature and lack of precision in manually assessing sentiment based on text and emoticons highlights the need for future research and practical applications to incorporate artificial intelligence tools, particularly natural language processing (NLP). By using NLP techniques such as sentiment analysis, larger volumes of textual content can be efficiently processed and analyzed, providing more objective and accurate insights. Incorporating AI-driven approaches will improve the reliability and scalability of sentiment analysis in various domains and enable a deeper understanding of sentiment patterns.
Conclusions
The study makes a notable contribution to our understanding of how to map people’s perceptions and identify the urban factors that are most affected during times of crisis using real-time social media data. Through a novel approach of using social media data to analyze the public response to COVID-19 in Harbin, the study explored public responses to the pandemic and assessed perceived community resilience in a spatiotemporal context in regions severely affected by recurrent epidemics. The findings highlight the significant impact of the epidemic and related prevention and control measures on public sentiment, underscoring the need for comprehensive and targeted interventions.
This research makes a valuable contribution to the existing knowledge on community resilience and demonstrates the potential of social media data in analyzing public responses to health emergencies. Advanced analytics and machine learning algorithms can assist researchers and public health officials in extracting valuable insights from social media platforms. The real-time nature of social media provides a responsive and adaptable means of understanding the evolving landscape of public opinion in the post-COVID era. In addition, targeted analysis of social media data can offer valuable insights for developing precise communication strategies, public health interventions and policy adjustments to address emerging issues and ensure the accurate dissemination of information.
This research enhances comprehension of the urban Chinese context and presents valuable perspectives for urban planning and administration in similar regions. The possible future utilization of social media data for comprehending public perception in the post-pandemic epoch demands continued online discourse analysis and monitoring. By understanding the dynamics of public perceptions and responses, policymakers can effectively anticipate and meet the needs of communities during crises, thus enhancing the resilience and preparedness of cities. Further research is required to investigate the utilization of non-linear assessment techniques that integrate both temporal and spatial dimensions to capture spatiotemporal heterogeneity and improve causal inference.

