


Introduction
Water stressed countries are increasing, which is about one-third of the total population globally and this ratio will rise to two-thirds in 2025 [1]. Many nations will have water shortage problems by 2025 [2] and approximately 70 million of the world’s population will have to be fed by 2050. There will be shortage in safe drinking water supplies to almost 48 countries, corresponding to 2.9 billion in the next 10 years [2]. There is an increase in glacier melting and a decrease in snow falling, contributing to substantial variance in annual runoff potential and a decrease in drinking water supplies [1]. Besides surface water, groundwater is also an important source of water supplies and is very significant for all living things on the planet. Due to runoff, the quality of the groundwater is deteriorating due to an excess of pollutants and different distributions. To conserve the quantity and quality of water, lots of detailed studies are carried out for monitoring short-term droughts, dam construction, and for quantifying the major drivers for the expanding lakes [3-5]. Similarly, studies have been conducted to treat wastewater for the mitigation of shortage of good quality water worldwide accordingly [6-8]. In this regard, bamboo charcoals are used for removing organic solvents from wastewater [9, 10].
Owing to the absence of amenities and organizational structure in developing countries [9], the melting water waste’s main share is toppled to different water surface areas. In the same way, the swift urbanization and industrialization and inhabitants’ growth unfavorably affecting the value of surface water. Human involvement is polluting the water, which requires a quick extenuation action. Water contamination is another rising problem in managing the environment [11]. Due to the unavailability of the correct data on the river water supplies, the management of the river is also facing problems [12, 13]. Traditional approaches to gathering data and conducting water quality tests are labor-intensive, expensive, and time-consuming. The management procedures aimed at reducing water degradation are halted due to a lack of technical and financial resources. In order to reduce the time and effort needed to monitor the water quality of any water body, as well as the cost and difficulty of doing so, we need to use the most up-to-date and reliable tools and techniques available [11, 14].
Climate change is also causing a problem in severe conditions and different scenarios for the emission of radiation and increase in temperatures [2]. Water scarcity is mostly attributable to population growth, economic activity, and the impact of climate change. When there is a greater demand for water than there is supply, a region’s water allocation becomes inadequate, leading to a drop in available water on a per-person basis. If people’s standard of life continues to rise, leading to more urbanization, the problem will only get worse.
The watershed in hydrology is difficult due to the abrupt changes in climate and geological parameters [15, 16]. Irrigating agricultural land is a major component for the people living in the society nearby, surpassing the edge for sustainable water consumption. In water sustainability, excessive pumping from groundwater and everlasting surface water consumption are the major concerns in arid and semi-arid regions [17].
Besides surface water and other water sources, groundwater has a lot of importance globally due to its easy accessibility. It is expected to be more harmless than all other water sources because of its excessive filtration through a complex nature of the underground soil [17]. The major concern in groundwater pumping is the more water demand and less water availability, lowering the groundwater levels yearly. Due to easy availability of the groundwater, the irrigation system is mostly accomplished by the groundwater which is widely used in replacement of the surface water which is decreasing day by day. This water table level management is accomplished by considering the total recharge and discharge through the groundwater and maintaining the actual level in future for further usage.
Estimation of the groundwater lowering rate is very important in water budget analysis in a watershed for sustainable water management. The discharge rate from the groundwater should not be increased than recharging the groundwater for its sustainability for a longer period of time. It takes thousands of years to recharge the groundwater, there are also many groundwater recharging techniques like rainfall harvesting but they all require the groundwater potential zones to be estimated [18-20]. In these perspectives, geographic information system (GIS) and remote sensing (RS) techniques have been employed in literature to explore groundwater potential zones. The GIS and RS are helpful techniques for discriminating, evaluating, and managing groundwater resources because of their capacity to obtain and understand data at large scale in short period [21]. For instance, the study [14] conducted quantitative assessment of water resources for Happy River using GIS and RS techniques. As per their results, some districts along with the Happy River have good water resource conditions. Another study [17] explored water demand of canal command in lower Chenab command using GIS and RS techniques. It was observed that water shortages were >50% at both distributaries and maximum water shortfall was 4.9 million cubic meter per year. In addition, the study [21] explained the upscaling water productivity in irrigated agriculture using GIS and RS techniques. The groundwater abstraction rate depends upon the actual water demand of crops, humans for drinking. The methods for quantifying groundwater, including the tube well utilization factor analysis, are not as suitable when applied to a basin level.
The importance of water was recognized as a priority in the Moroccan national policy for sustainable development. Besides climate change, the country faces 90 % of water consumption due to irrigation. Morocco has chosen to employ artificial recharge at this time in consideration of population growth, resource depletion, climate change, and human activities. In order to fulfil the demands of a growing population, more storage capacity and resource management are needed. This is a serious issue since it jeopardizes the availability of safe drinking water and the consistency of the country’s water supply.
In this regard, the present study aims to explore groundwater recharge zones for in Guercif (i.e., arid region), Morocco in order to meet current and future water needs as well as for better management of water resources. The groundwater potential zones are explored by means of multicriteria decision analysis (MCDA) technique. The MCDA is performed in Geographic Information System (GIS) software for investigating major parameters including slope, drainage density, land use landcover, geology, soil type and groundwater levels.
Material and Methods
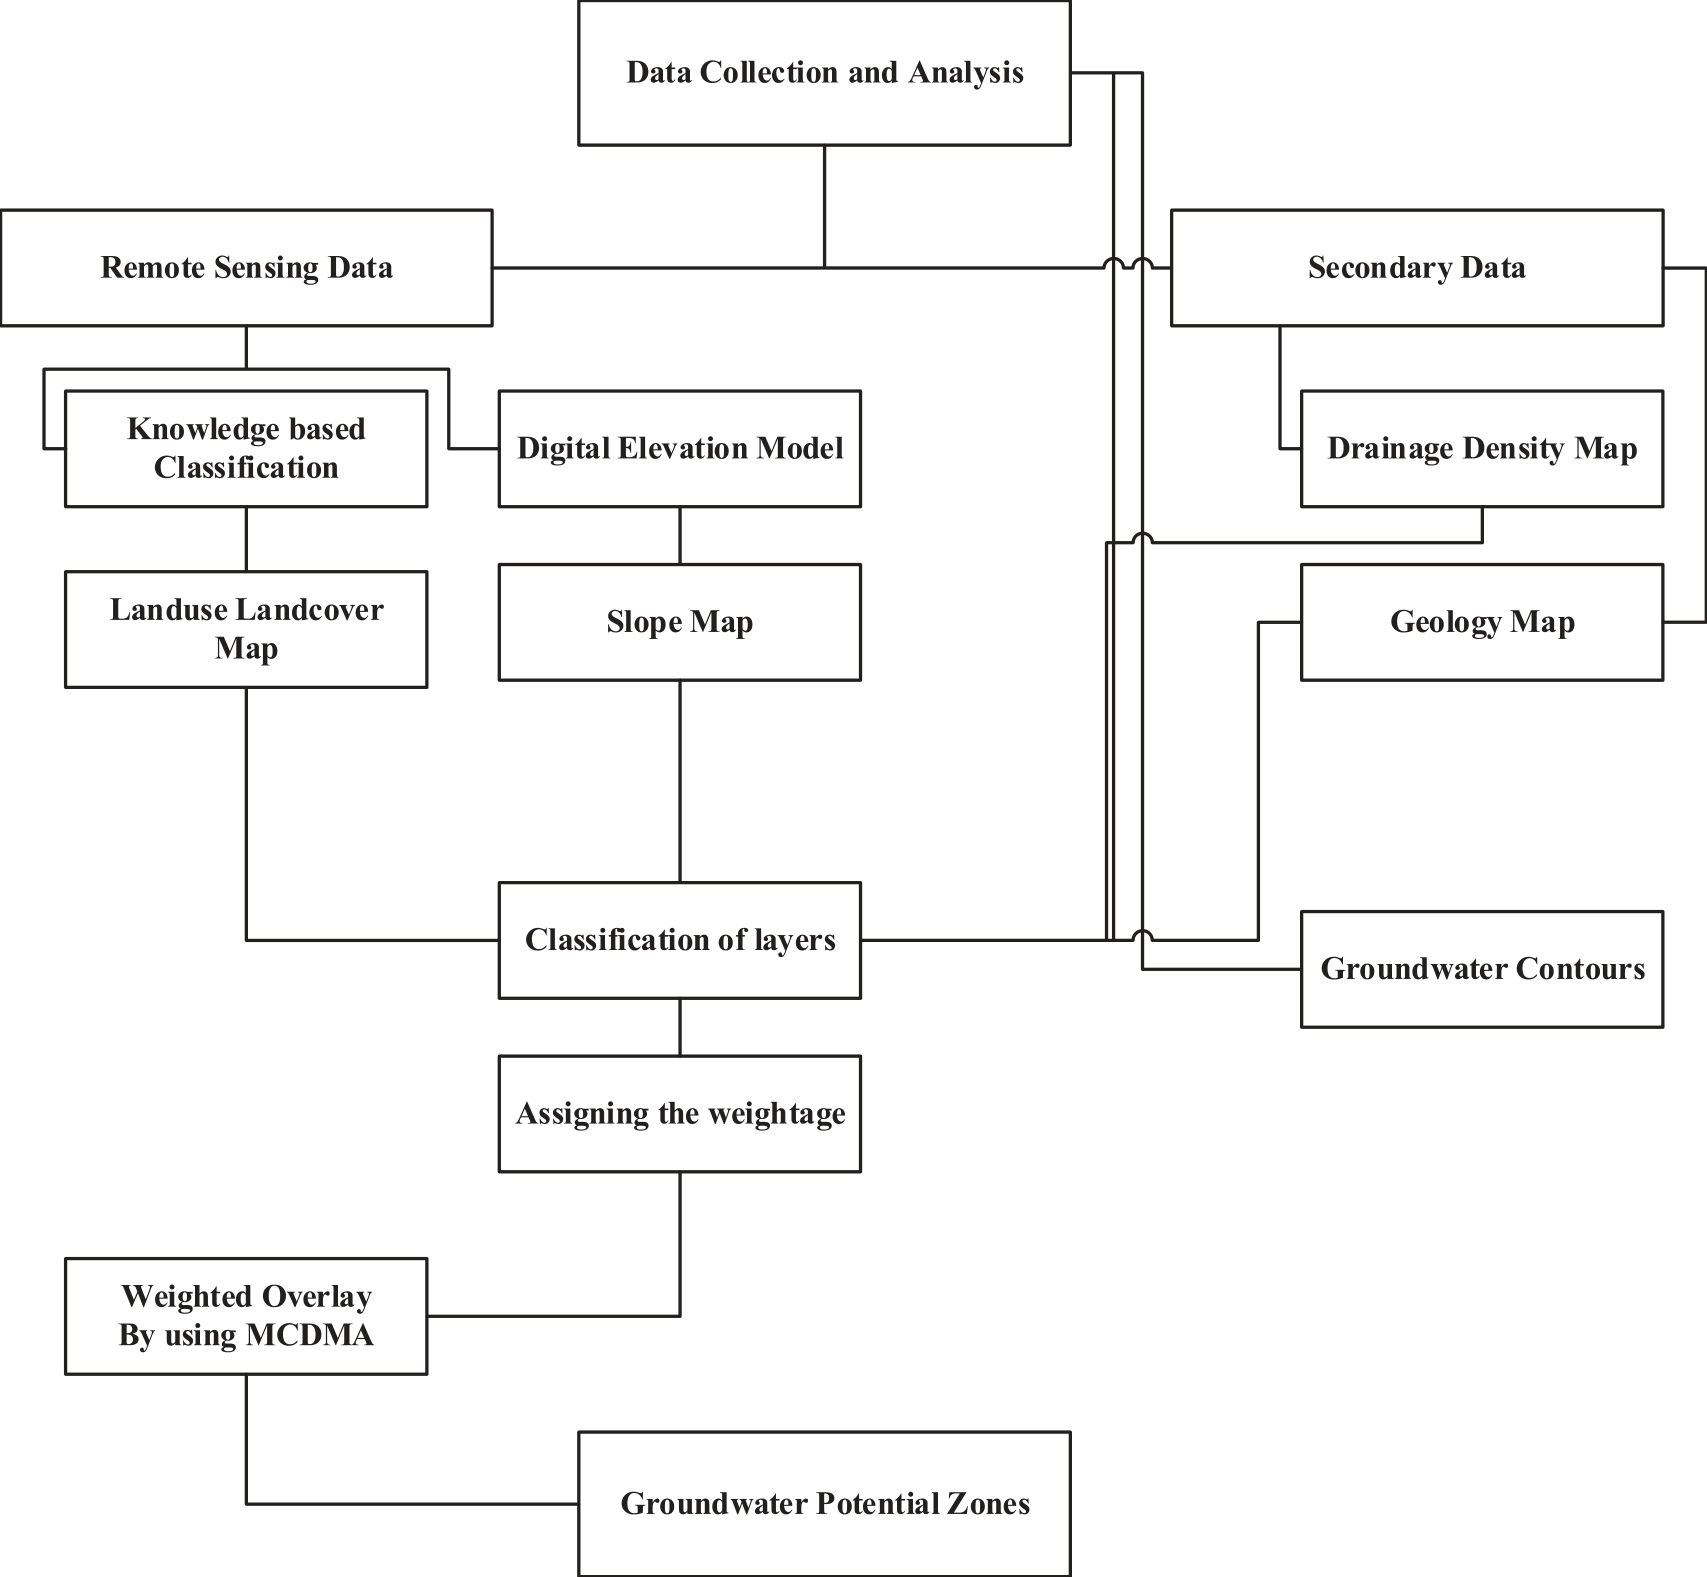
Fig. 2 provides a flow chart displaying the summary of research methodology executed in this study. The research methodology mainly involves six steps namely: study area selection, data acquisition/ processing as well as geomorphological/ topo-hydrological factors, slope, drainage density, and land use land cover, geology, thematic layer handling, and multi-criteria decision analysis (MCDA) technique for suitable locations. The extensive details of each step are available in following sections.
Study Area
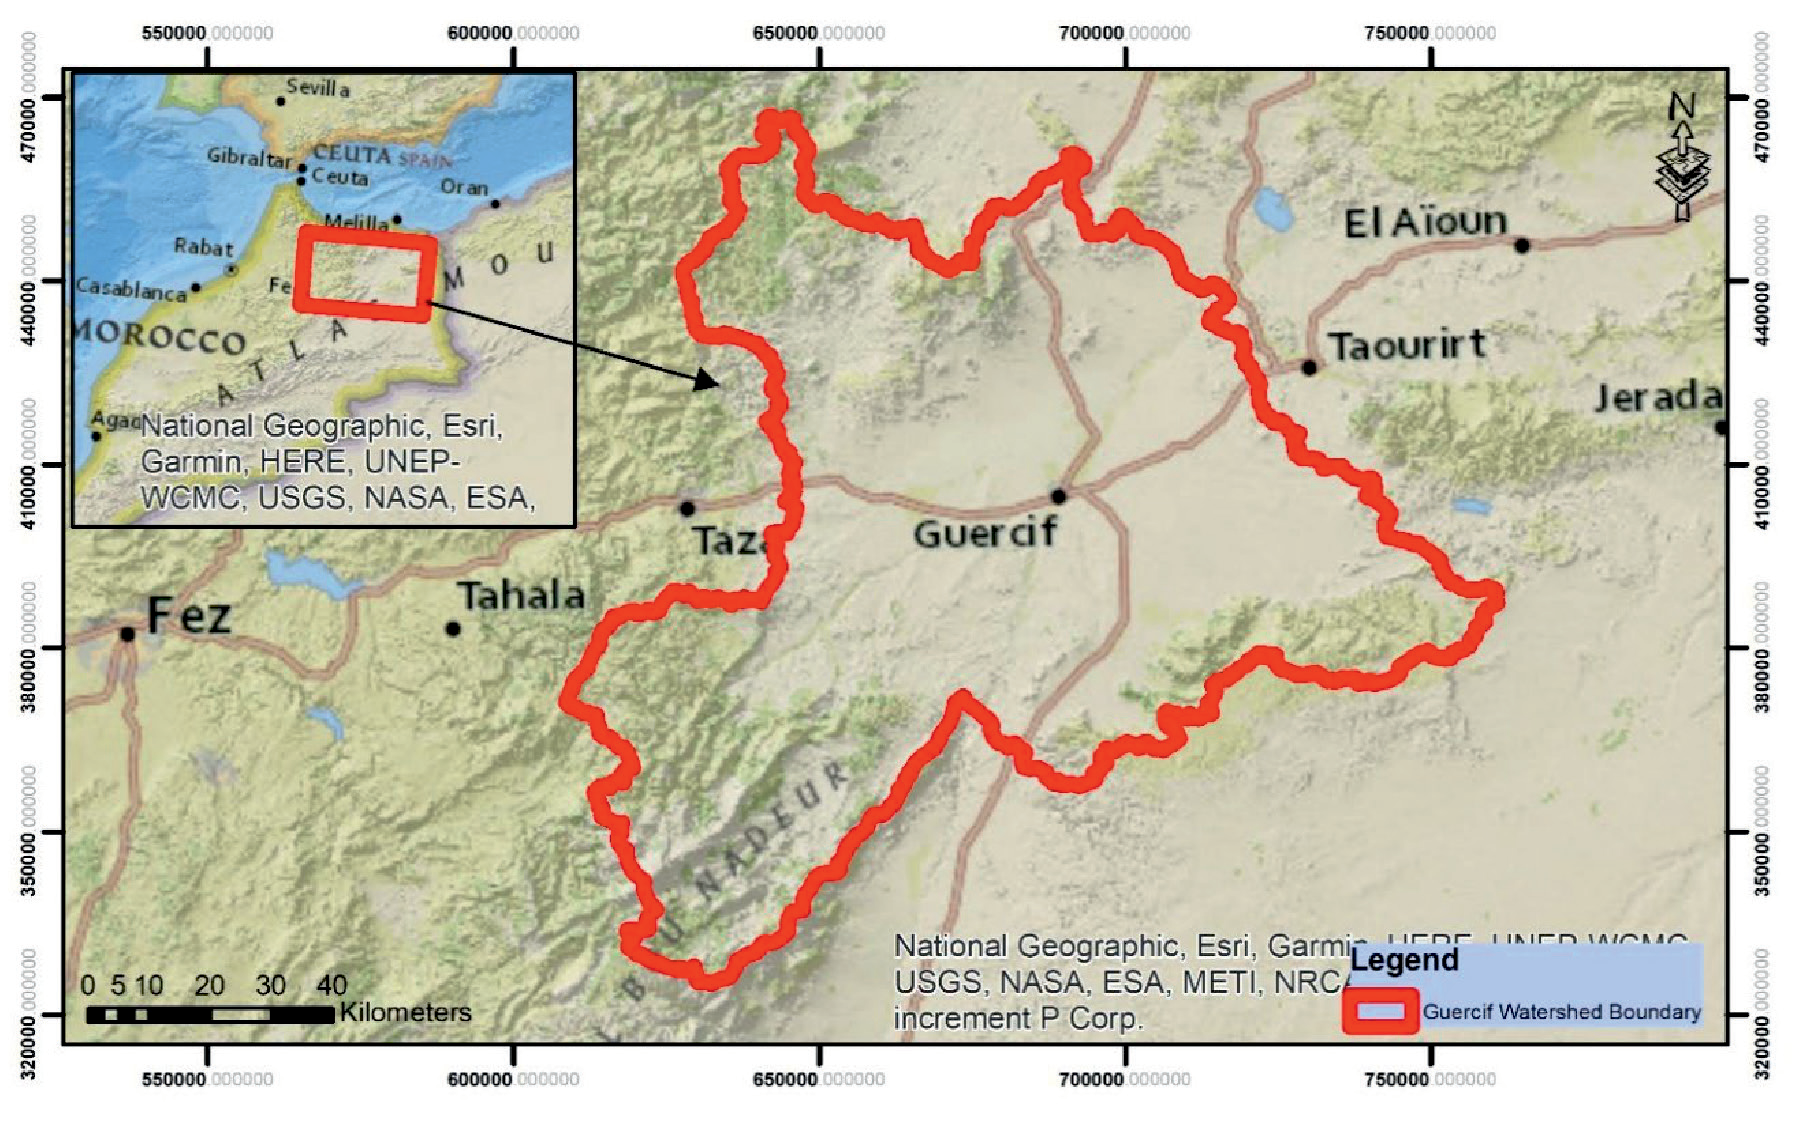
The Guercif basin is bounded by the Middle Atlas to the southwest, the Debdou chain to the southeast, and the Beni-Bou-Yahi - Beni-Snassène chain to the north. It is situated between the west-east corridors of Taza and Taourirt, and between the south-north corridors of Average and Basse-Moulouya. This region constitutes in many respects a transition zone. It is cut in two by the Moulouya wadi which receives, on the left bank, the wadis Melloulou and Msoun, originating respectively from the Middle Atlas and the Rif. It can be divided into four plains: in the center and to the west, the plain of Jel, with an area of 650 km2, and an average altitude of 350 m; to the east, the Tafrata plain (500 km2 in area and 500 m in average altitude); to the north, the Sangal plain (200 km2; 300 m); to the south, the plain of Mahrouf (150 km2; 700 m). These four sectors have many characteristics in common, especially about needs, vegetation and human occupation. Geomorphologically, the Guercif basin consists of a plio-villafranchian surface covered in the center by a more recent filling [22]. The study area is shown in Fig. 1.
Data Acquisition/Processing and Geomorphological/Topo-hydrological Factors
Four thematic layers including the slope, drainage density, land use landcover, and geology have a total control on the groundwater availability [23]. A weighted overlay method (Spatial analyst tool) in ArcGIS is used for developing the groundwater potential zones. All the thematic layers are developed, and they are classified into different categories based upon the availability.
Slope, Drainage Density, and Land Use Land Cover
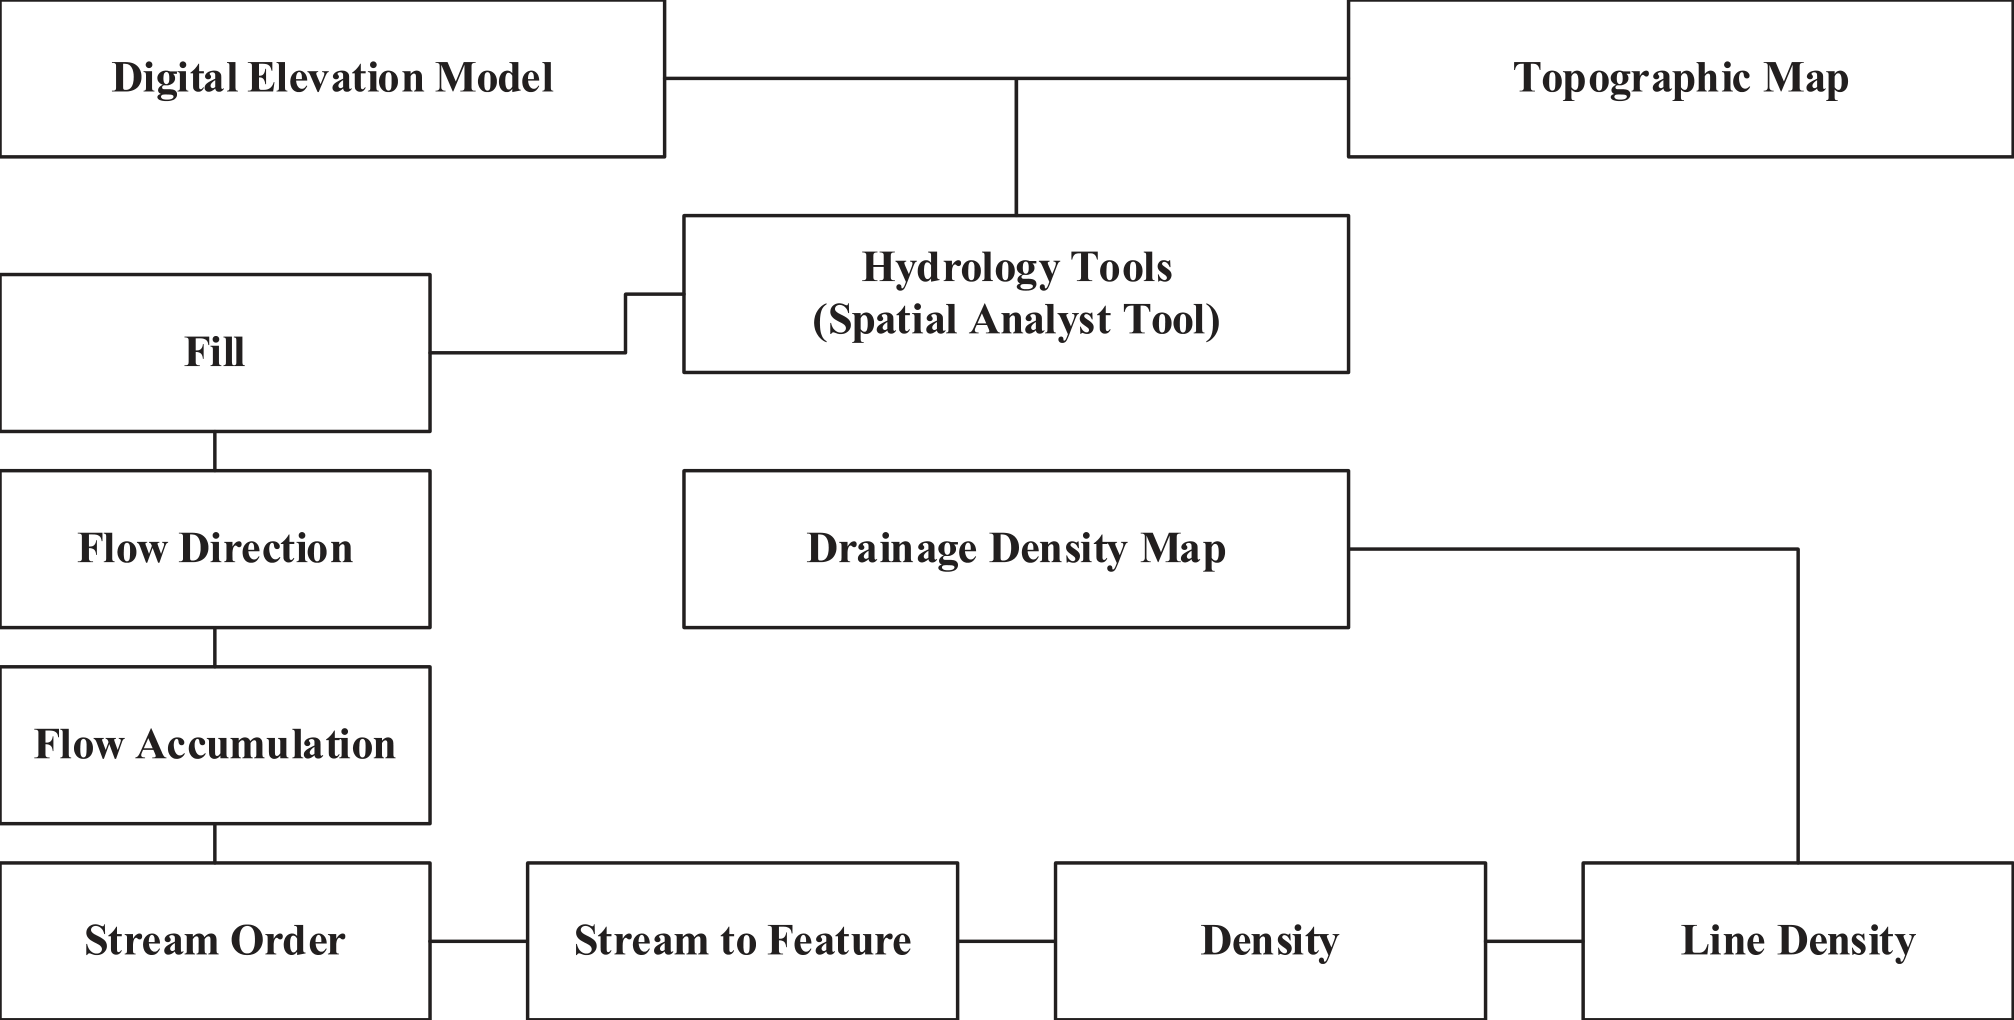
The Digital Elevation Model (DEM) of the study area was established using SRTM data. The groundwater recharge process is significant in low slope zones. By using the slope (Spatial Analyst Tool) in ArcGIS, slope map is established [24]. From the topographic map and digital elevation model, the drainage density map was established [25]. Which is further classified into 10 different classes i.e., 0.18 to 2.16 (length of drainage /km2). A detailed flow chart for drainage density map development is shown in Fig. 3. By using the Landsat image classification method in ArcGIS [26], land use landcover map is established which shows the different land pattern within the Guercif watershed boundary. Different classes i.e., Bare, urban area, cropland etc. was established for this. A detailed flow chart for this step is shown in Fig. 4.
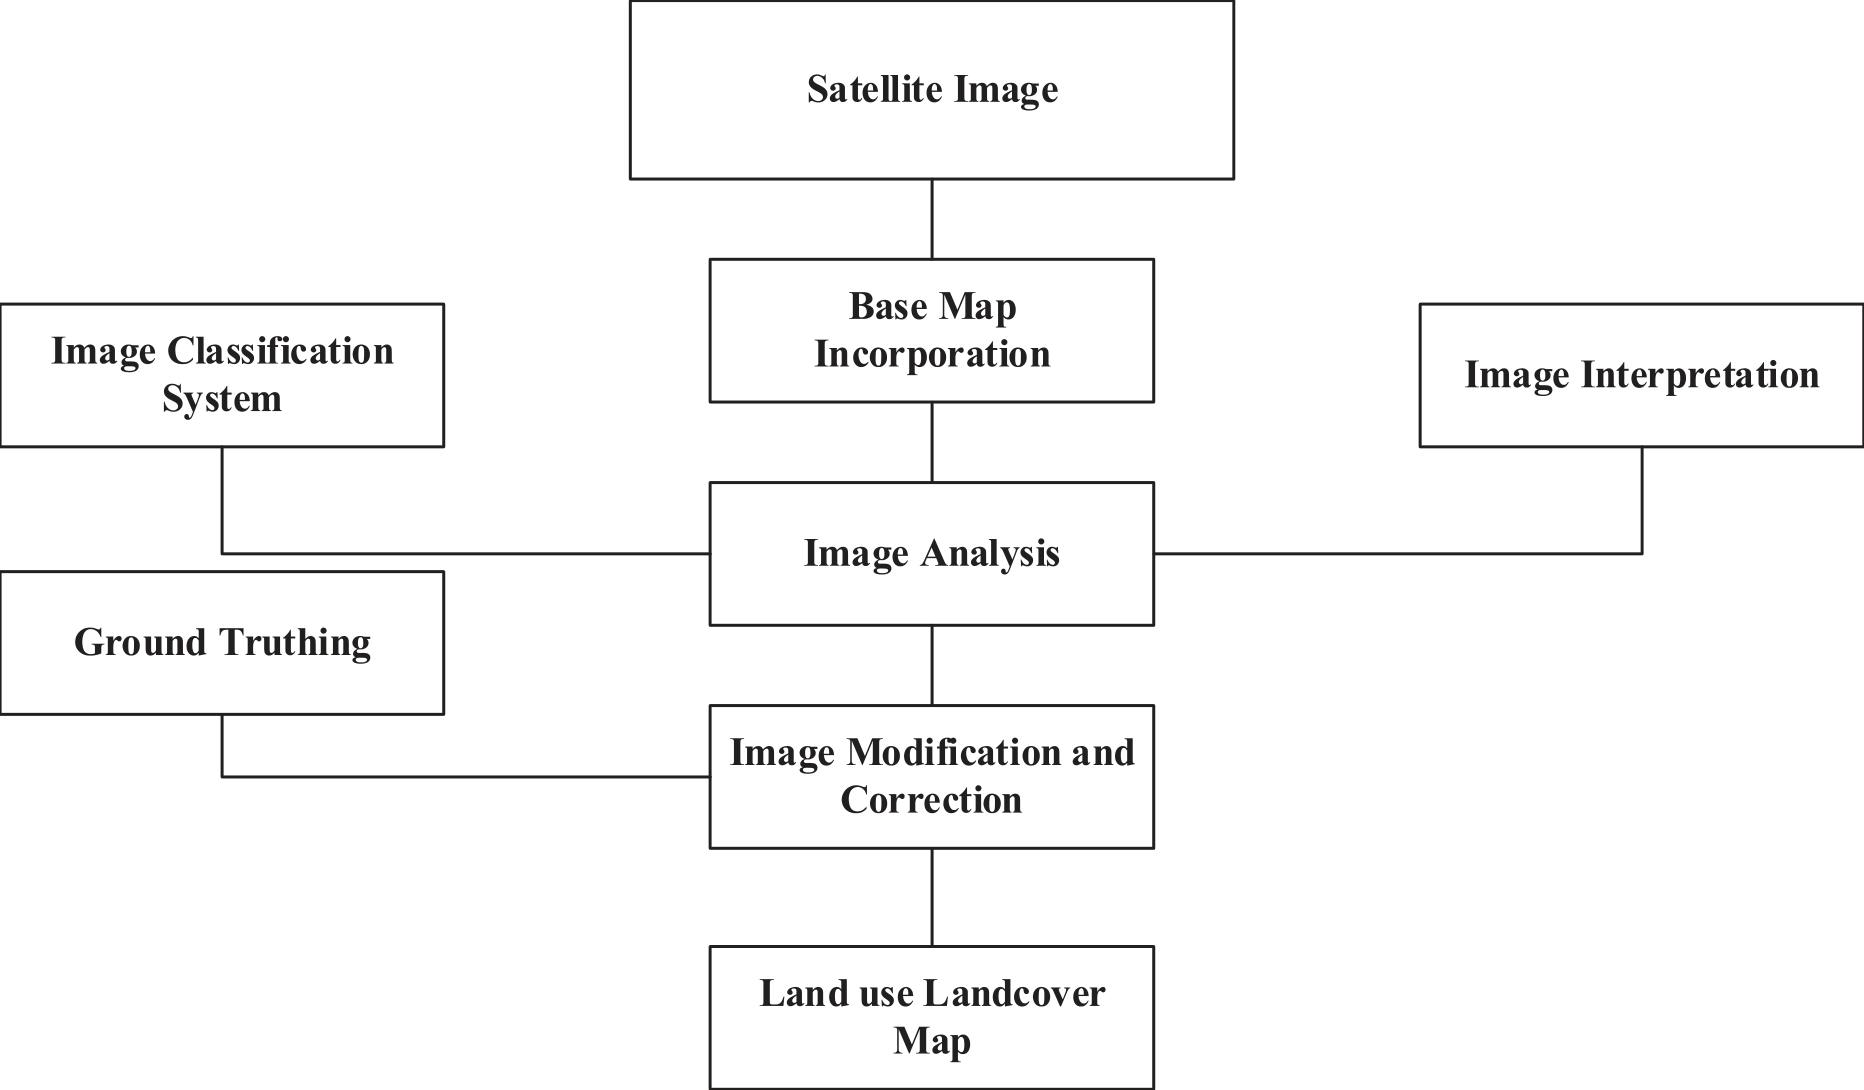
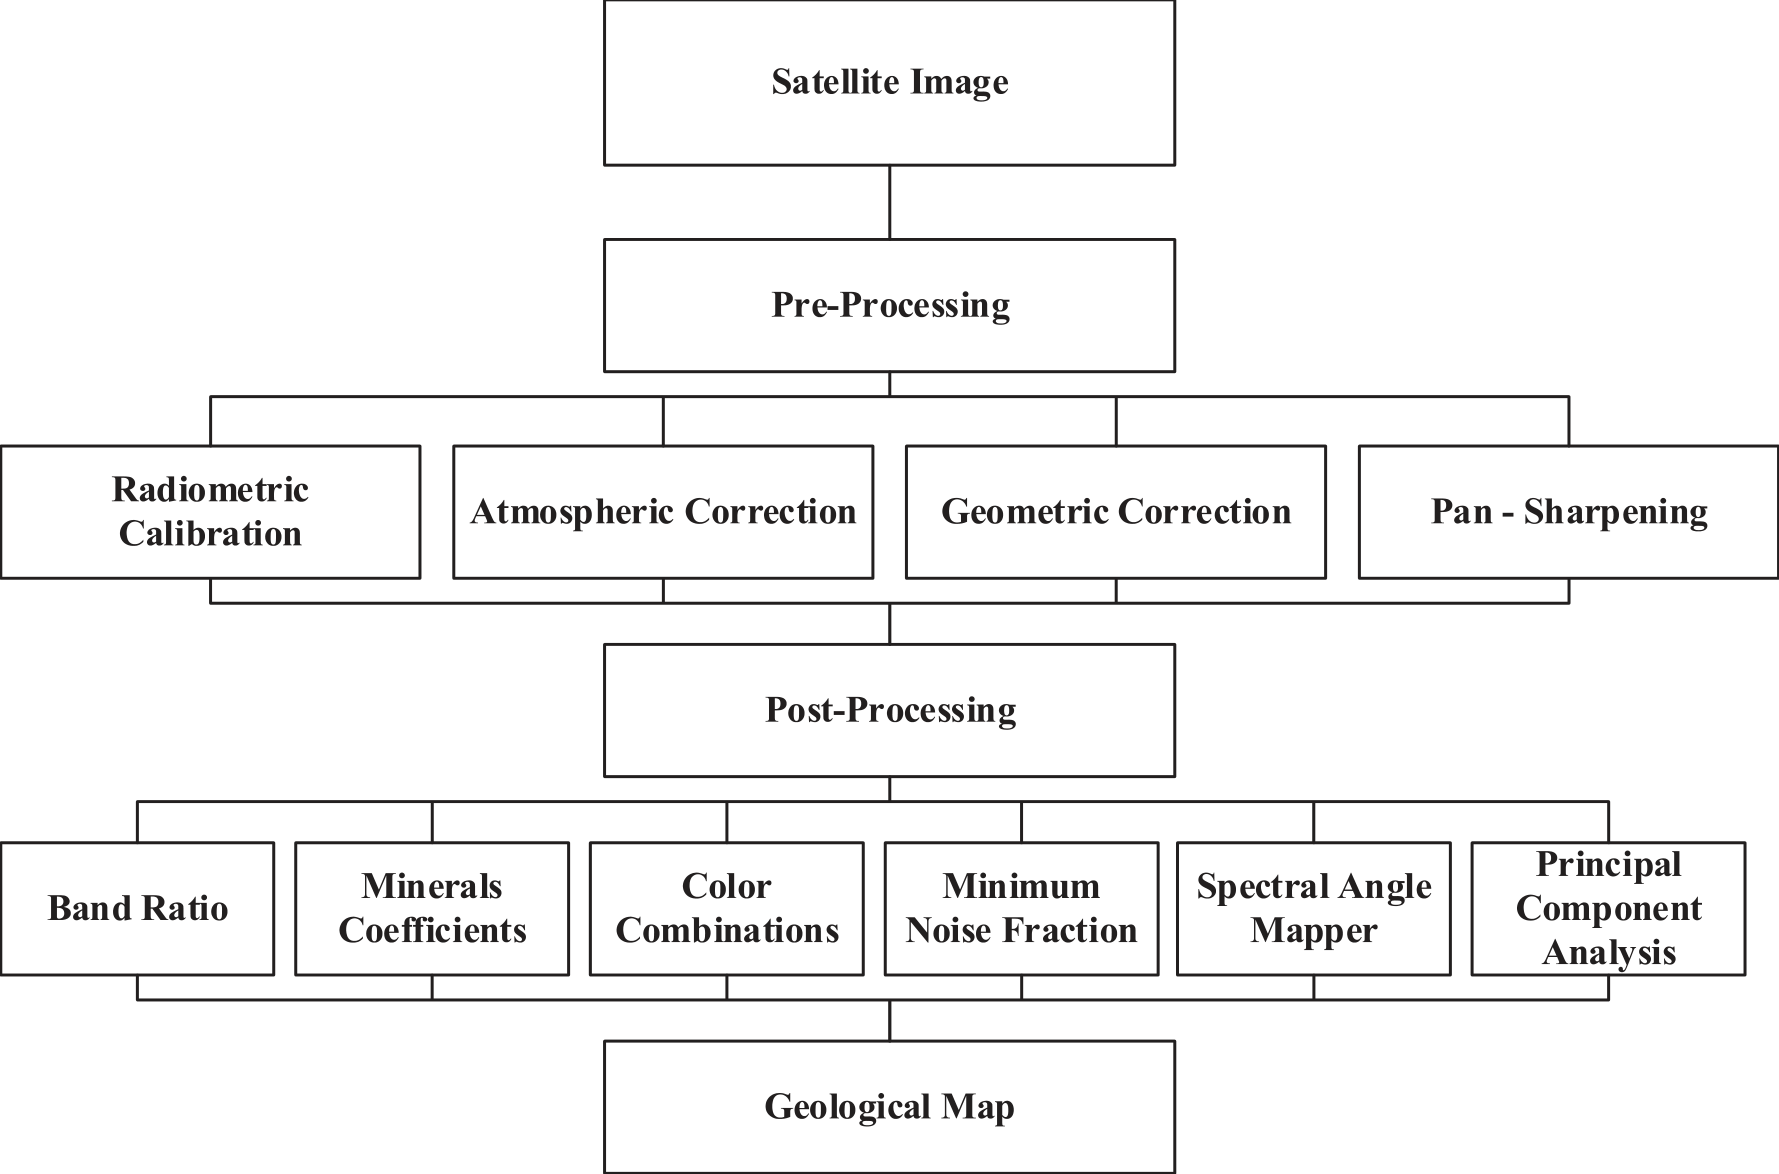
Table 1.
Landsat 8 Principal Component Analysis (PCA) correlation.
| Principal Correlations | Band 2 | Band 3 | Band 4 | Band 5 | Band 6 | Band 7 |
|---|---|---|---|---|---|---|
| PC1 | 1.00 | |||||
| PC2 | 0.97 | 1.00 | ||||
| PC3 | 0.91 | 0.94 | 1.00 | |||
| PC4 | 0.89 | 0.95 | 0.95 | 1.00 | ||
| PC5 | 0.90 | 0.96 | 0.93 | 0.99 | 1.00 | |
| PC6 | 0.96 | 0.87 | 0.81 | 0.75 | 0.77 | 1.00 |
Table 2.
Assigned and Normalized score for all factors.
Geology
The geological map is established using the satellite imagery [27] based upon the different bands, there are many methods and processes for this. Fig. 5 shows the detailed flow chart for geology map. The studies have shown that the remote sensing, geostatistics, and radar imagery are important in water-resource monitoring [28, 29]. Different processes are adopted in developing the geological map in which radiometric calibration refers to the procedure by which satellite imaging systems digital readings are transformed into actual readings of reflectance. To do this, sensors or other devices are used to measure the brightness or reflectance of features on the ground to serve as a reference point against which satellite data can be evaluated [30]. Atmospheric Correction is the method used to enhance the reliability of satellite data by eliminating the impacts of atmospheric interference on the images. To do this, the digital data picked up by the satellite sensors and subtracting the effect of the atmosphere [31]. Geometric correction aligns satellite photos with a known coordinate system requires performing geometric correction, which is the act of correcting geometric distortions in the photographs. To better discover and interpret features in Landsat 8 imagery for geological mapping, PCA is a valuable technique in satellite image processing [32]. The data used for different bands for geology map is tabulated in Table 1.
Thematic Layer Handling
Classifications of all thematic layers are shown in Table 2. The GIS was used to input all variables into a predictive model. Pairwise comparison ratings provided by several expert groups with in-depth knowledge and expertise in controlling surface runoff, soil erosion, sediment transport, and flood hazards were used to determine the final weights. Each category was given a score that reflected its relative importance in determining flood risk. S values from 1 to 5 were used, with lower values indicating less flood risk and higher values indicating higher flood risk. Table 4 also includes tally marks for each class of thematic layers.
Multicriteria Decision Analysis Technique for Suitable Locations
Analytical hierarchy process (AHP) [33, 34] is one of multicriteria decision analysis (MCDM) technique that is commonly employed because it simplifies difficult decisions by breaking them down into a series of pairwise comparisons. To begin an AHP analysis, one must first create a decision hierarchy that considers the decision’s objective, criteria, and available choices [35]. The next step is to make a pairwise comparison matrix of the choice criteria [36, 37] to figure out how important each factor is. Table 3 [38] uses a 1-5 scale to show how much more dominant one element is over another with a specific quality. A pairwise comparison matrix is developed in which aij = 1 and aij = 1/ai. The right eigenvector, which is determined by the maximum absolute eigenvalue (λmax, 1, 2), is used to determine the weight of the ranking criterion and the subcriteria that result from it. The principal eigen value (λ) was estimated by using the eigen vector technique as given by Eq. (1) and (2) [39].
Fig. 7.
a) Drainage density map of the study area b) area (km2) under different classes c) area (%) under different classes.
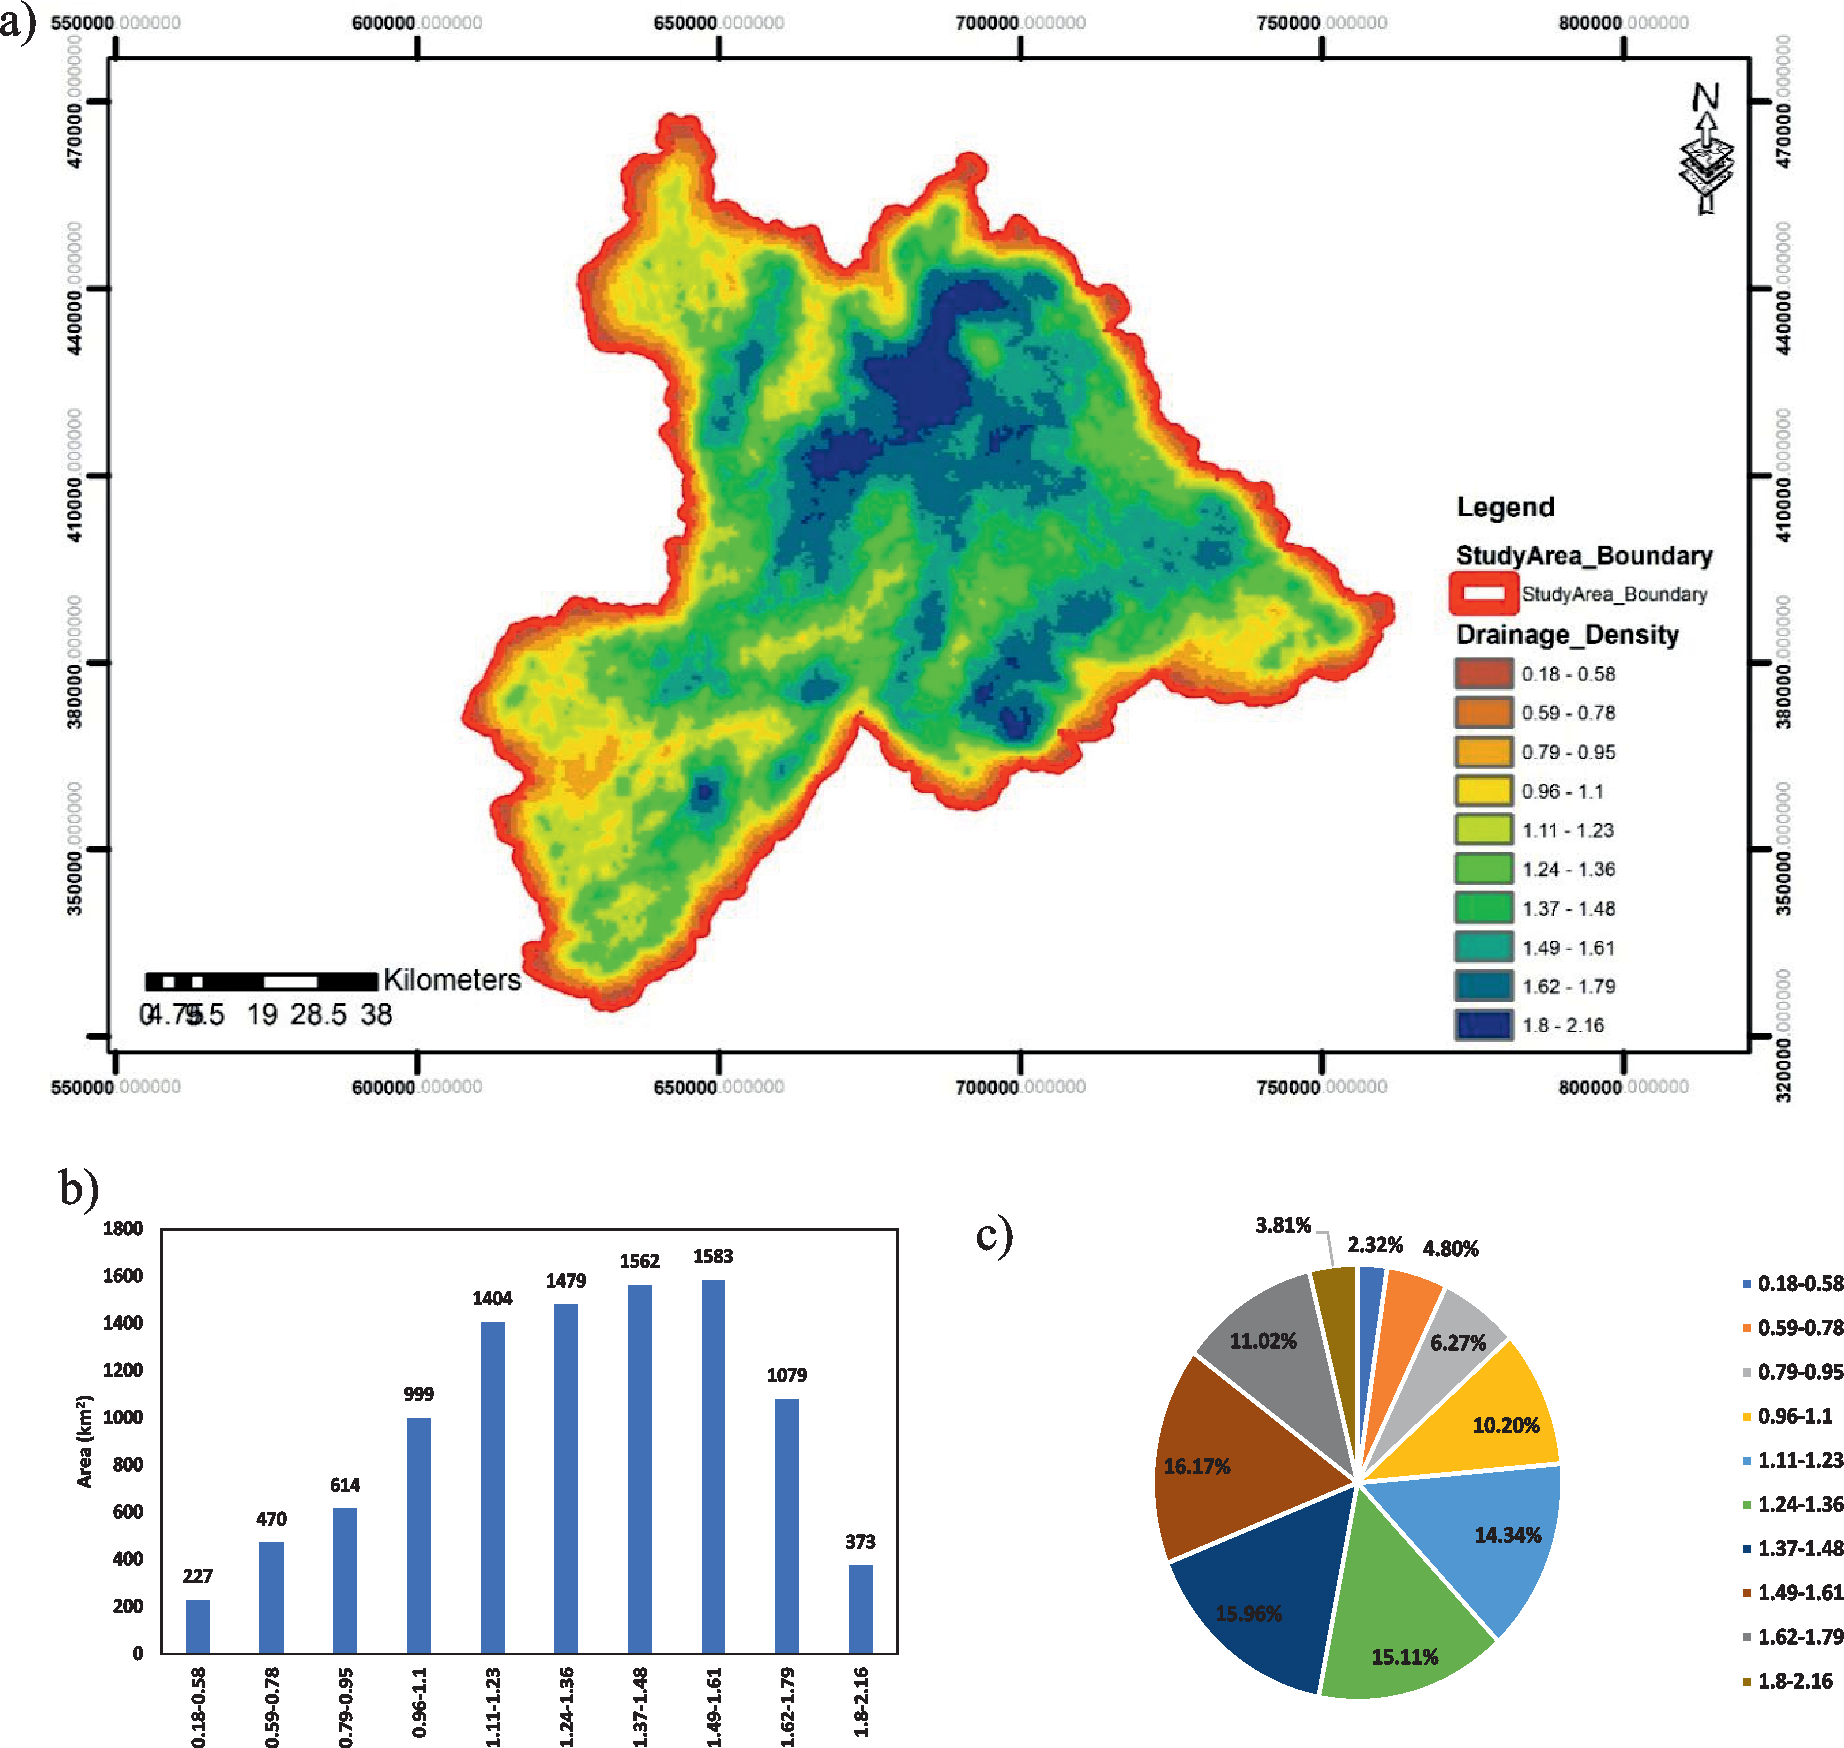
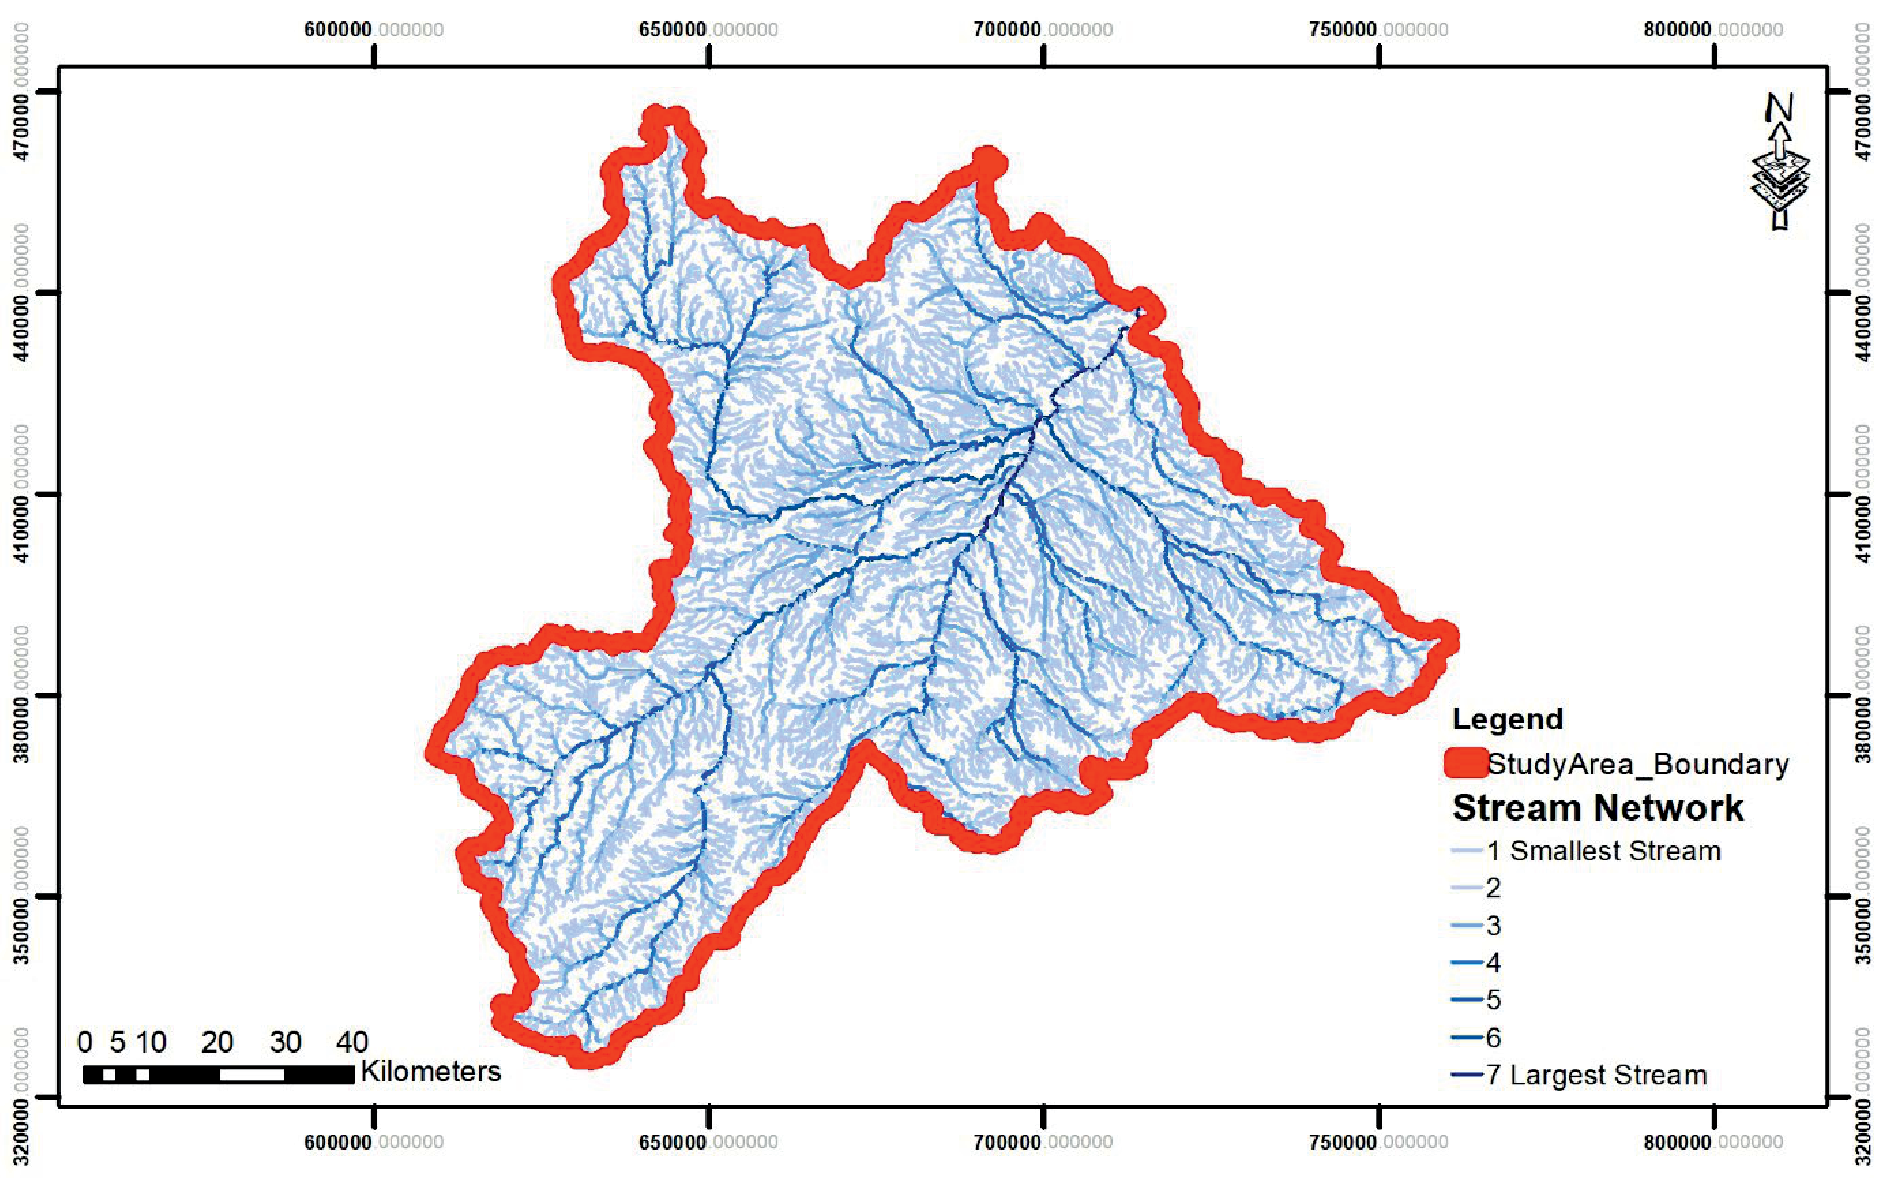
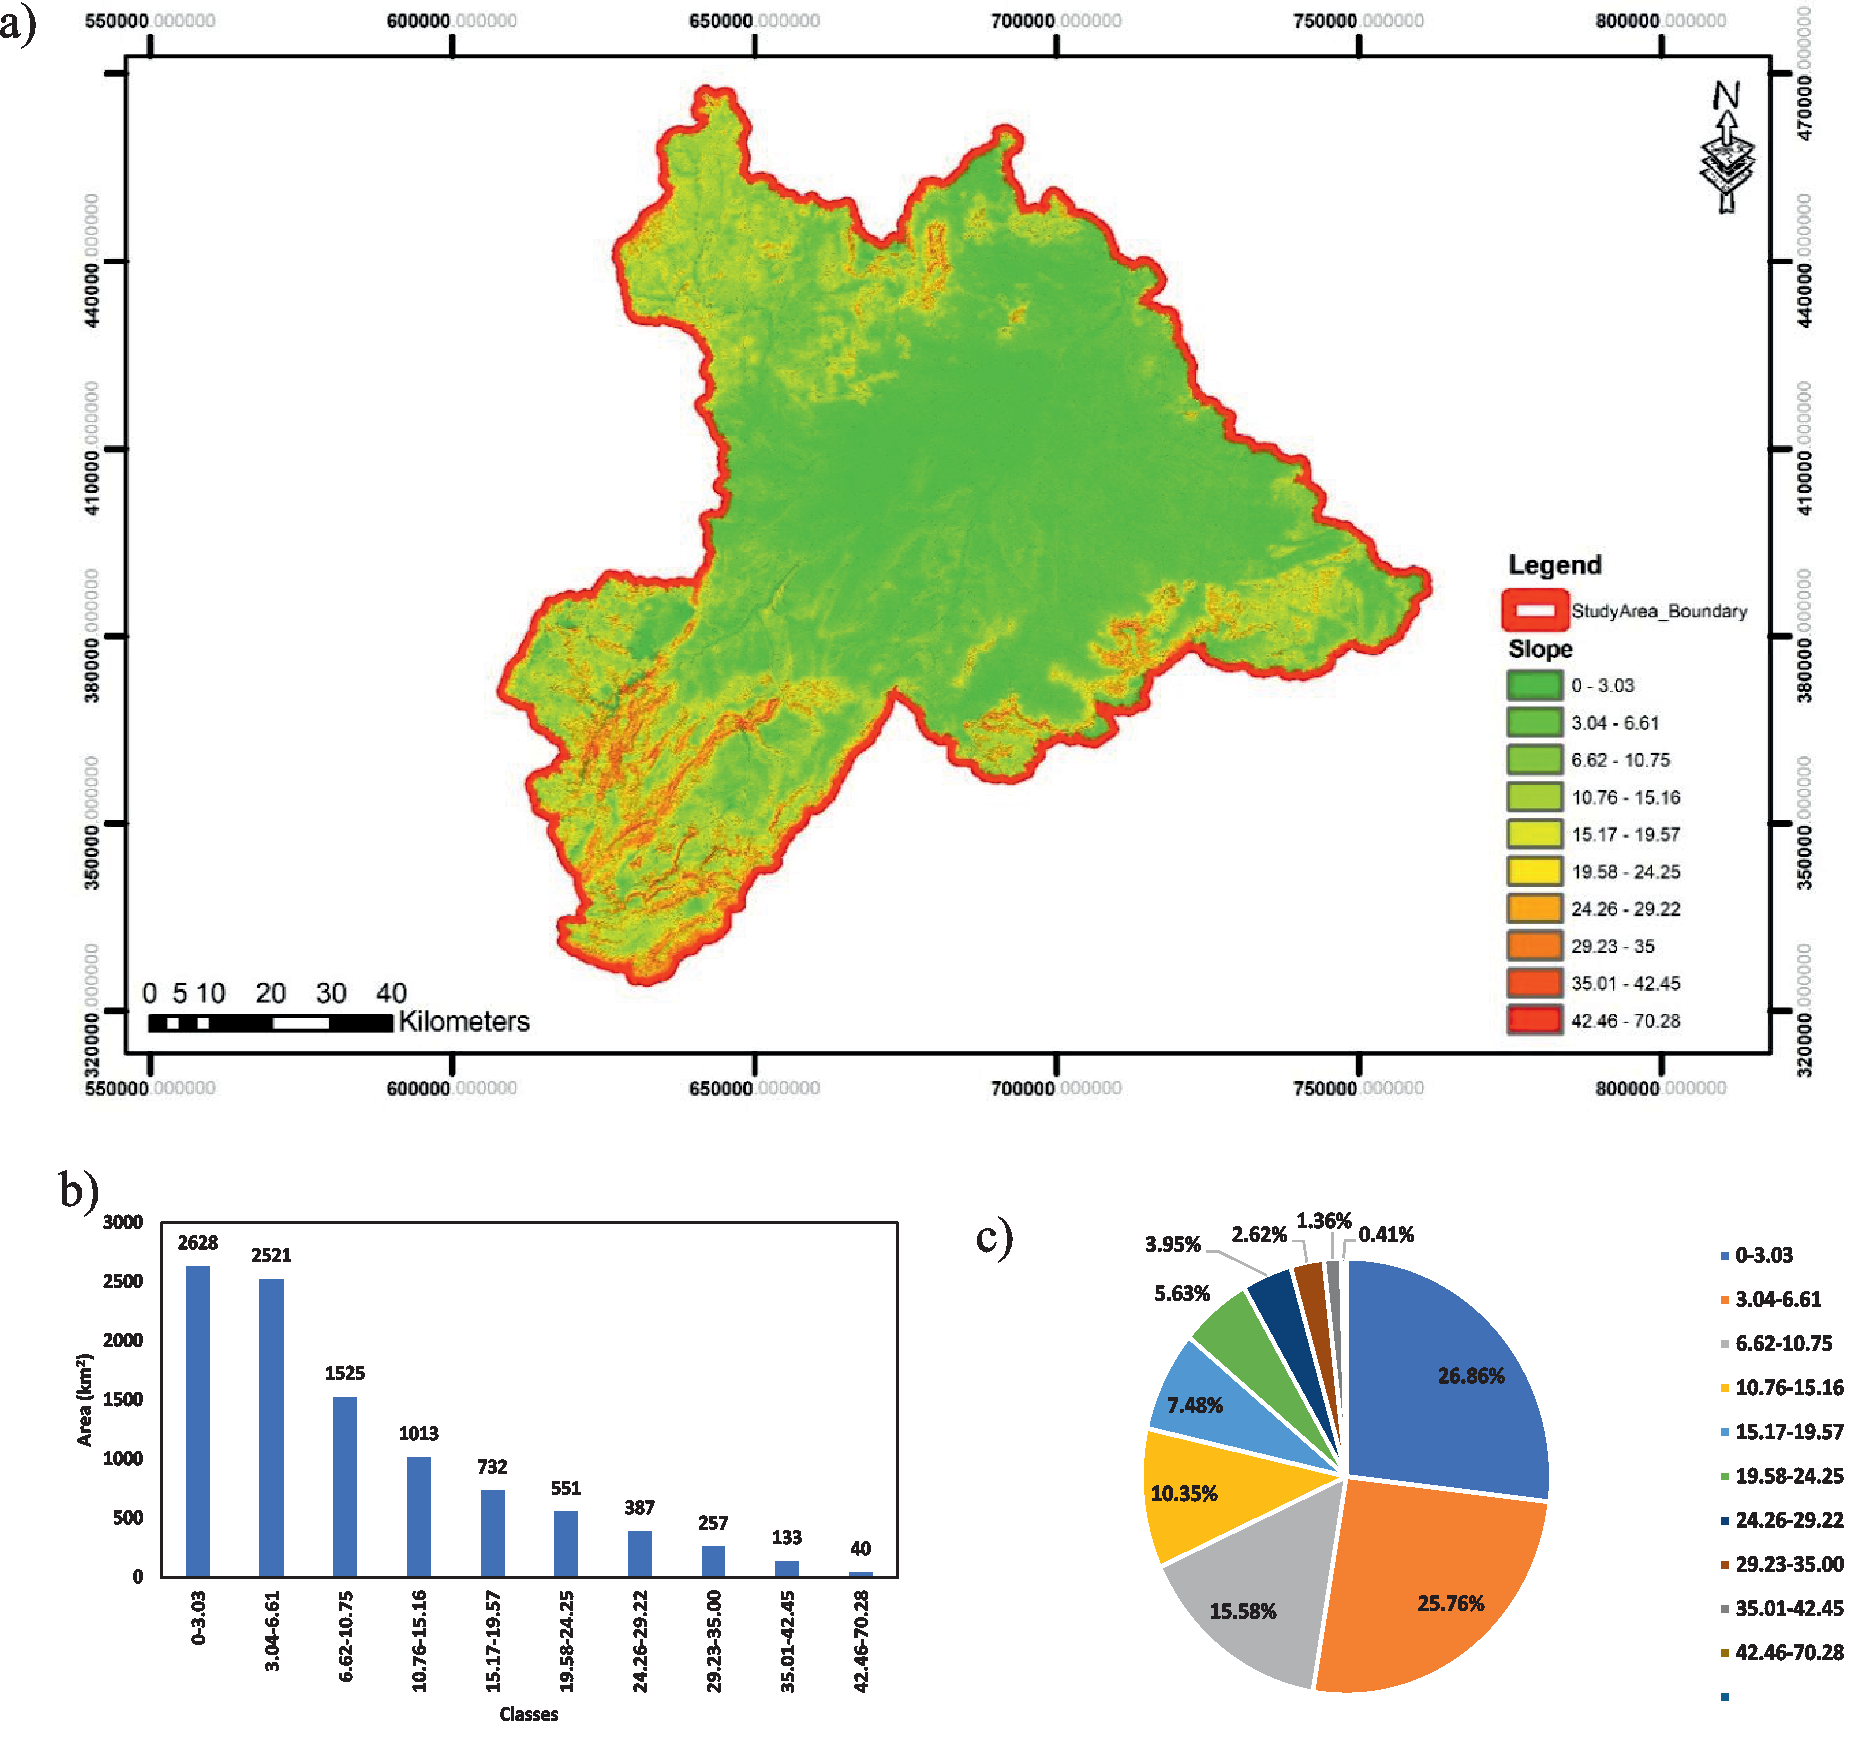
Fig. 9.
a) Slope map of the study area b) area (km2) under different classes c) area (%) under different classes.
of λmax and wi(i = 1, 2, ..., n) is the weight value for ranking. In this research λmax = 0.621 which is used for estimating the consistency index (CI) for the consistency of the judgement matrix by Eq. (3) [40]:
where CI is the consistency index, λmax is the maximum eigenvalue of the judgement matrix and n is the order of the matrix [39]. Based upon the intensity of importance of each parameter over the other parameter, weighted overlay analysis was performed, and consistency ratio (CR) was estimated by Eq. (4).
where CI is consistency index of the matrix developed by experts and RI is consistency index of random matrix. The judgment matrix is considered to be adequately consistent if the corresponding CR is less than 10% [41]. The consistency ratio (CR) was calculated (-0.69) which was used to measure how consistent the judgments as compared to random judgments. The final prediction of suitable sites for groundwater potential zones were carried out based on the Weighted Linear Combination (WLC) method. Delineation of groundwater potential zones is applied as given by Eq.
where wtL represents the normalized weight of a thematic layer and Xf represents the rank value of each class, m represents the total thematic layers and n represents the total number of classes. The final map was distributed into five classes of resulting suitability (poor, fair, moderate, good, and excellent) based on equal result intervals. By using the weighted overlay and assigning the weightage to all the parameters, the resultant maps are developed.
Results and Discussion
Criteria Weights and Groundwater Flow
By using the scale, weights are assigned to the criteria (geomorphological and topo-hydrological factors) based upon their importance on location of dam selection. The criteria weights are tabulated in Table 2.
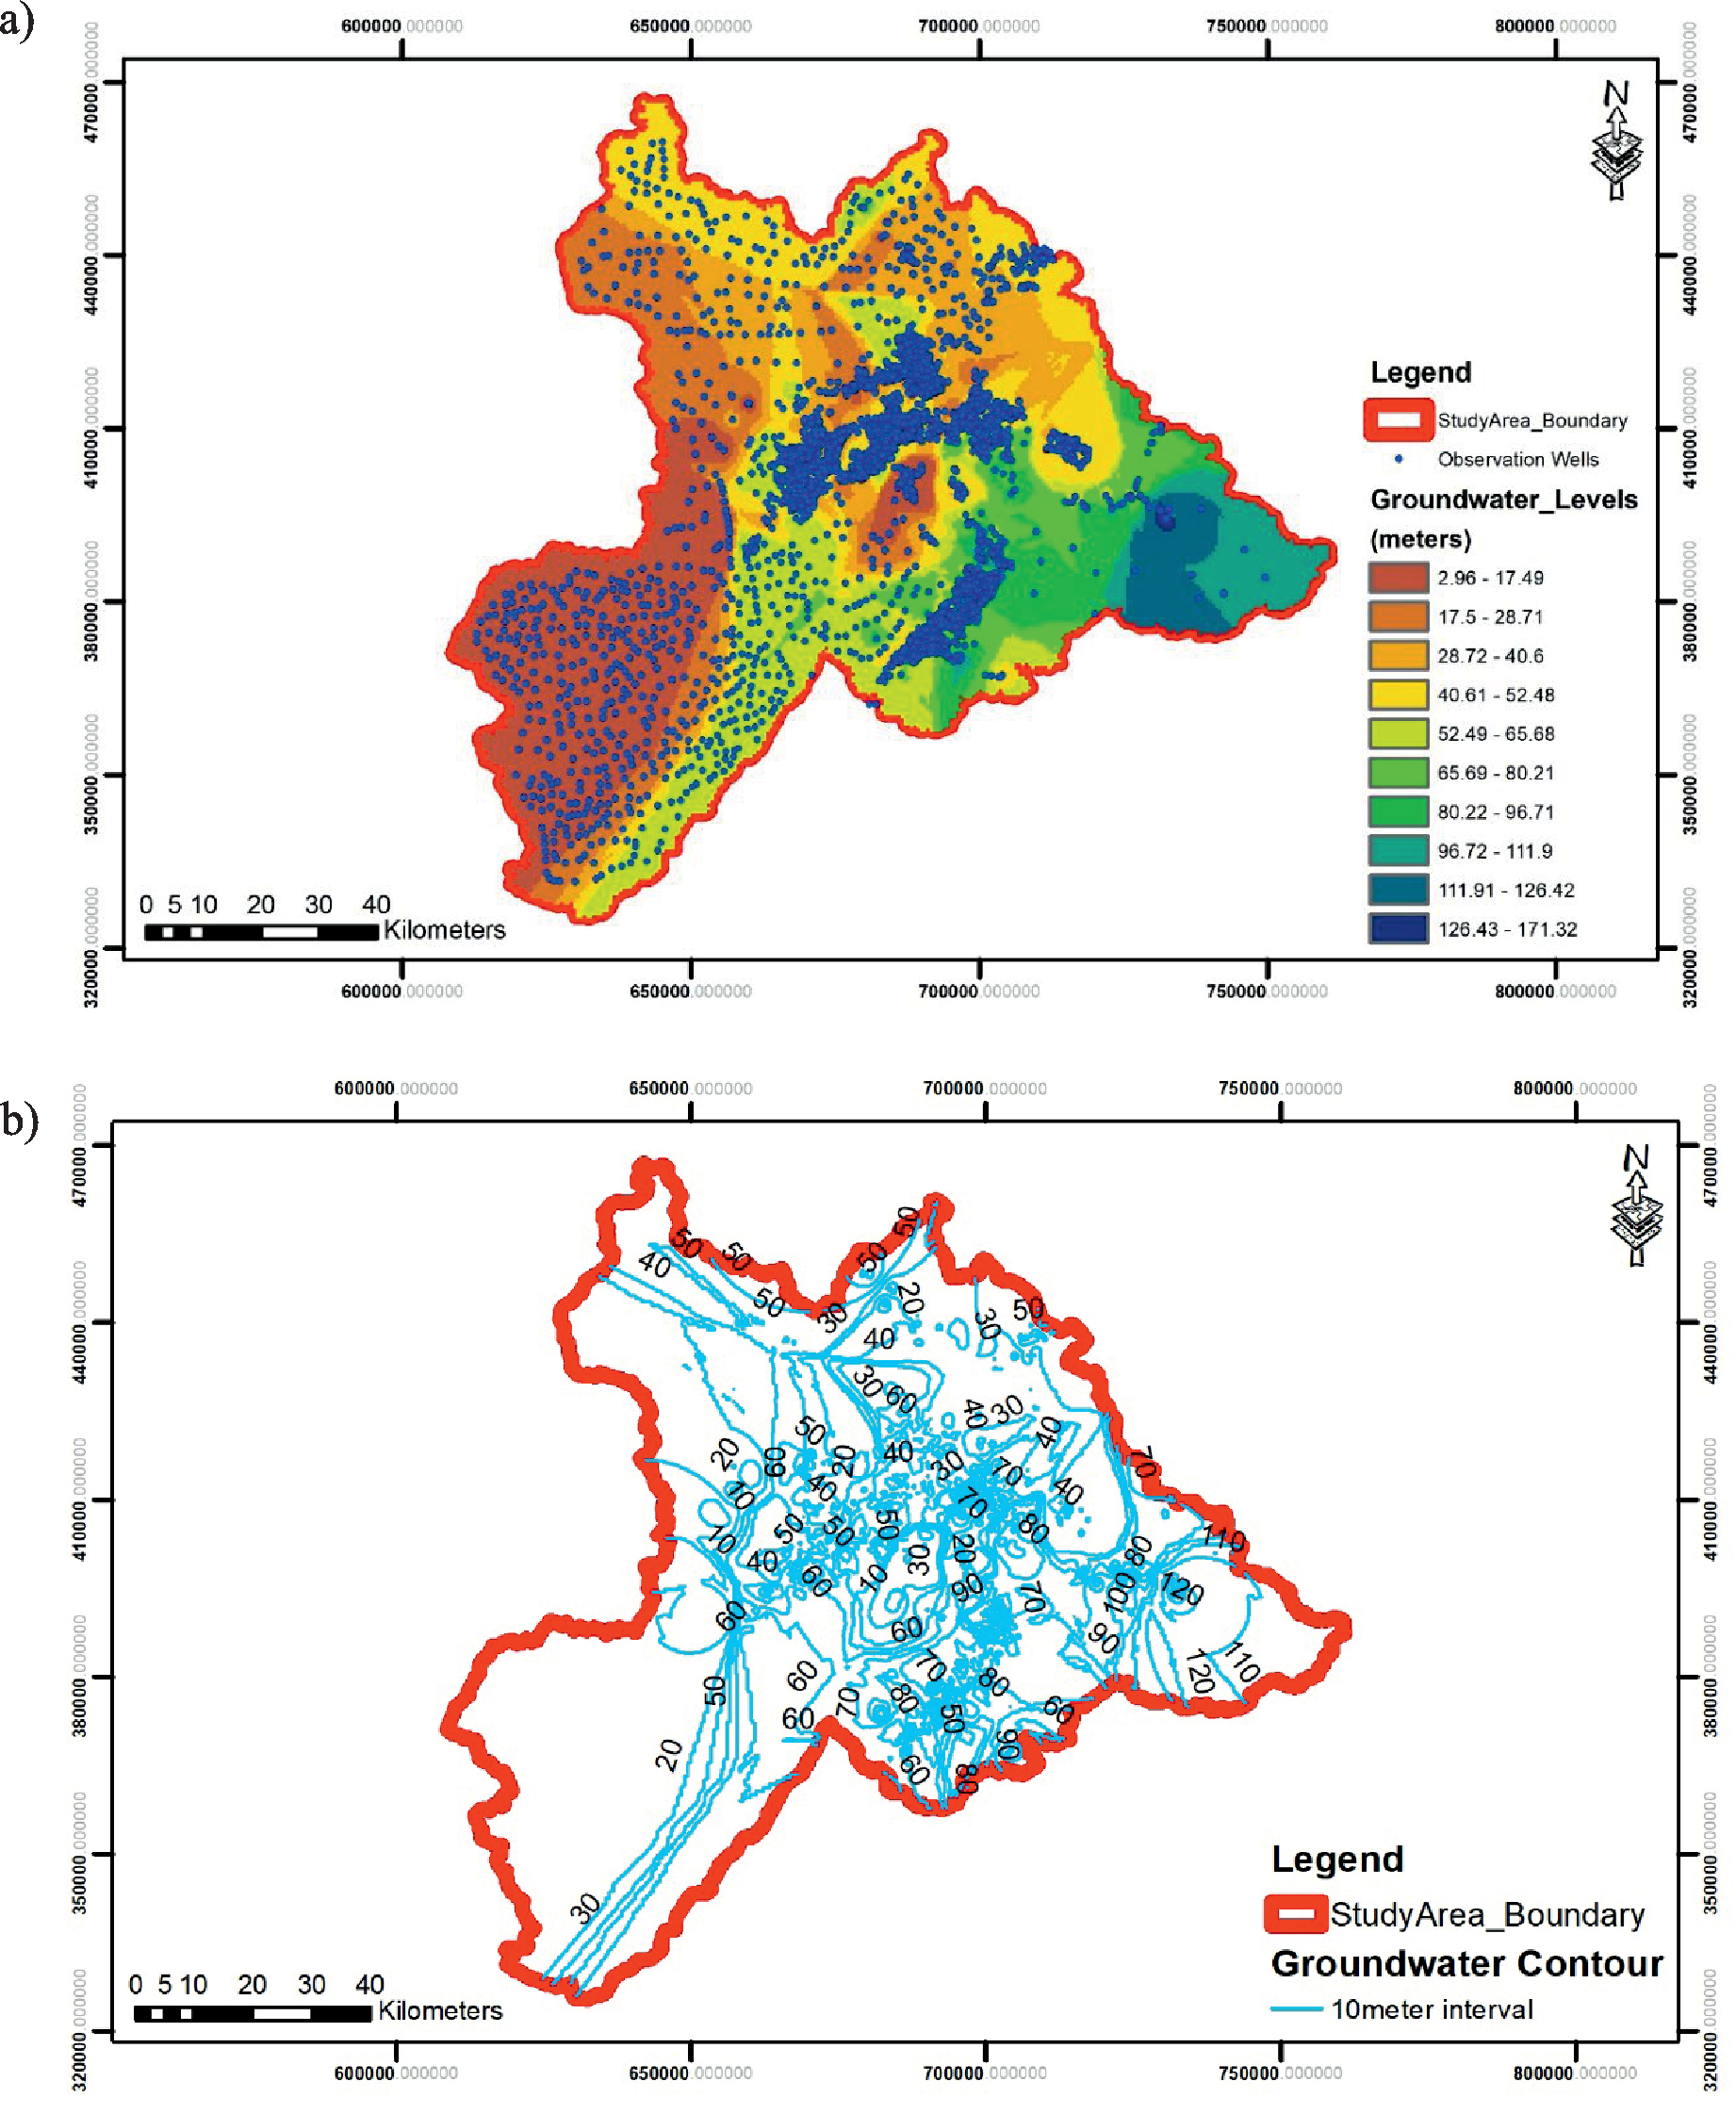
The dynamics of aquifers can be explained by the underground structure of these aquifers. Therefore, the interpretation of the piezometric map gives an idea of the hydrodynamics of the aquifer and the direction of groundwater flow. The hydrogeological aspect of the water table in the Guercif basin was understood with the help of the development and interpretations of the piezometric map [43]. In this research, the piezometric map shows the general flow of the phreatic aquifer which occurs from northeast to southwest towards drainage axes formed by major watercourses. A change in the groundwater levels is shown in Fig. 6 which shows that the eastern region has higher groundwater levels and southwest has lower groundwater levels as compared to rest of the area.
Drainage Density and Stream Network
Drainage density map represents the spacing of the water flowing body (channels) per unit area. Other parameters like runoff, permeability, and other related characteristics are obtained from the drainage density map. It also tells the homogeneity and heterogeneity of the aquifer. Due to higher drainage density, the infiltration rate decreases which tends to poor zones of the groundwater potentials while the low values of drainage density represent the excellent groundwater potential zones. Runoff is always important in such studies, thereby, due to both rivers in the study area, runoff generates increases the drainage density incorporating the low groundwater potential zones. In this research, low values of drainage density were found to be between 0.18 and 1.1 (2310 km2), suggesting that this region helps to sustain the good to excellent groundwater potential zones. A drainage density along with different characteristics is shown in Fig. 7.
A stream network is generated for the study area as shown in Fig. 8, which show that the water flows from the north-east side of the study area towards south-west region. Due to high trend of the stream order at the north-eastern side, the drainage density values decrease which is decreasing the capability of the groundwater potential zones.
Slope and Land-Use Land-Cover Map
Slope is an important parameter for checking the groundwater potential zones, usually a flat and straight slope of an area has high infiltration rate and low runoff potential which tends to the increase in the groundwater recharge while if the slope increases then the runoff also increases (ignoring the landuse pattern) which tends to decreases infiltration rate and decrease in groundwater recharge potential. Slope is distributed into different categories, usually a moderate slope ranges from 0o to 10o, steep slope is greater than 20o. Based on this study’s findings, a region of 6674 km2 with a moderate slope has a higher groundwater potential than another area with a slope of up to 70.28o. A slope map along with different characteristics is shown in Fig. 9.
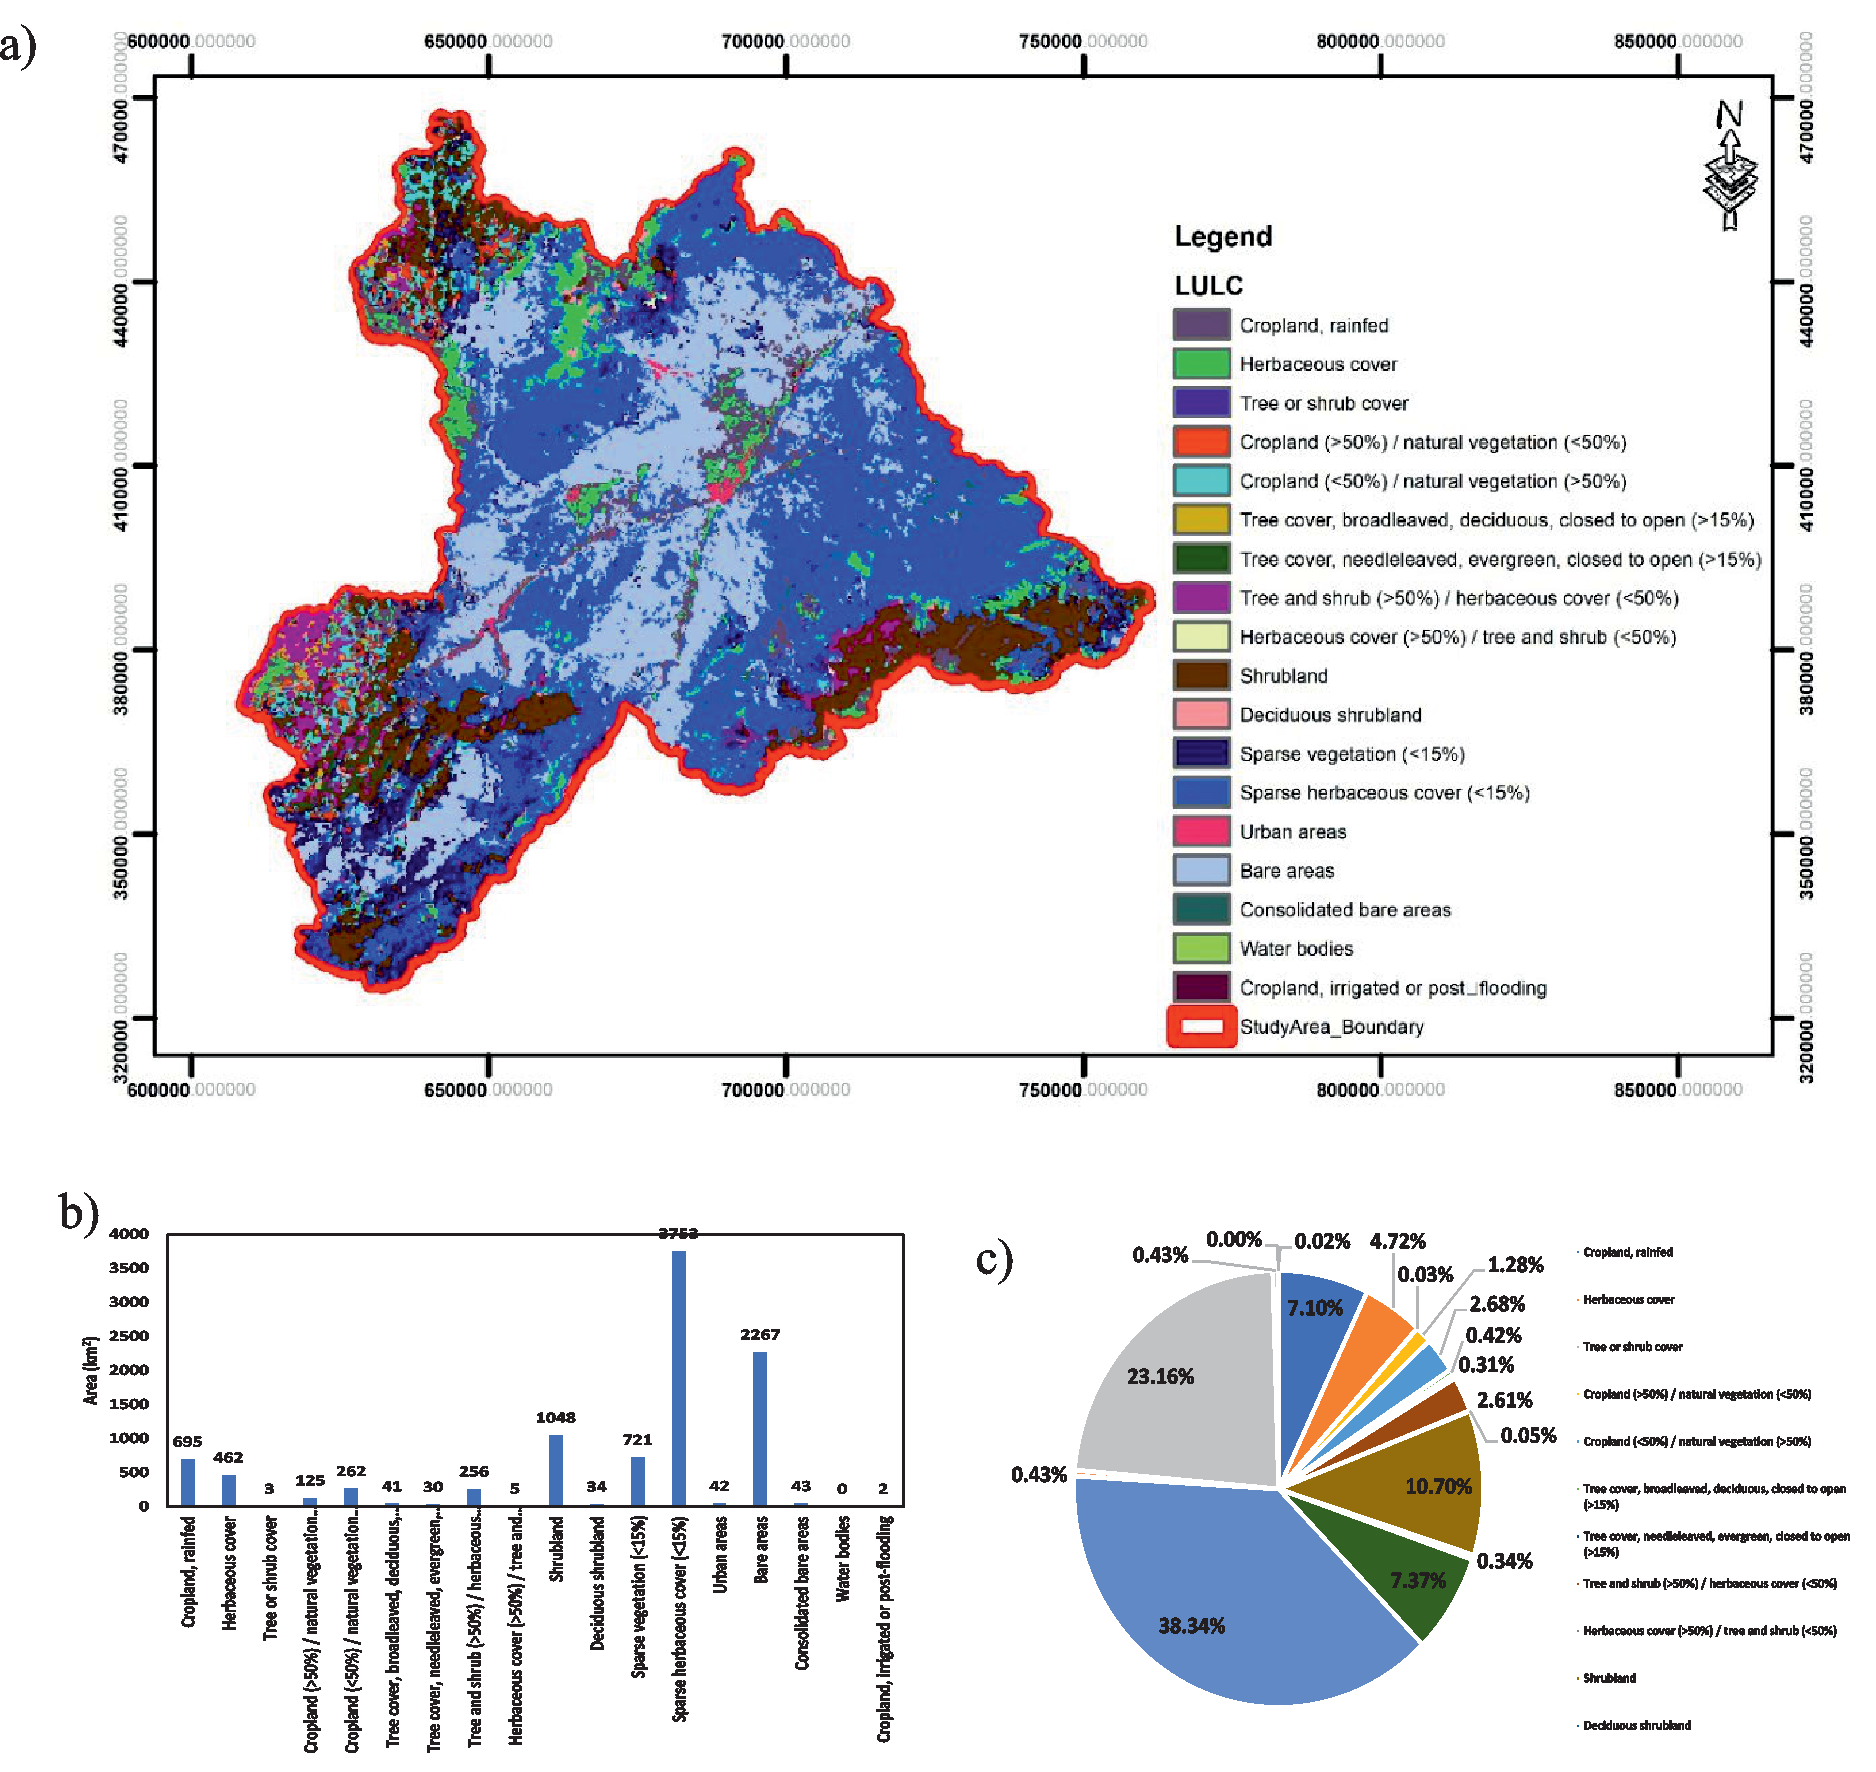
Land use landcover maps are highly related to the groundwater potential and runoff potential. Residential, urban areas tend to the higher runoff potential and lower infiltration rate due to high values of their curve numbers. While cropland, grassland, pastures have higher infiltration rate which is largely contributing towards the groundwater potential zones. Approximately 38.34% of the study area is covered by a sparse herbaceous cover, having an area of 3,753km2 in Guercif watershed. Total tree covers, including all ranges, are 2491km2 (25%), while cropland is 695km2 (7%). Results also show that there are areas with high groundwater potential, some of which are exceptional. A land use landcover map along with different characteristics is shown in Fig. 10.
Geology and Groundwater Potential Zones
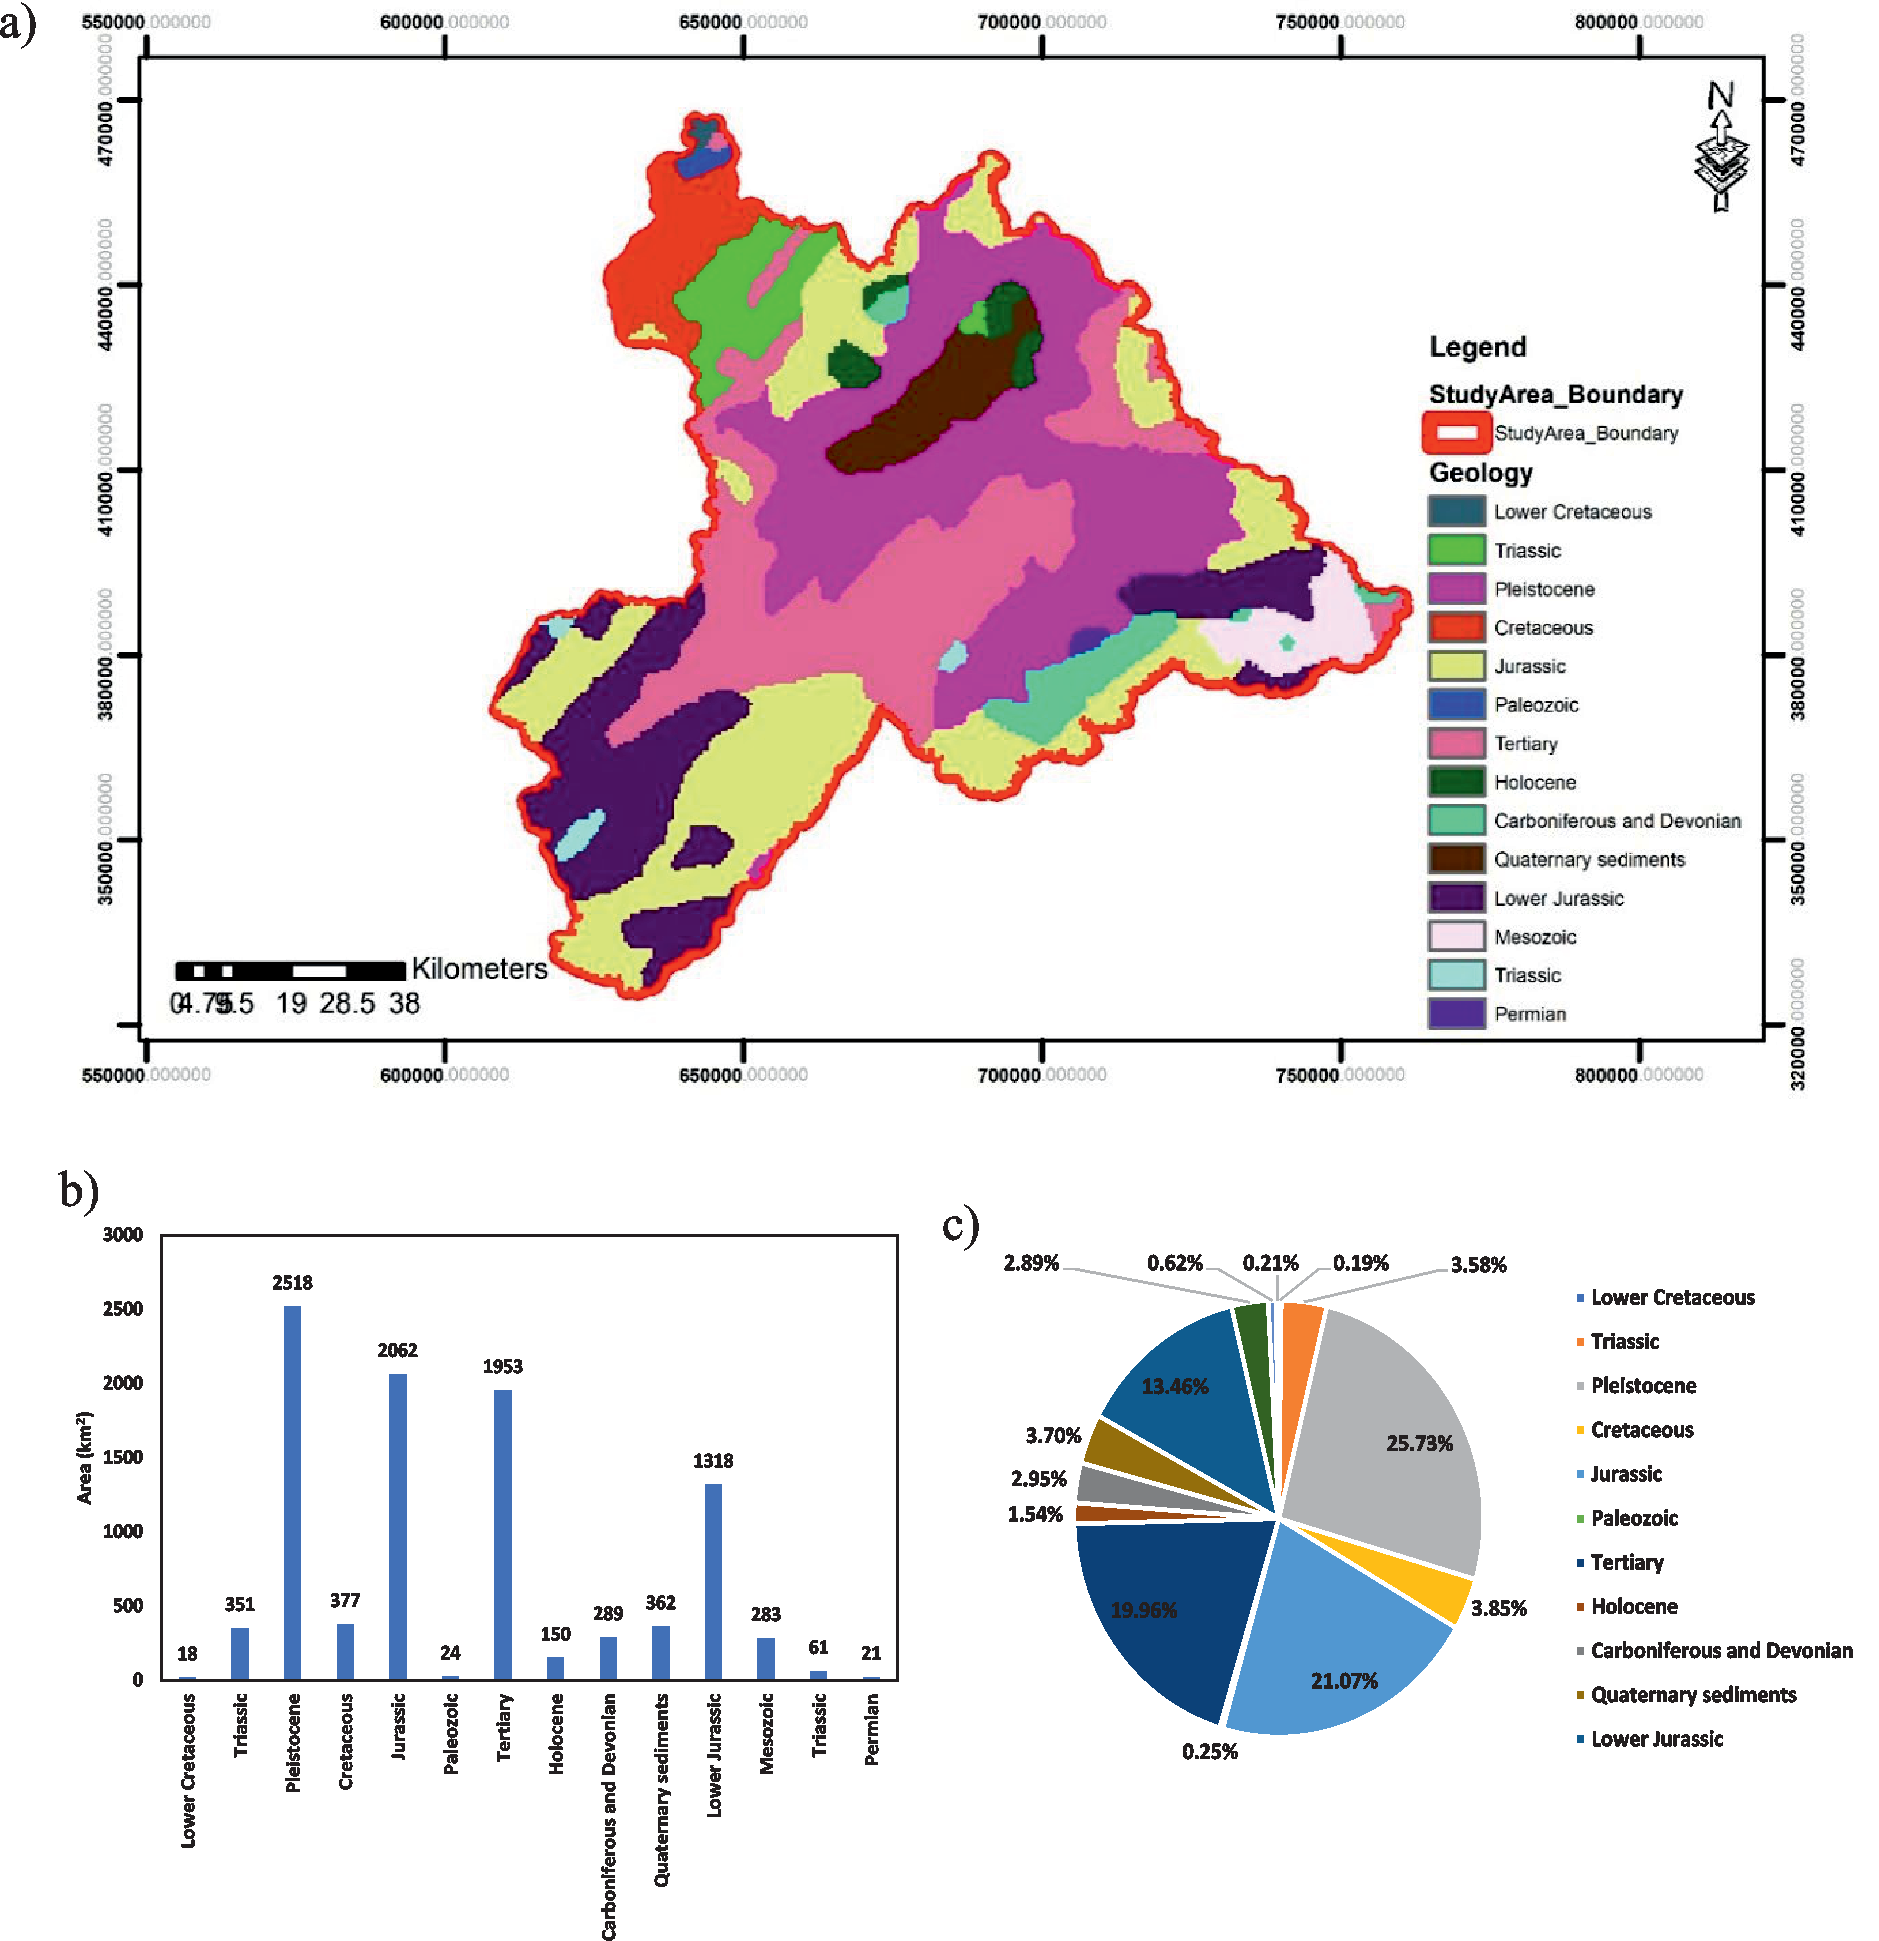
Geology of an area is highly representing the landform, its lithology and rock structure which in turn contributing an important factor towards the groundwater potential zone. This study area is dominating in Piestocene, Jurasic, Lower Jurasic and tertiary rocks. This is total covering an area of 7851km2 (80%). A geology map along with different characteristics is shown in Fig. 11.
Fig. 12.
a) Groundwater Potential Zones in the study area b) area (km2) under different classes c) area (%) under different classes.
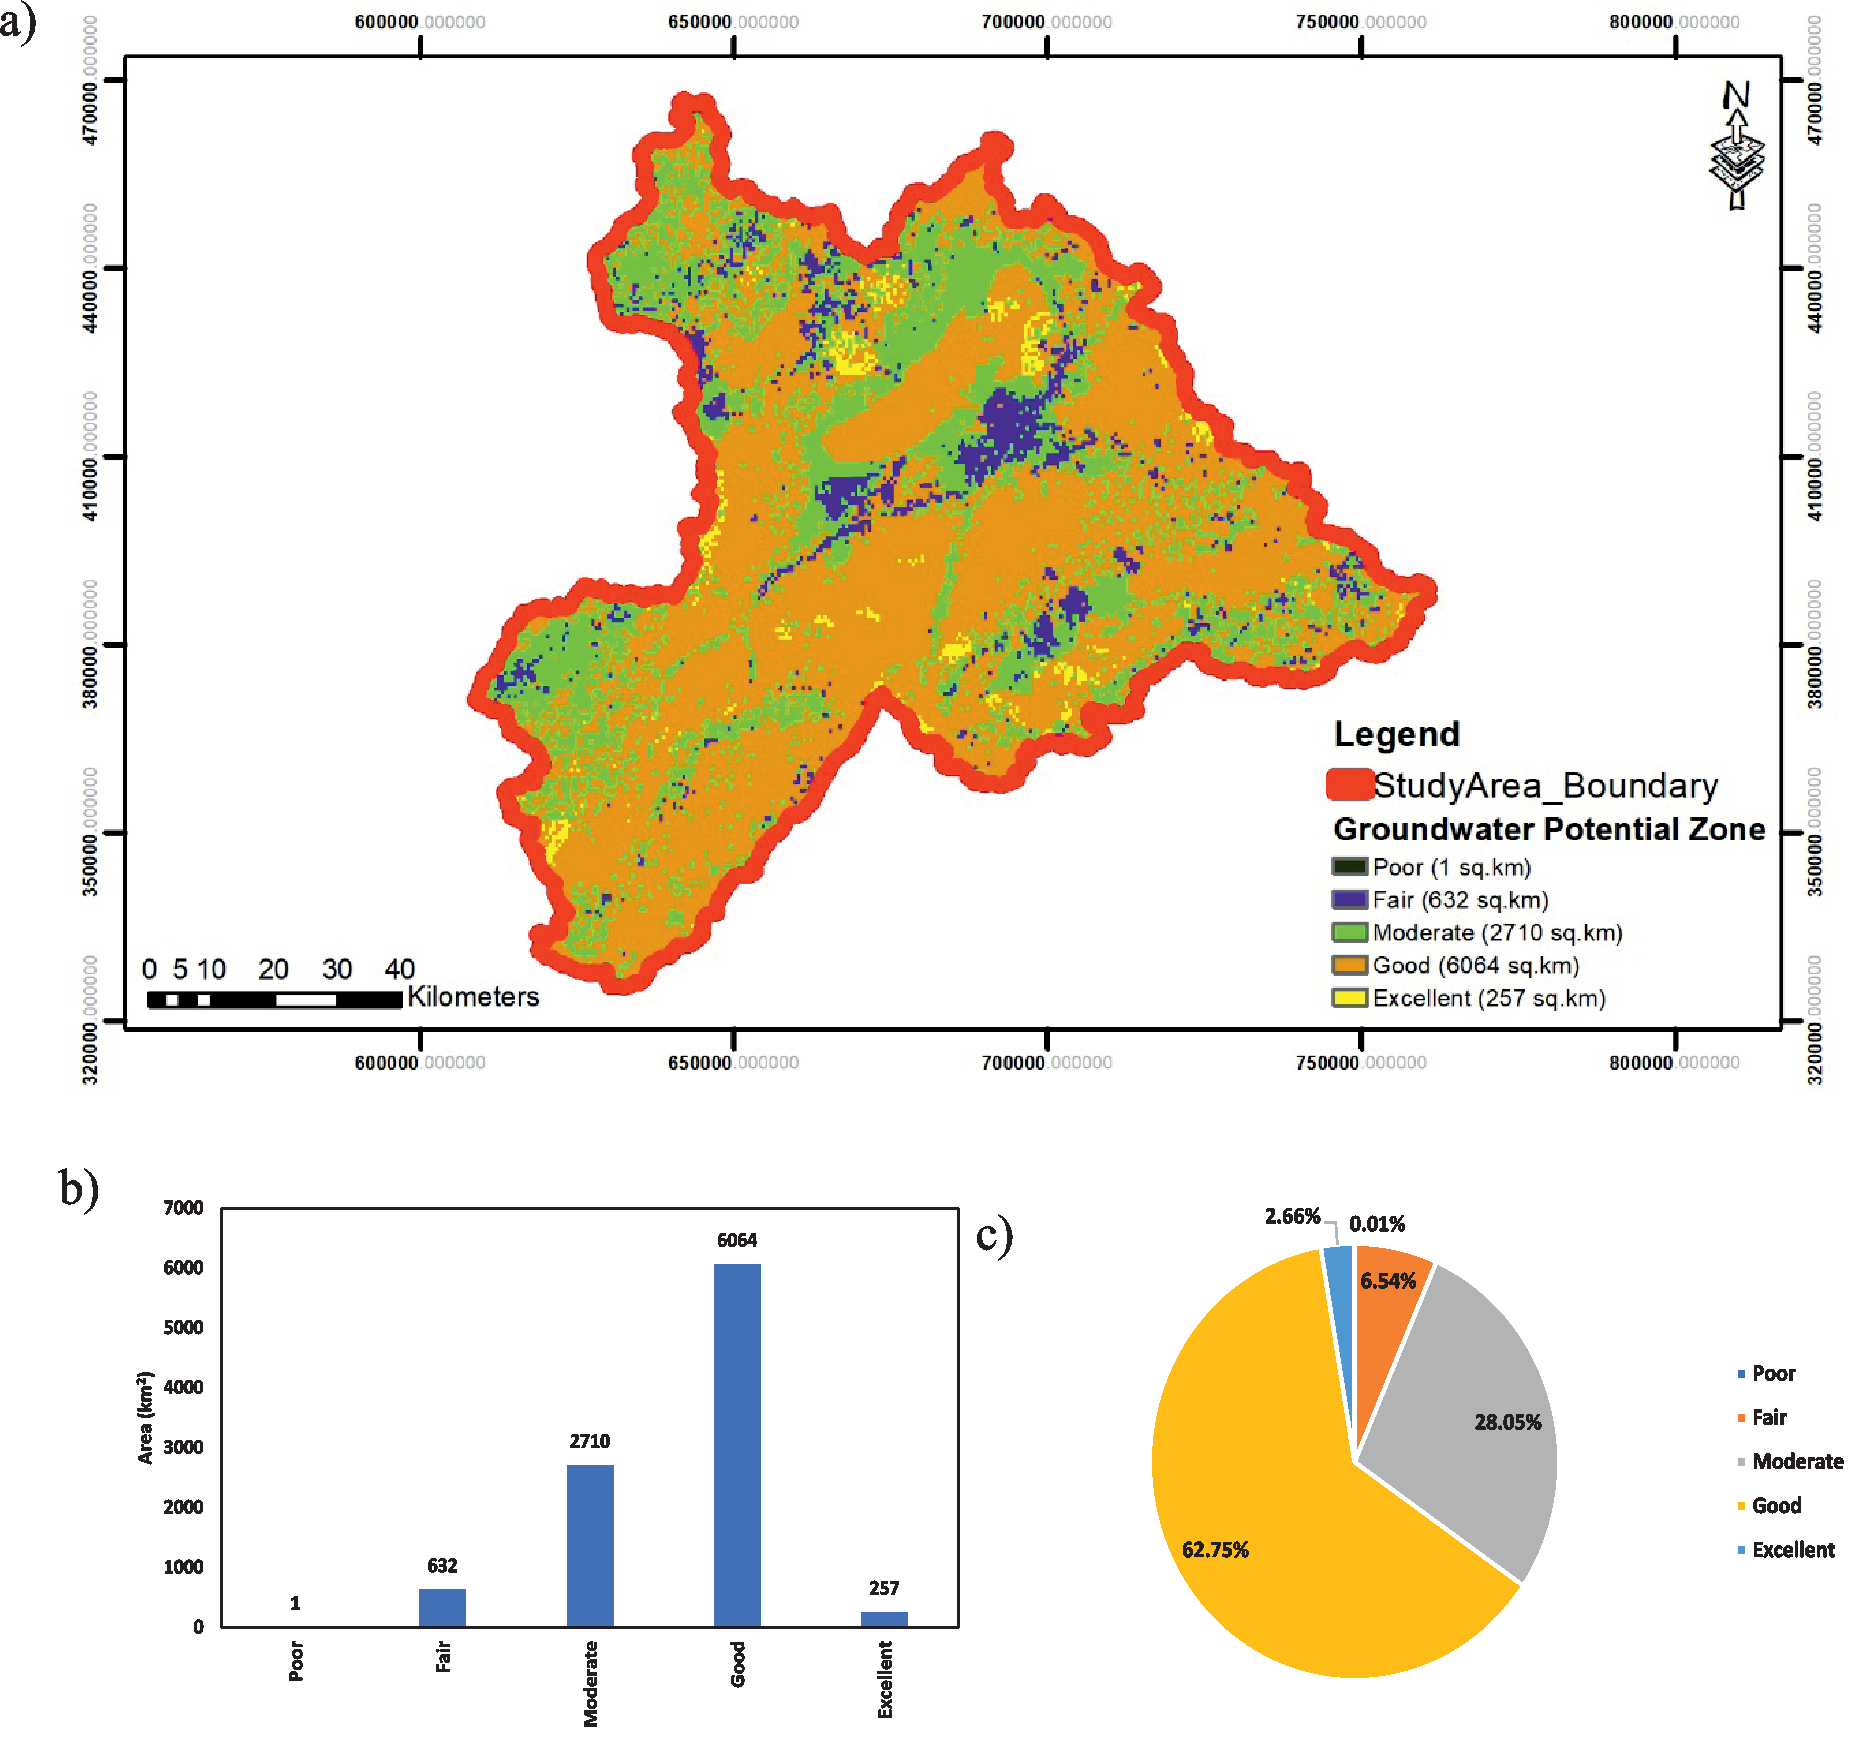
All the layers are overlayed in the ArcGIS by using the Weighted overlay a spatial analyst tool according to a scale 1 = Poor, 2 = Fair, 3 = Moderate, 4 = Good and 5 = Excellent zones of groundwater potential. According to the findings, the area with the lowest potential is only 1 km2 (0.01%), while the area with fair and moderate potential is 632 km2 (6.54%) and 2710 km2 (28.05%) respectively, the area with good potential is 6064 km2 (62.75%), and the area with excellent potential is 257 km2 (2.66%). Fair and moderate areas predominate in the area around the rivers, whereas the study area’s boundary is largely comprised of good territory. The potential to yield usable groundwater is in the good quality zone in study area. Artificial recharge in groundwater potential zones helps to provide a sustainable and consistent supply of high-quality groundwater for varied uses, especially during drought or high demand due to an increase in the amount of water stored. The excellent potential zone is less as compared to good potential zone. Groundwater potential zones mapping, and its characteristics is shown in Fig. 12.
Conclusions
A sustainable groundwater management has a keen role in promoting the economy of an country by improving the agricultural areas, providing the drinking water supply to the population and increasing the per capital water availability. In the Guercif, groundwater is abruptly used which requires a proper management for its survival. Since due to excessive pumping, the groundwater level is decreasing, so in this research, its recharge potential areas are estimated by using the multi criteria decision making analysis system in ArcGIS. Due to low values of the drainage density are approximately 2310 km2 which are contributing towards better groundwater potential zones. Due to moderate slope of 6674 km2 area represents the better groundwater potential zone. Due to dominancy of sparse herbaceous cover i.e., 3753 km2, cropland 695 km2, tree covers 2491 km2, groundwater potential zones are good. The overall results showed that more than 62.75% of the area is good for the groundwater potential zone with only 1 km2 of poor zone. This integrated remote sensing an GIS approach is time reducing and cost effective in estimating the groundwater potential zones. This research also concluded that the errors due to conventional methods for determining the zones can also be removed by using the remote sensing technique.

