

Introduction
In the civil aviation safety system, the airport runway safety is extremely important. The settlement, resulting in runway fracture, will affect the flight safety, and even cause economic losses, casualties. In 2005, Nanjing Lukou Airport was temporarily closed for nearly 3 hours due to the damage of the runway pavement, which 18 flights were directly or indirectly delayed and 12 incoming flights were unable to land, causing serious economic losses and huge security risks. With the promotion of the national strategy of “smart civil aviation” and “powerful civil aviation” in the new era, the construction of airports is gradually expanding from plain and hilly areas to plateau and mountainous areas, especially the high mountains and extremely high mountains dominated by the Qinghai-Tibet Plateau and Yunnan-Guizhou Plateau [1]. At the same time, with the continuous improvement of flight technology and flight safety standards, the indexes of airport construction on the plateau are becoming more and more refined, especially the settlement and settlement requirements of the foundation soil of the airport on the high plateau are becoming higher and higher. Therefore, it is very important to study the settlement and settlement law of airport foundation soil for airport construction in plateau area.
At present, soil consolidation theory is used in the study of foundation soil settlement law, and one-dimensional or three-dimensional compression characteristic test of soil is mainly used in laboratory test methods. However, the actual engineering environment of the foundation soil in the actual engineering is obviously much more complicated than the theoretical method and the laboratory test method. Every settlement monitored value in the actual engineering is the comprehensive reaction of the soil by various external factors. It is obviously more practical to analyze the variation rule of the site monitored data in the engineering. According to the actual settlement observation results in the early stage of the project site, not only can the settlement during construction be understood, but also the future development trend of settlement and the final settlement amount can be studied. Pin Zhuang found that [2], on the basis of studying a large number of monitored data of long-term settlement of tunnels, the long-term settlement of the ground accounts for 30%~90% of the total settlement amount under normal circumstances. So it is of great significance to choose a reasonable and effective method to predict the long-term settlement of sub-grade. At present, there are many methods for predicting subgrade settlement at home and abroad, which can be divided into three categories: The first type is settlement calculation method based on consolidation theory. For example, the layered summation method and the finite element method for calculating the final settlement of sub-grade are proposed in combination with the characteristics of various soils [3-6]. The second type is based on the measured data to establish a certain function model to fit the measured settlement, so as to predict the later-settlement according to the curve extrapolation method. Such as hyperbolic method [7], Poisson curve model [8], logarithmic curve model, Asaoka method [9], MMF model [10], and Weibull model [11], Ver-hulst model [12], Gompertz model [13] and other curve fitting methods, the third type is intelligent algorithm, Such as ant colony algorithm [14], neural network algorithm, etc. Due to the complexity of influencing factors and randomness of rock and soil mechanics indexes, the prediction method proposed based on consolidation theory results in a large deviation from the actual monitored values [15-18]. The prediction method of function model proposed based on monitored data has been widely used to predict the post-construction settlement of highway sub-grade and building foundation. However, due to the limited amount of test data, the unclear relationship between various factors, and the heterogeneous, nonlinear and complex engineering geological conditions of rock mass, such a method can be used to predict the post-construction settlement of highway sub-grade and building foundation. It makes it more difficult to fit through establishing complex formulas and numerous data. However, LSTM prediction model has strong applicability to nonlinear problems with uncertain inference rules and complex information processing.
LSTM model can make full use of historical data for prediction research, showing outstanding advantages in nonlinear data with time series and multi-input single-output problem prediction research. It has been applied to water quality [19], landslide [20] and other fields. The foundation settlement is affected by many factors, and the historical monitoring data is large and has strong nonlinear characteristics, which is suitable for the application of LSTM model. However, existing researches mainly use control variable parameter adjustment and grid search algorithm in parameter setting of LSTM model, which has many parameter combination methods, large amount of calculation and long time. For example, Chen Weihang et al. [21] used Akima method to optimize LSTM network super-parameters. Considering the characteristics of foundation settlement, it is limited to use a single LSTM model for settlement prediction, so it can be considered to optimize it [22].
In view of this, it conducted a prediction study on runway foundation settlement based on LSTM model, introduced Genetic Algorithm (GA) to construct a modified LSTM model, selected two experimental sections of foundation of a high-plateau airport in southwest China, and used early site monitored values as training samples. The modified LSTM prediction model and BP neural network model are established for prediction, and the predicted data and the monitored values are compared and analyzed. The research results provide theoretical guidance for subsequent runway design and operation time.
Material and Methods
Overview of High-Plateau Airport Foundation
Overview of Foundation Soil
The high plateau airport studied is located in Kangding area of Sichuan Province. This area belongs to the eastern margin of the Qinghai-Tibet Plateau. Influenced by the uplifting of the continental plate and the down-cutting of the river, the complex land-forms such as high mountains and deep valleys have been formed.
Indoor tests can obtain the mineral composition characteristics of the foundation soil and the basic physical and mechanical properties of the foundation soil when applied to practical engineering, and these characteristics often reflect the post-construction settlement properties of the foundation soil. Therefore, when the prediction of foundation soil settlement is carried out in this paper, the relevant indoor test results are analyzed first.
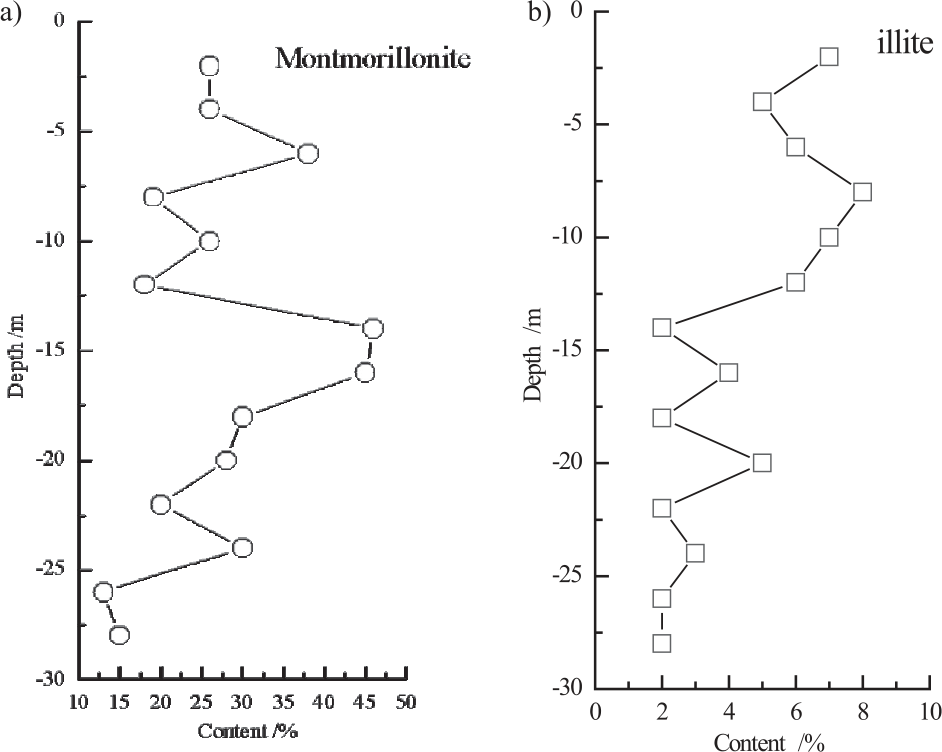
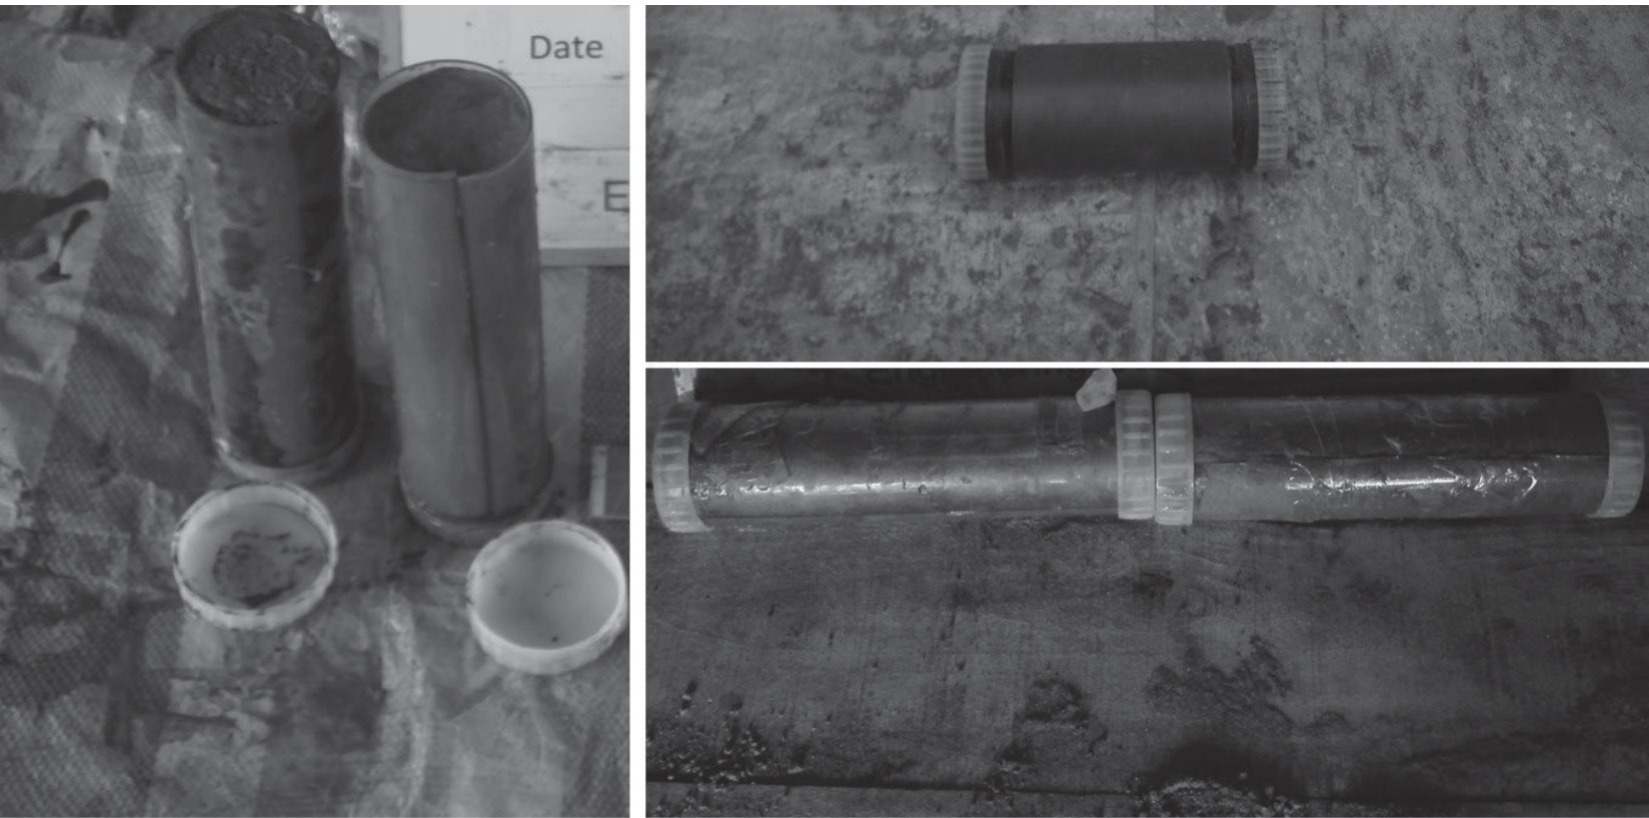
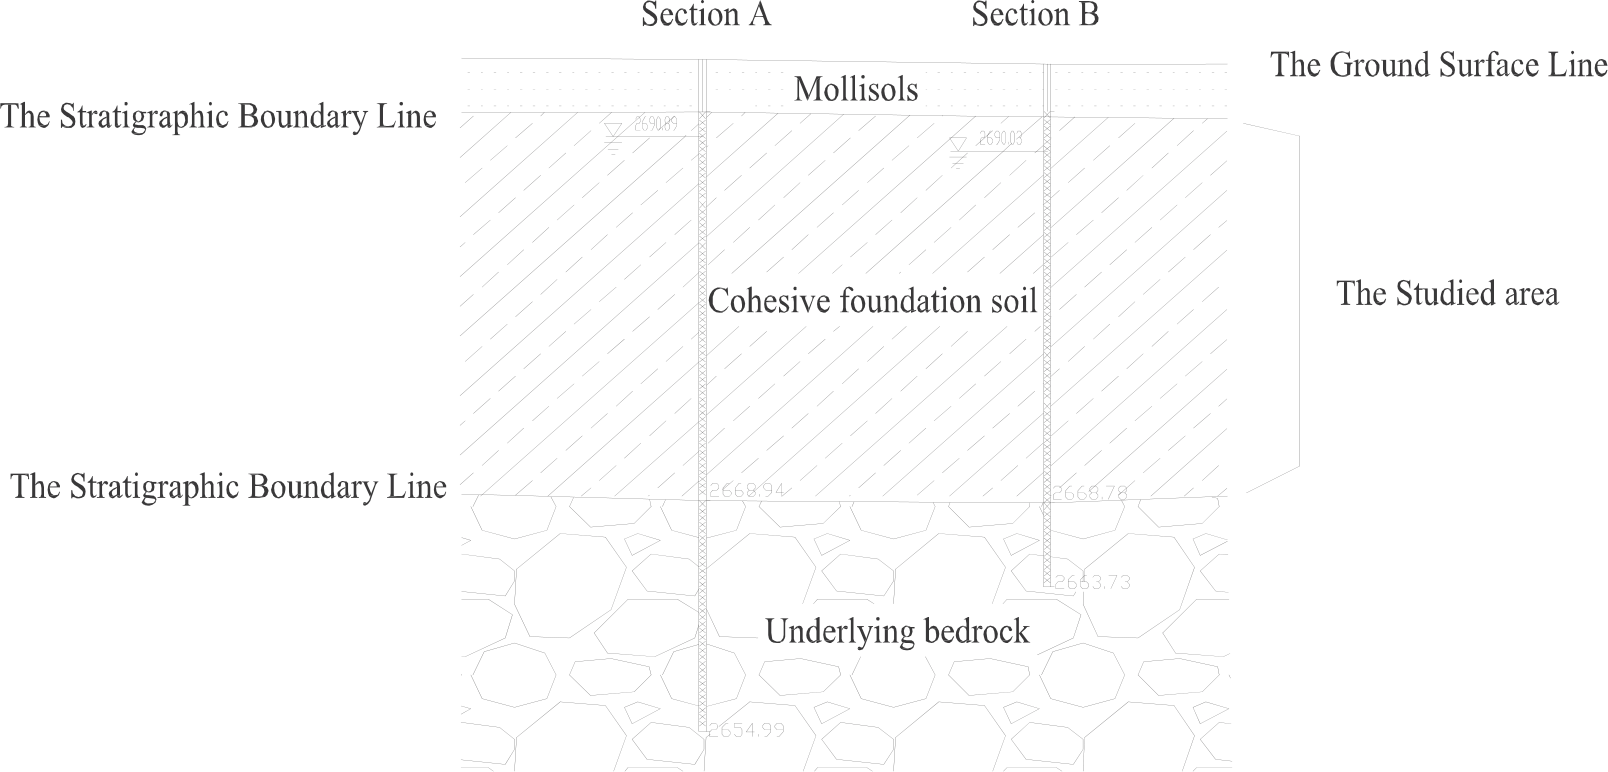
The foundation soil in the airport area is mainly quaternary alluvial silty clay (Fig. 1). The variation of mineral components (montmorillonite and illite) of foundation soil at different depths was obtained by the laboratory XRD tests, which were shown in Fig. 2. In airport engineering, the deformation of foundation soil usually changes obviously only when it reaches a certain load condition. In order to clearly analyze the deformation of foundation soil at different depths, soil with a certain load gap should be selected for research. A large number of practical projects show that the change of foundation soil is more obvious when the depth spacing is 5m. Therefore, the depth of the soil samples selected in this paper is 5 m, 10 m, 15 m, 20 m and 25 m respectively. The basic physical properties of foundation soil with different depths are obtained, which were shown in Table 1.
Training Data Samples
Two test sections (Section A and Section B) were selected in the airport yard area, and each section was buried with stratified settlement meters to measure the settlement of foundation soil. By taking 60 days’ site monitored values as training samples, the modified LSTM model and BP model are constructed respectively, and the 90-day, 120-day and 240-day of foundation settlement are analyzed by using the established models. In the prediction process of the two models, when the sample data training is carried out, the learning rate of the training process is 0.01, and the sample convergence error is 10-5.
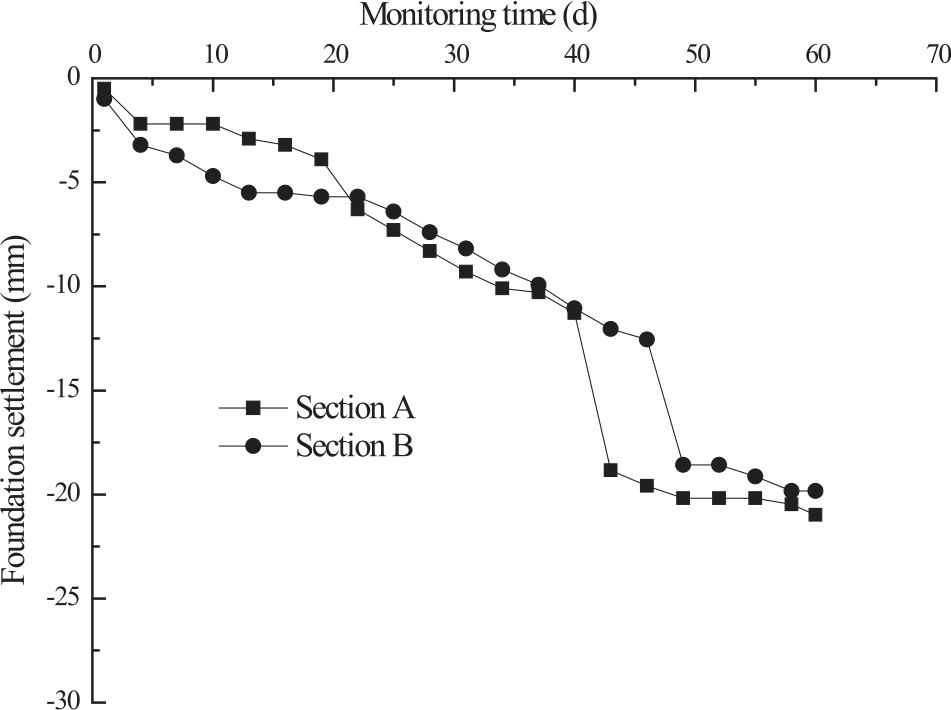
According to the actual engineering situation of foundation soil, settlement should be observed every two days. The monitoring data of foundation settlement in the first 60d is shown in Fig. 4.
Modified LSTM Model for Foundation Settlement Prediction
LSTM Model
Artificial neural network is a large-scale nonlinear dynamic system composed of many neurons. It has strong nonlinear dynamic processing ability and functions such as large-scale parallel computing, partition storage, self-organization, self-adaptation and self-learning. It can train and learn knowledge from accumulated engineering examples without knowing the distribution form of data and the relationship between variables. The establishment of highly nonlinear mapping relationship among various influencing factors, especially the strong fault-tolerant ability for incomplete or fuzzy random uncertain information, determines that the neural network method has a good application basis in the prediction and analysis of foundation settlement. LSTM model is an improvement on the Recursive Neural Network (RNN) model. Special units of memory cells are used to replace the traditional neurons in the hidden layer to remember the required information and forget the unwanted information. In addition, three gating structures including input gate, output gate and forgetting gate are combined to solve the problem of gradient explosion and gradient disappearance in the process of RNN training. In this paper, a prediction model of foundation settlement based on LSTM neural network is proposed by using the good nonlinear mapping ability and strong learning ability of artificial neural network. It overcomes the disadvantages of the existing linear regression prediction model, and predicts and analyzes the actual foundation settlement.
Fig. 4.
Foundation settlement monitoring rules of two observation sections for 60 days (training samples).
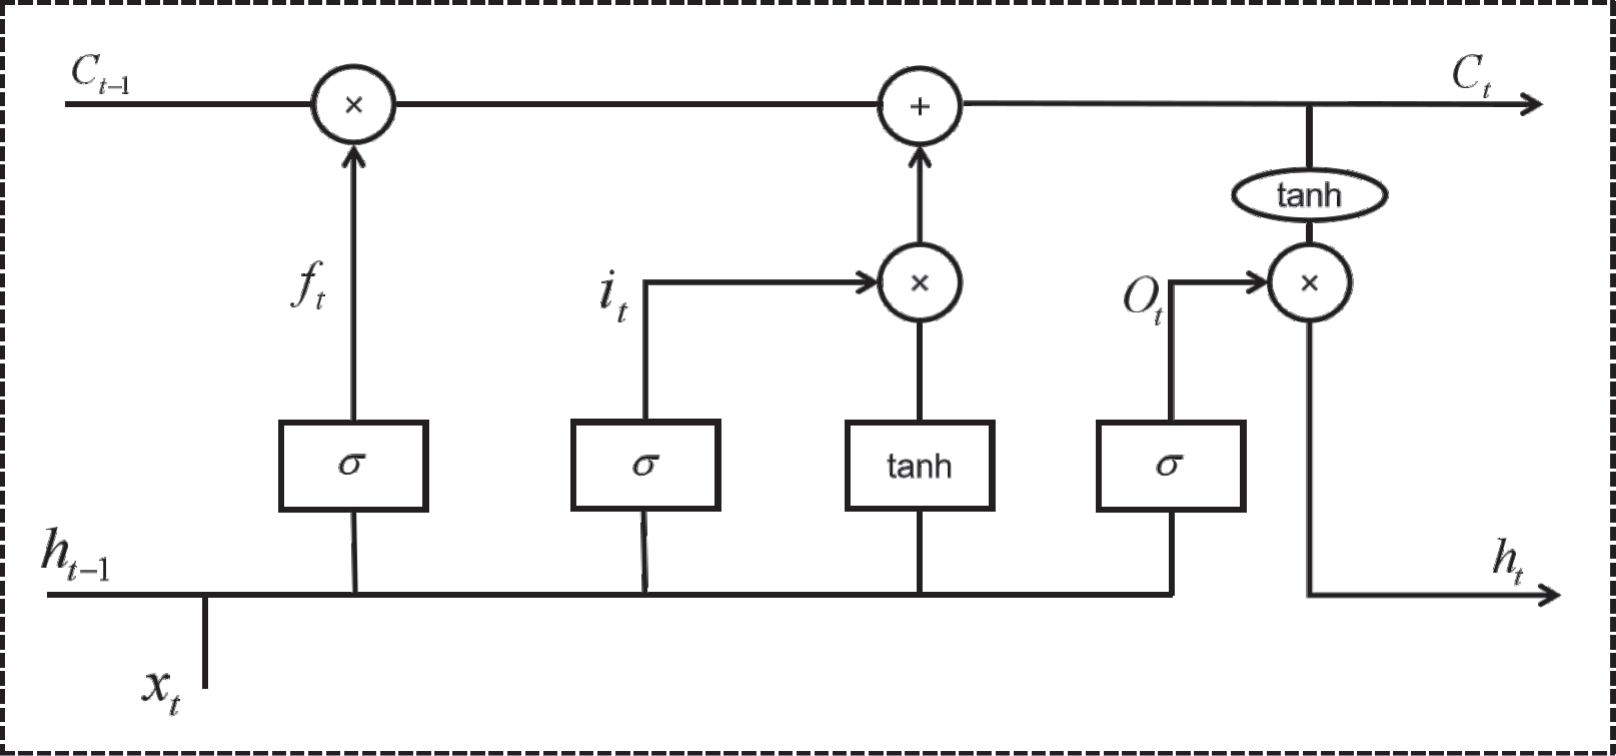
The input gate of each memory cell in the LSTM model determines the probability of new information input at the current stage, that is, the intensity of new input is controlled. The activation function sigmoid layer and tanh layer jointly control the input of new information. The output gate controls the amount of information visible from the current state to the next state, hides the internal hidden state information, and thus generates a new hidden layer. The output of the hidden layer of the previous stage and the input of the current stage in the forgetting gate are times the weight and the state of the memory cells of the previous stage are activated to obtain the memory amount that the memory cells of the previous stage should leave behind, that is, to make a choice of historical information. If the forgetting gate is completely closed, that is, the output of the forgetting gate ft = 0, the history has no influence on the current state. The calculation formula of each gate function is as follows:
In Formula (1)-(3), σ represents generally a nonlinear activation function, such as a sigmoid or tanh function; bi, bf and b0, represents the offset terms of each layer node; Xt is the sample data input at time t; Wi, Wo and Wf are the weight parameters of sigmoid layer, output gate and forgetting gate at time t. Represent the bias vector of sigmoid layer, output gate and forgetting gate, respectively.
Candidate memory cells Ĉt at time t are determined by the implied state of the previous time, while memory cells at time t are determined by input gate and forgetting gate [23], i.e
In Equations (4)-(5), bc is the offset term of tanh layer; Wc is the bias parameter of the tanh layer, ⊙ represents matrix multiplication.
The hidden state at time t is determined by the output gate and memory cells passing through the tanh layer. Namely is shown in Fig. 5.
Modified LSTM Model
Genetic algorithm is a random global search and optimization method developed by imitating the biological evolution mechanism in nature. It draws lessons from Darwin’s evolution theory and Mendel’s genetic theory. It is an efficient, parallel and global search method, which can automatically acquire and accumulate knowledge about search space during the search process and control the search process adaptively to obtain the best solution.
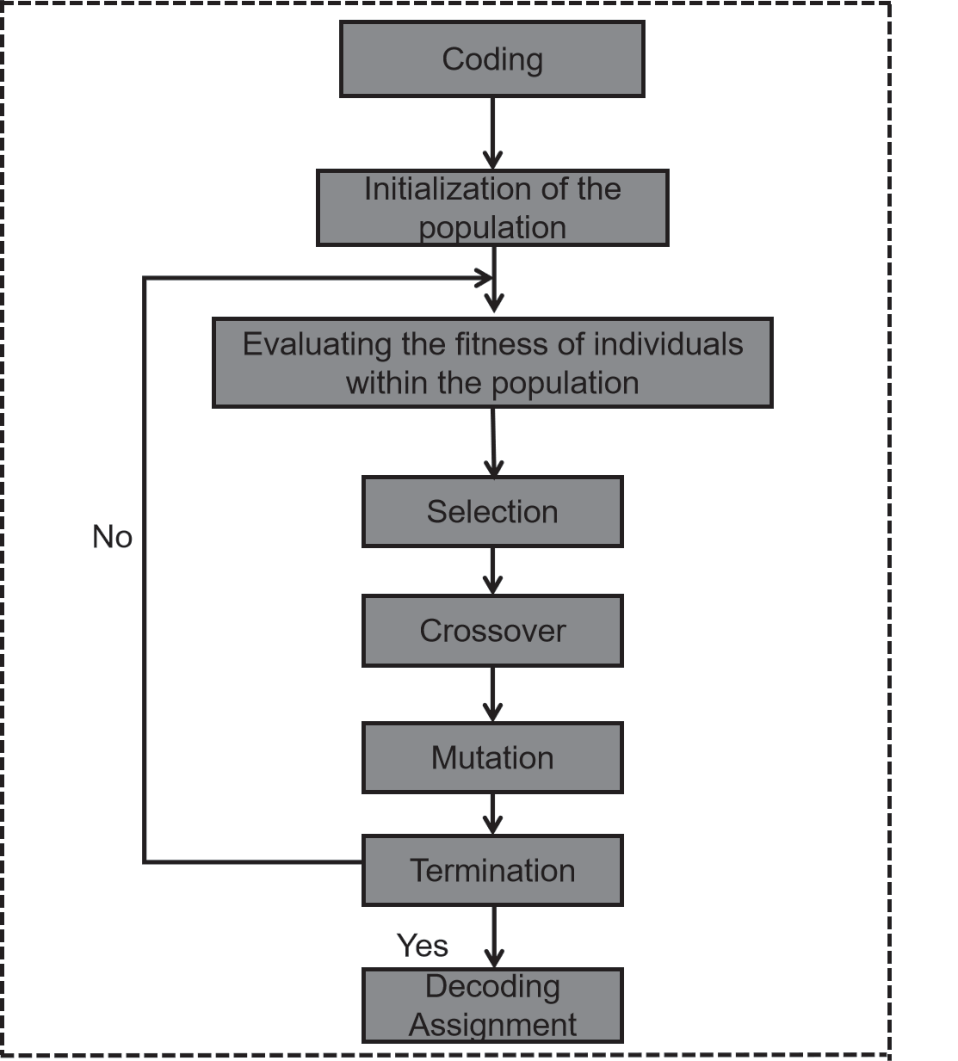
The genetic algorithm takes the population as the solution of the problem and generates a new population through the operation of selection, crossover and mutation. Its judgment criterion is fitness function. In the process of searching cycle, it gradually tends to the population with the best fitness value to obtain the solution of the problem.
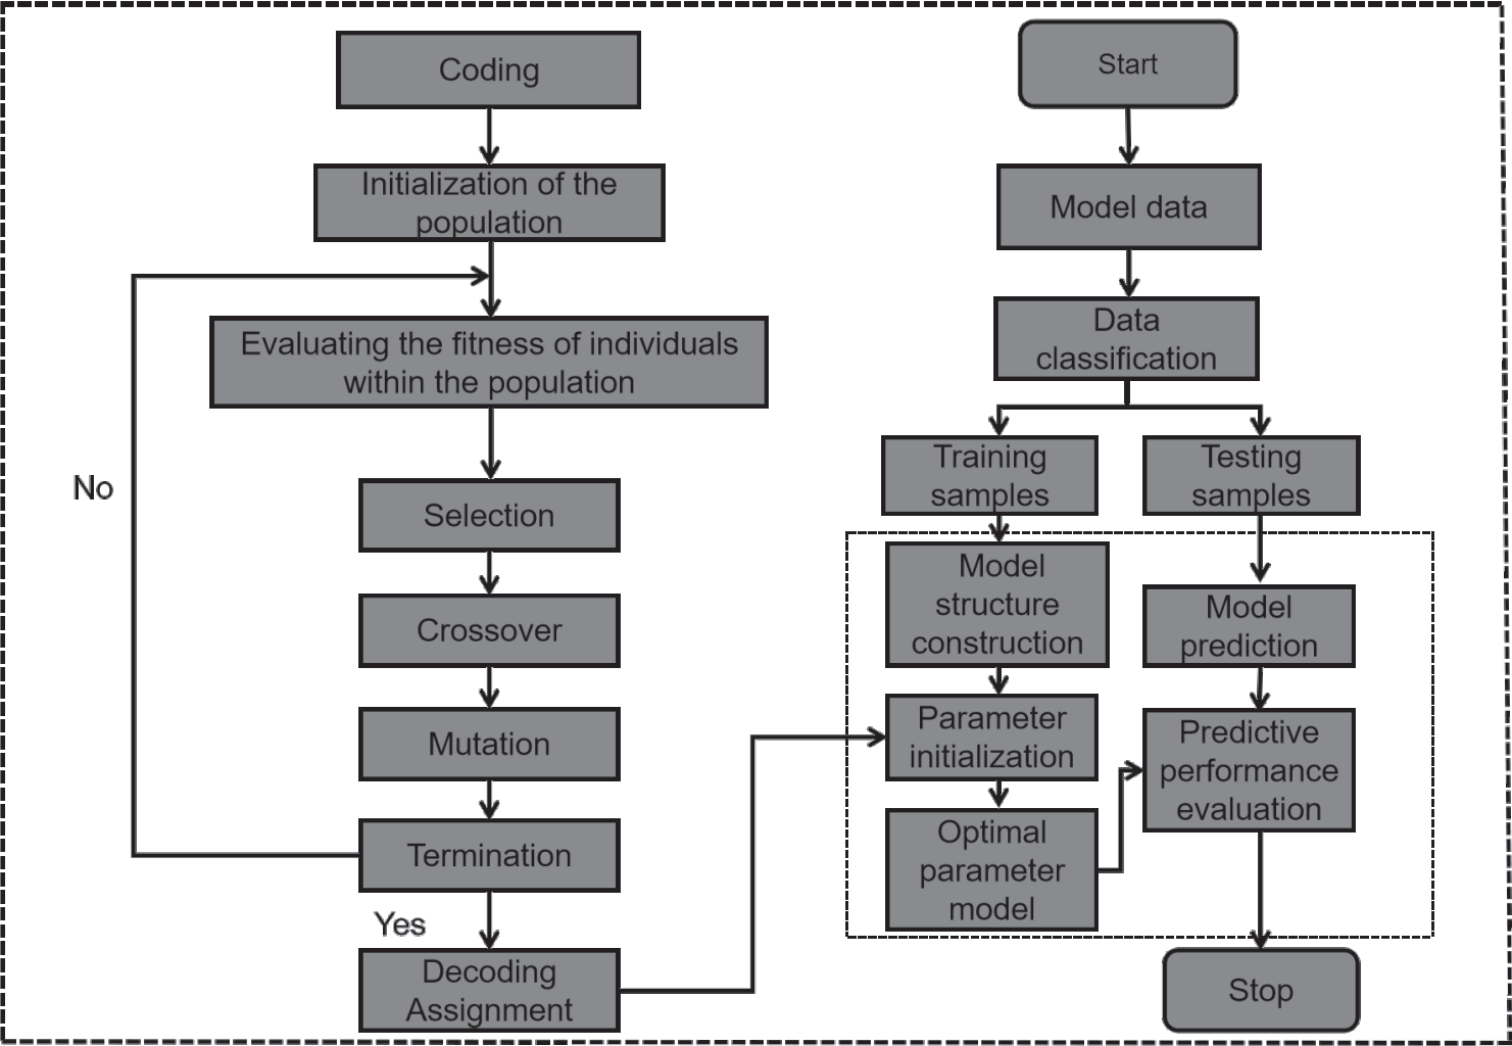
The genetic algorithm was used to optimize the parameters of LSTM layer, fully connected layer and the number of neurons in each layer of the LSTM model. The root-mean-square error of the test data was used as fitness function to obtain the optimal solution in the search space, and then the modified LSTM prediction model was obtained,which is shown in Fig. 6.
In conclusion, LSTM optimized by GA has the characteristics of accurate data feature extraction, long-term time series prediction, and highly nonlinear function fitting. Therefore, it is of research value to apply it to airport foundation settlement prediction is shown in Fig. 7.
Evaluation Index of Modified LSTM Model
This paper takes the historical data of foundation settlement as input. The data are divided into training set and test set in a scale of 1:3. The first 25% of the data is used for training, while the remaining 75% of the data is used to evaluate the model. Three evaluation indexes, goodness of fit R2, mean absolute error EMA and mean square error ERMS, were used to evaluate the model performance comprehensively. Goodness of fit calculation formula:where, the determination coefficient is represented by R2, y is the label value, ŷ is the predicted value, y is the average value, and the value range of R2 is [0, 1]. The larger R2 is, the stronger the ability of X to explain Y of this chromosome is, and the more likely it is to be passed on to the next generation.
Average absolute error calculation formula:
Root mean square error calculation formula:
Where, yi represents monitoring data and predicted value, and N represents data sample size.
Parameters Optimization
In the Genetic Algorithm, the size of the attention weight population, the size of the selected subset population ,and the number of the epochs also influence on the convergence and efficiency of the optimization process.In order to obtain more accurate results when determining the number of layers and neurons in the LSTM network using the GA algorithm, we first set the hidden layer number of the model to three and use the Relu function as the activation function. Then, we use SGD, Adam, RMSprop, and Adagrad as the optimization functions respectively, repeat the iteration for 1000 times, and set the learning rate to 0.01 for debugging and optimizing.The optimal parameters are shown in Table 2 and Table 3.
BP Network Model for Foundation Settlement Prediction
Prediction Steps
BP network is short for Error Back Propagation Network. It consists of input layer, hidden layer and output layer. BP neural network is trained in the way that teachers learn. When a pair of learning modes are provided to the network, the activation value of its neurons will propagate from the input layer to the output layer through each hidden layer, and each neuron in the output layer will output the network response corresponding to the input mode. Then, according to the principle of reducing the error between the desired output and the actual output, from the output layer through the hidden layer, finally, go back to the input layer to correct each connection weight layer by layer. The learning process can be summarized into four processes: pattern forward propagation, error back propagation, cyclic memory training and learning result discrimination. The steps are as follows:
(a) Initialize, give each connection weight, and threshold, give random value between (0,1).
(b) Randomly select a mode pair to provide to the network.
(c) The input (activation value) of each neuron in the intermediate layer is calculated with the input mode, connection weight and threshold, and then the through activation function is used:
Calculate the output of each unit in the middle layer:
Where,
(d) Calculate the input (activation value) of each element in the output layer with the output, connection weight and threshold of the hidden layer, and then calculate the response of each element in the output layer with the activation function:
Where,
(e) Correction error of each unit of the actual output layer of the network with the desired output mode:
(f) Calculate the correction error of the intermediate layer with,
(g) Calculate the next new connection weight between the intermediate layer and the output layer with, and:
Where N is the number of learning times.
(h) Calculate the next new connection weight between the input layer and the intermediate layer with, and:
(i) Randomly select the next learning mode pair to provide to the network and return to step (3) until all m mode pairs are trained.
(j) Randomly select a mode pair from the m learning mode pairs again and return to step (c) until the global error function E of the network is less than the preset value (network convergence) or the number of learning cycles is greater than the preset value (network convergence failure).
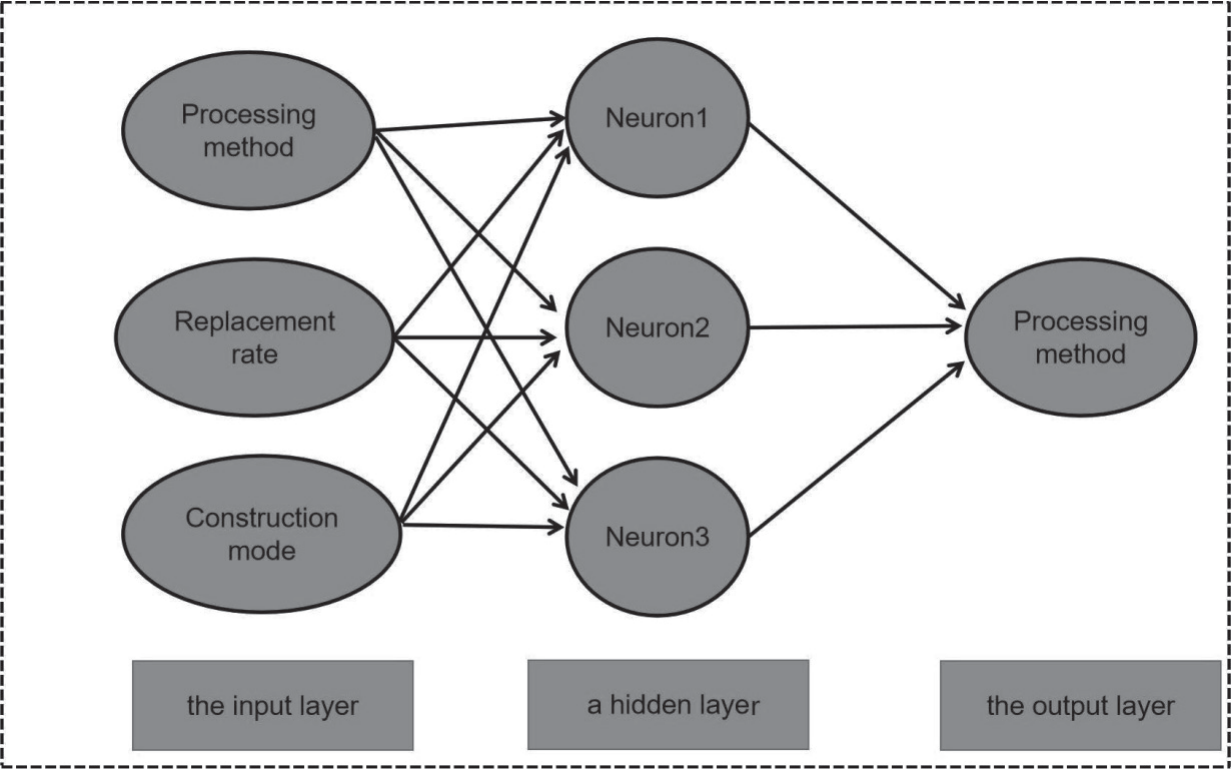
(k) End of learning: In the above learning steps, (c)~(f) represents the “forward propagation process” of the input learning mode, (g)~(i) represents the “reverse propagation process” of network error, and (j) and (k) complete the training and convergence process is shown in Fig. 8.
BP Model for Settlement Prediction
When using the BP neural network model for ground subsidence prediction, it is necessary to first establish the nonlinear relationship between the subsidence influencing factor parameters (such as treatment method, thickness of soft soil layer and hard crust layer, embankment height, compression modulus, etc.) and subsidence, and then input the measured subsidence influencing factor parameters of the test point into the trained network to obtain the predicted subsidence. According to engineering experience, factors affecting subsidence mainly include time, ground parameters, fill parameters, ground treatment methods, construction period, etc. After considering the above factors comprehensively and the characteristics of the actual project, three parameters can be selected as inputs to the model. The output data is the subsidence of the foundation.
Settlement prediction according to BP model includes the following four steps,
(a) Establish an appropriate network structure according to the specific problem, that is, determine the number of neurons in the input layer, hidden layer and output layer.
(b) Establish the learning sample set and expected output.
(c) Determine the sample convergence error and train the network until it converges.
(d) Prediction with convergent networks.
It uses the training function “trainglm” and the Levenberg-Marquardt algorithm to train the network. The number of training iterations is set to 1000, and the learning rate is set to 0.01. In this network, the transfer function of the neurons in the hidden layer is set as the sigmoid function “tansig”, and the transfer function of the neurons in the output layer is set as the logarithmic sigmoid function “logsig”.
Results and Discussion
The Predicted Settlement for 90-day
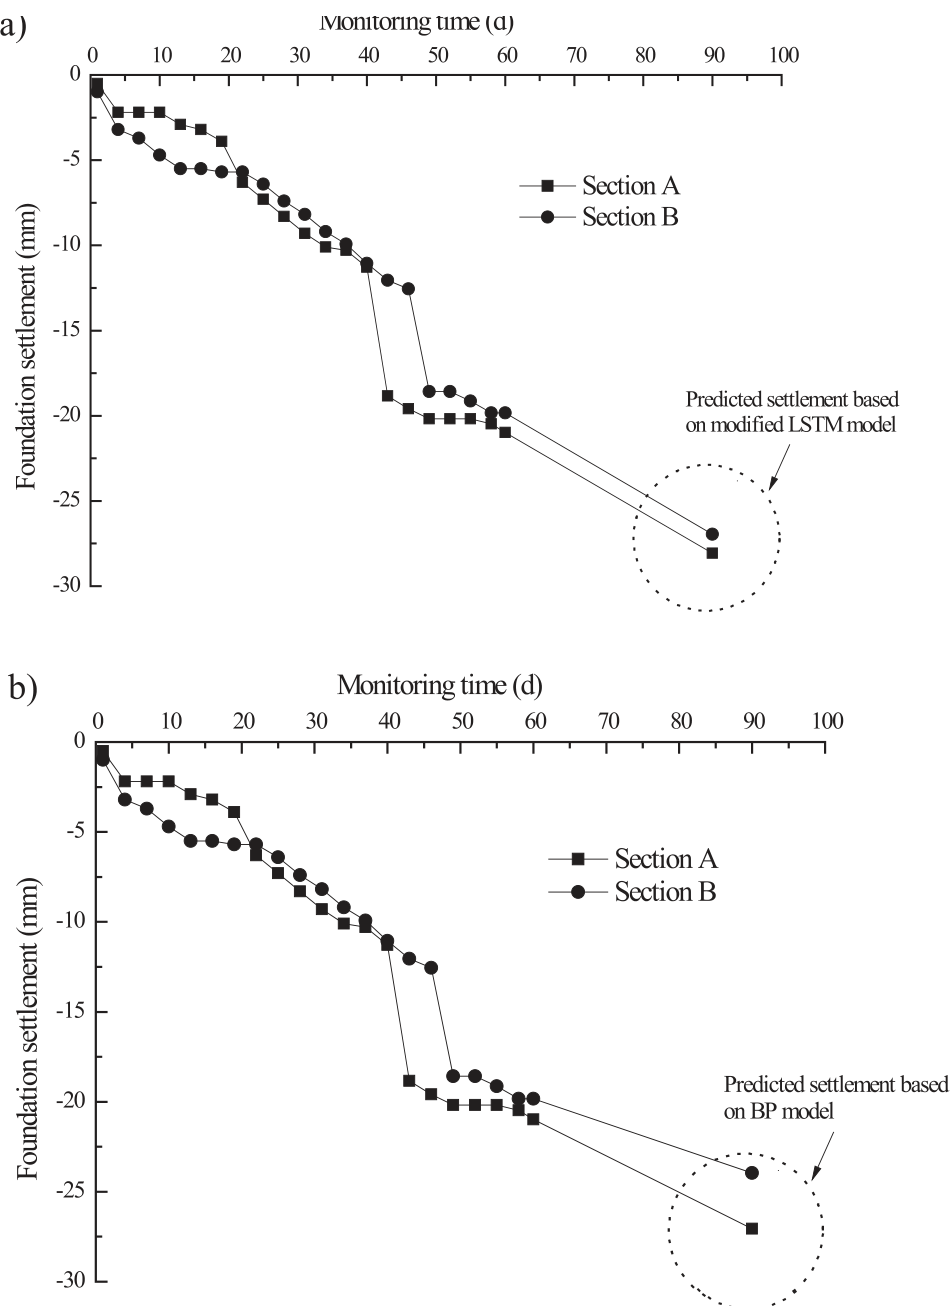
Under the two models, the predicted value of foundation settlement for 90-day is shown in Fig. 9.
As can be seen from Fig. 10, for the two test sections of A/B, the predicted values of the modified LSTM model are all greater than those of the BP model. At the same time, in the prediction of the modified LSTM model, the change trend of the two test sections is consistent, while in the prediction of the BP model, the B section has an obvious mutation, indicating that the modified LSTM model has a more stable change trend than the BP model when predicting the foundation settlement.
The Predicted Settlement for 120-day
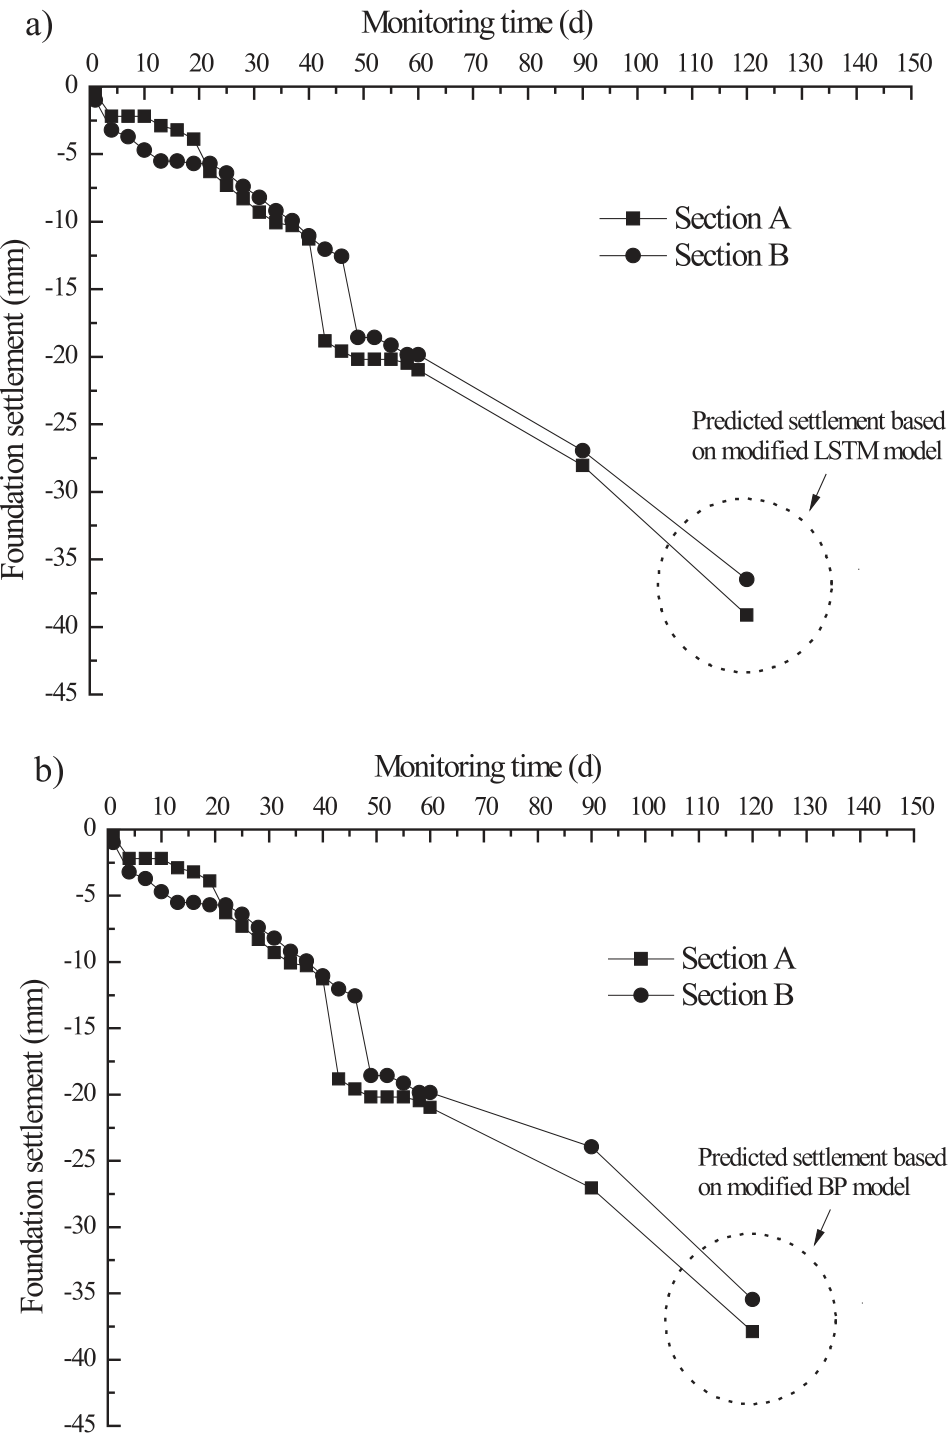
Under the two models, the predicted value of foundation settlement for the 120-day is shown in Fig. 10.
As can be seen from Fig. 11, for the two test sections of A/B, the predicted values of the modified LSTM model are all greater than those of the BP model. At the same time, the predicted settlement trends of the two models are consistent in the two test sections.
The Predicted Settlement for 240-day
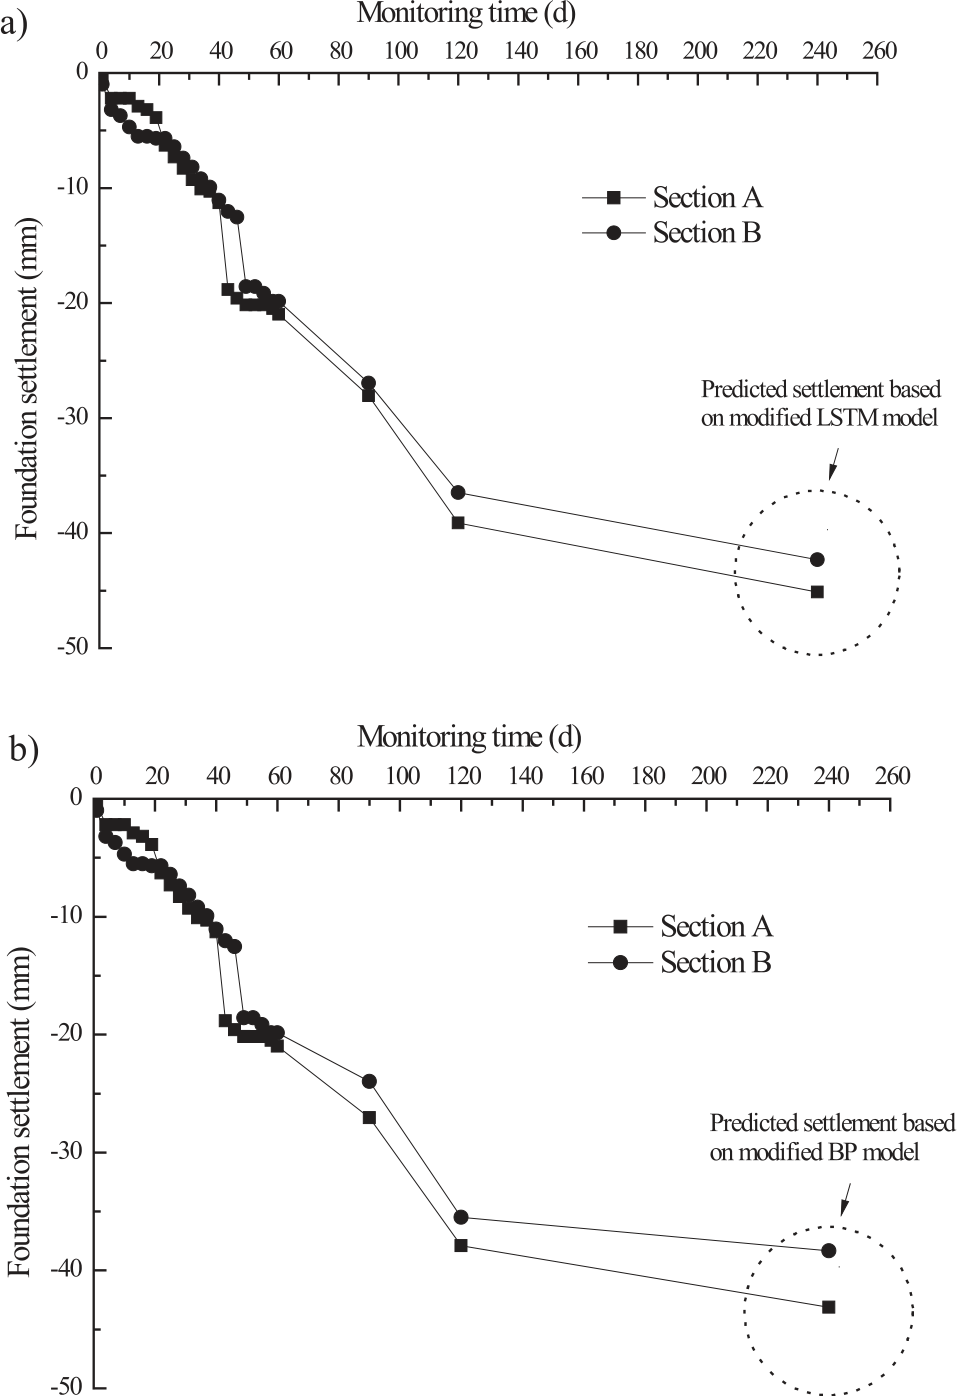
Under the two models, the predicted value of foundation settlement for the 240-day is shown in Fig. 11.
As can be seen from Fig. 11, for the two test sections of A/B, the predicted values of the modified LSTM model are all greater than those of the BP model. At the same time, in the prediction of the modified LSTM model, the change trend of the two test sections is consistent, while in the prediction of the BP model, the B section has an obvious mutation, indicating that the modified LSTM model has a more stable change trend than the BP model when predicting the foundation settlement.
Comparison with Monitored Values
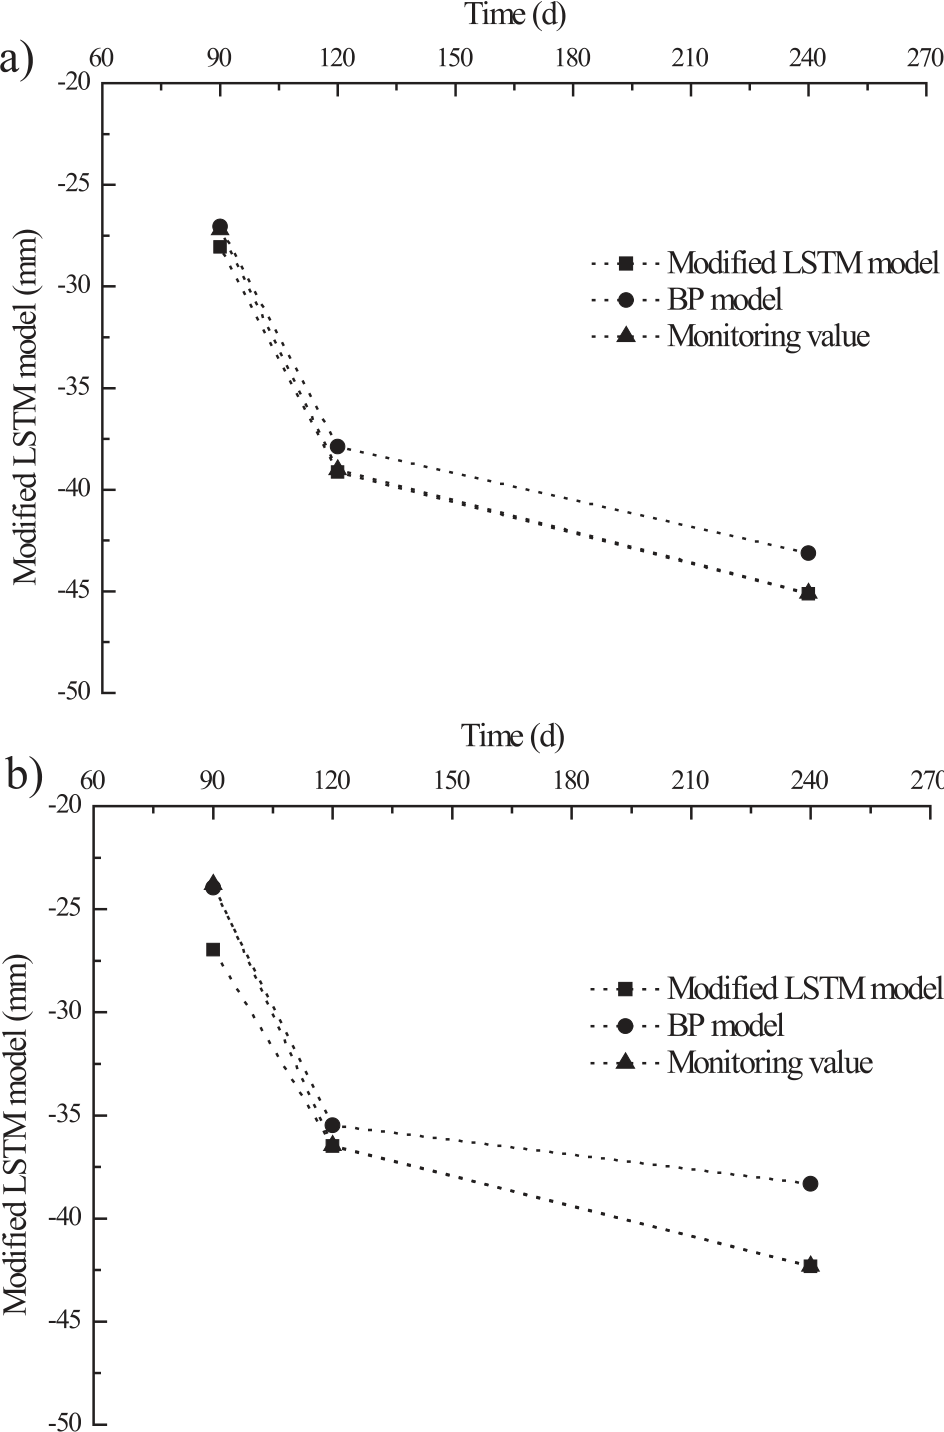
The predicted value was compared and analyzed with the site monitored value, and the data comparison was shown in Table 4 and Fig. 12.
As can be seen from Table 4 and Fig. 13, for the two test sections of A/B, the predicted values of the modified LSTM model are greater than those of the BP model, and the predicted values of the modified LSTM model are closer to the site monitored value than those of the BP model, and the relative error between the predicted values and the monitored values is less than 3%, meeting the requirements of practical engineering. Therefore, the calculation result of the modified LSTM network model has small error and high precision, which can fully meet the practical needs of the project, thus proving the feasibility and effectiveness of the method of predicting the foundation settlement of the airport on high plateau by using the modified LSTM model technology in this paper. The modified LSTM model constructed in this paper can be used to predict foundation settlement and settlement for high plateau airports with similar engineering conditions.
Conclusions
In this paper, aiming at the multidimensional and nonlinear problems of the high plateau airport foundation settlement data, genetic algorithm is used to optimize the parameters of the LSTM model, and a modified LSTM foundation settlement prediction model is constructed, and compared with the BP neural network model and the site monitored values. The following conclusions are obtained:
(1) The modified LSTM model and BP model constructed in this paper are generally consistent with the site monitored values in the prediction of the foundation settlement of the airport on the high plateau. However, the modified LSTM model is more sensitive to the abrupt change of the data and has a more stable trend than the BP model.
Fig. 12.
Comparison between the predicted value and the site monitored value. a) Comparison of prediction results for Section A, b) Comparison of prediction results for Section B.
(2) The predicted values of the modified LSTM model are all greater than those of the BP model, and the predicted values of the modified LSTM model are closer to the site monitored values than the predicted values of the BP model, and the relative error between the predicted values and the monitored values is less than 3%.
(3) The modified LSTM model constructed in this paper can be used to predict foundation settlement and settlement for high plateau airports with similar engineering conditions.
(4) In the manuscript, a hybrid machine learning framework was proposed to predict ground subsidence. The framework modeled the heuristic feature set and well-tuned machine learning models through the iterative process of the coupled GA-LSTM algorithm. Moreover, the workflow of the framework is fully automated, which is more convenient. Experimental results showed that the GA-LSTM predicted values are superior to the BP neural network predicted values in terms of prediction accuracy, compared with the BP prediction model. Through comprehensive analysis and research, the feasibility and effectiveness of the GA-LSTM model were verified, and the superiority of the proposed method was proved, surpassing mainstream models.

