

Introduction
As the indication of practical engineering, related accidents could be seen everywhere in airport engineering due to the pavement excessive settlement. According to the relevant regulations of the Civil Aviation Administration of China, the requirement of foundation settlement of high-plateau airports is stricter than that of airports in plain area for ensuring flight safety [1-3]. So it is necessary to correctly analyze the settlement characteristics of foundation in high-plateau airport.
So far, there could be roughly divided into three categories in research methods on settlement characteristics of foundation soil at the high-plateau airport [4-5]. The first one is one-dimensional analytic method based on elastic theory and Terzaghi’s consolidation theory; The second one is various experiential calculation method based on the measured process curve of deformation-time; The last one is a numerical analysis method which used two-dimensional or three-dimensional Terzaghi’s consolidation theory or Biot’s consolidation theory and combined with a variety of constitutive models. Owing to the immaturity of unsaturated soil consolidation theory, it always adopted the saturated soil consolidation theory for settlement calculation in actual practice. But for usual errors between calculation values and field monitoring values, so the first method is restricted. The second method always requires long time for field observation. When studying the characteristics of foundation settlement, the numerical simulation analysis method has been applied more and more widely in practice. Some researchers conducted the numerical simulation of settlement displacement of soft soil foundation under the embank load by using ANSYS finite element software and compared with the settlement displacement of composite foundation [6]. Under the engineering background of Algeria tank soft foundation, several researchers conducted the numerical analysis for the settlement of large oil tank soft foundation by using PLAXIS software and compared with the field monitoring values [7]. The numerical analysis mentioned above was about saturated soil foundation. Parameters were obtained by conventional laboratory compression tests of saturated soil. But most of foundation soils in reality are in the state of unsaturated, which are composed of soil skeleton, pore air and water. Therefore there certainly exists amount of errors in conducting foundation settlement simulation, whose parameters according to the conventional method of saturated soil.
This paper analyzed the ground stress and settlement characteristics of unsaturated foundation soil of a high-plateau airport in the embankment filling stage based on the one-dimensional consolidation theory and Van Genuchten model of soil water characteristics of unsaturated soil.
Material and Methods
One-Dimensional Consolidation Theory of Unsaturated Soil
Consolidation theory of unsaturated soil is the basis in settlement calculation of foundation. The research about consolidation theory of unsaturated soil began in the 1960s and from then on, many researchers focus on it. It has kinds of typical examples, such as Blight’s consolidation theory Scott’s consolidation theory, Barden’s consolidation theory, and Fredlund’s consolidation theory, which is the most popular in the geotechnical engineering community [8-10]. Some researchers have successively studied the consolidation theory for unsaturated soil and put forward their own theories separately [11-12]. For Fredlund’s one-dimensional consolidation, the liquid differential equation is shown as follows:
Where ua is the pore air pressure, us is the matric suction, us = ua – uw, uw is the pore water pressure, m1kw is the changing coefficient of liquid volume related to the net vertical stress; m2w is the changing coefficient of liquid volume related to the matric suction; σ is the vertical stress, (σ – ua) is the net vertical stress; Vw is the unit volume of liquid soil; V0 is the initial total volume of soil unit.
The air differential equation is shown as follows:
Where, ca is the interactive constant associated with gas differential equation; cva is the gas consolidation coefficient.
If the saturation is bigger than the residual saturation, it assumes that the coefficient of volume change is constant and the stress is not with time in the process of consolidation. Analysis on the consolidation properties uses a simplified one-dimensional liquid consolidation equation:
Where, cvw is the liquid consolidation coefficient, kw is the liquid permeability coefficient of unsaturated soil. It is a function of the matric suction, which changed along the direction of soil layer with the change of saturation; rw is the gravity density mw is the changing coefficient of liquid volume related to the matric suction.
Soil Water Characteristic Curve
SWCC (soil water characteristic curve) [13] is an important characteristic curve of unsaturated soil, as it can link the water-content and matric suction, which has an important influence on mechanical behavior of unsaturated soil. Since 1990s, the role of SWCC in the research of unsaturated soil has been increasingly valued. Some researchers utilized the SWCC to obtain constitutive model parameters and also used it in the calculation of soil deformation [14]. Equations for determining SWCC parameters which can be used for computational analyses were proposed to replace the conventional graphical method in providing consistent results [15].
Several researchers had taken six different testing methods to establish the SWCC, including the filter paper, vapor equilibrium, pressure plate, Tempe cell and osmotic methods, which showed that each suction measurement technique provides different measurable ranges of suction values [16]. Two models, Genetic-Based Neural Network (GBNN) and Genetic Programming (GP), were previously developed for the prediction of SWCC [17]. But the most important thing for establishing SWCC is the determination of suction and its corresponding water content. Measurement of water content is easier than that of suction, though there have already been a variety of methods such as filter paper, thermal sensor, axis-translation technique and hygrometer etc. However, most of the methods are restricted due to low precision of test instrument, time consuming and high cost. In addition, the spatial variability of foundation soil affects and hinders the application of direct measuring methods in practice. Therefore, it is necessary to establish an appropriate empirical model to obtain SWCC. There have four frequently-used empirical models, including Brooks-Corey model, Gardner model, Van-Genuchten model (VG model for short) and Gardner-Russo model. Others researched on domestic and overseas soil hydrodynamic parameters and found that VG model have not only better fitting effect but also can link with the mechanical composition and bulk density of soil [18].
The Van Genuchten model can be used to express the relationship between the volumetric water content and the matric suction of an unsaturated soil as follows,
Where a is the soil parameter of the air entry function; b is the soil property parameter as a function of water flow rate in soil when matric suction exceeds the air entry value of soil. θr is the residual volume water content; θs is the saturated volume water content. The value range of volume water content θ is θ∈[θr, θs]; The value range of matric suction us is us ∈[0, ψr], and ψr is the matric suction corresponding to the residual volume water content.
Initial Soil Parameters
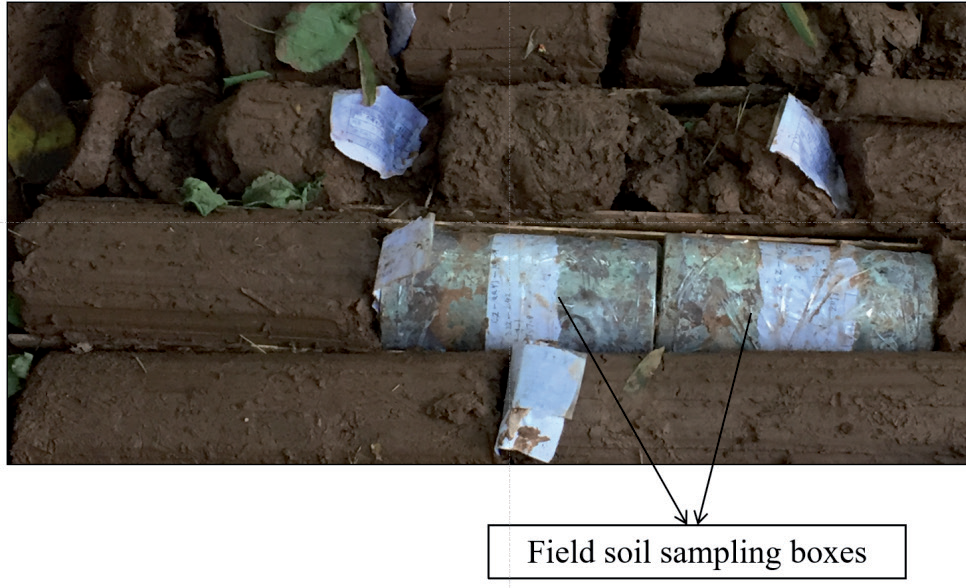
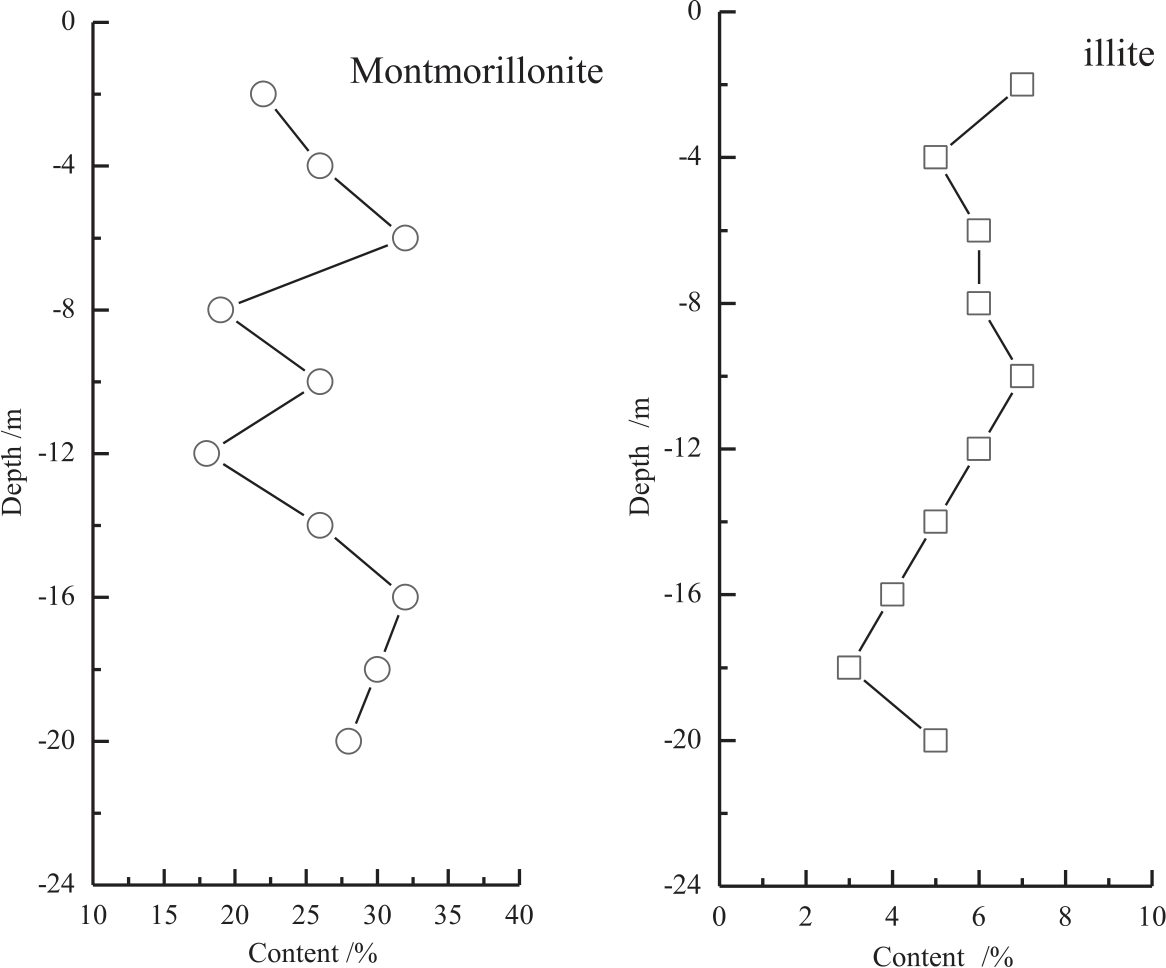
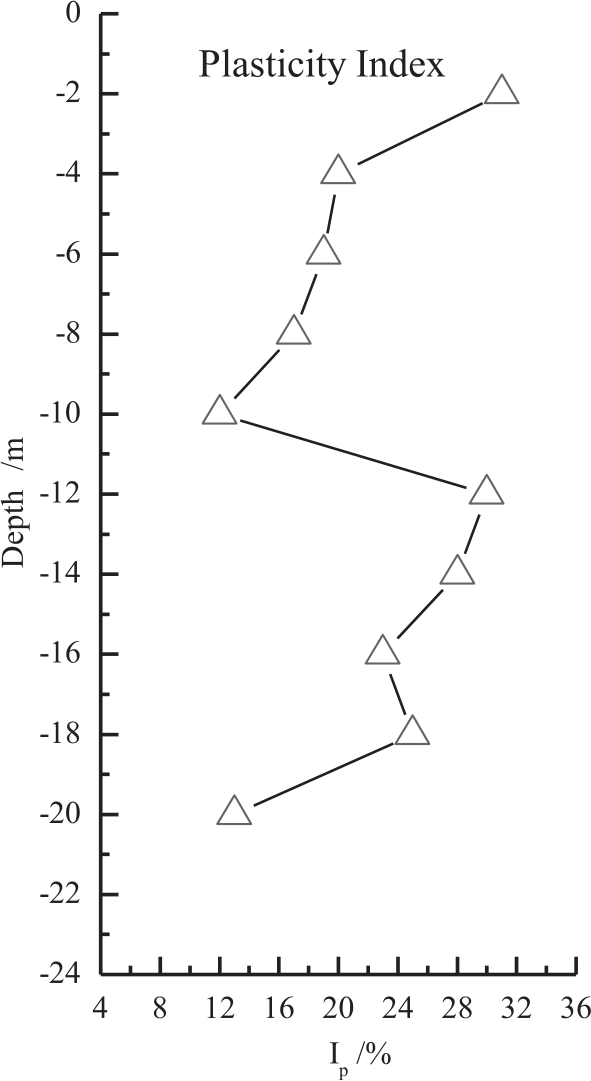
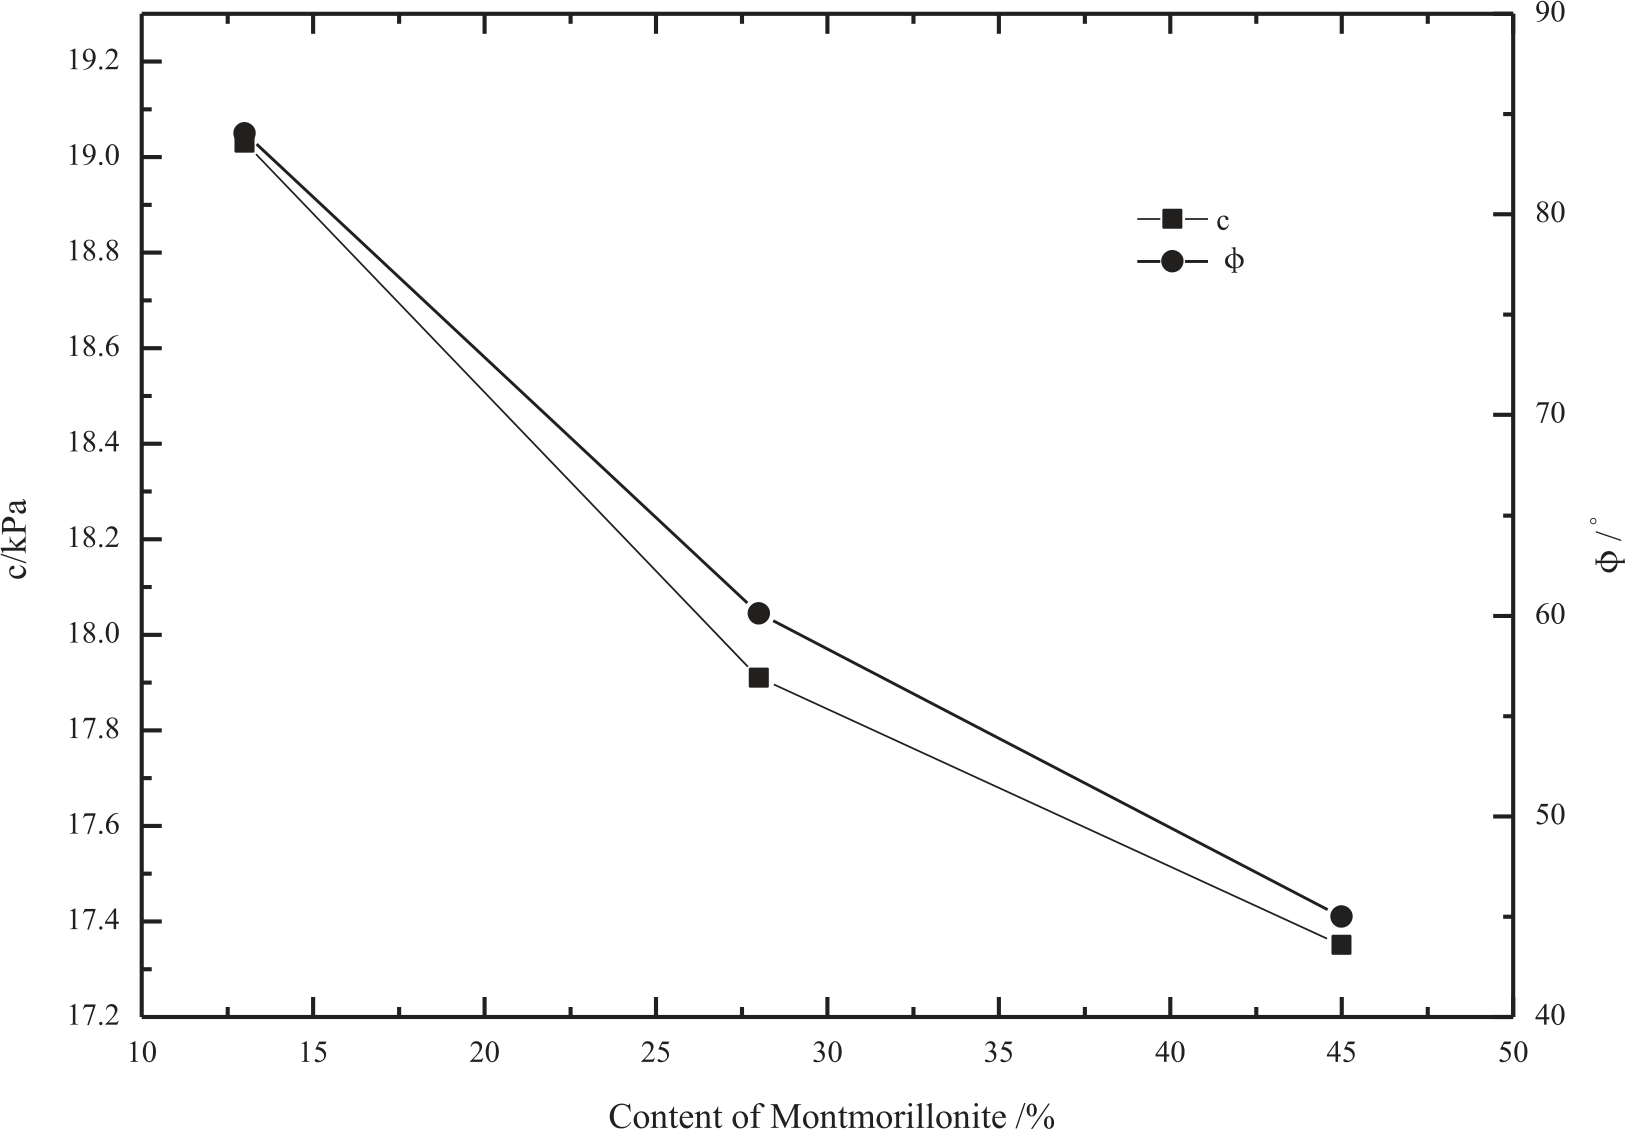
The high plateau airport studied is located in Kangding area of Sichuan Province. The foundation soil in the airport area is mainly quaternary alluvial silty clay and clay, which were shown in Fig. 1. The variation of mineral components of foundation soil at different depths was obtained by the laboratory XRD tests, which were shown in Fig. 2. Through laboratory tests on soil samples of different depths, the variation curves of plasticity index of soil samples of different depths were obtained, as shown in Fig. 3. The soil samples with an intermediate depth (i.e., at depth of 10m) was selected for comprehensive analysis. The correlation between the plasticity index, cohesion (c) and internal friction angle (Φ) of the soil samples was obtained through laboratory tests, as shown in Fig. 4.
SWCC Parameters
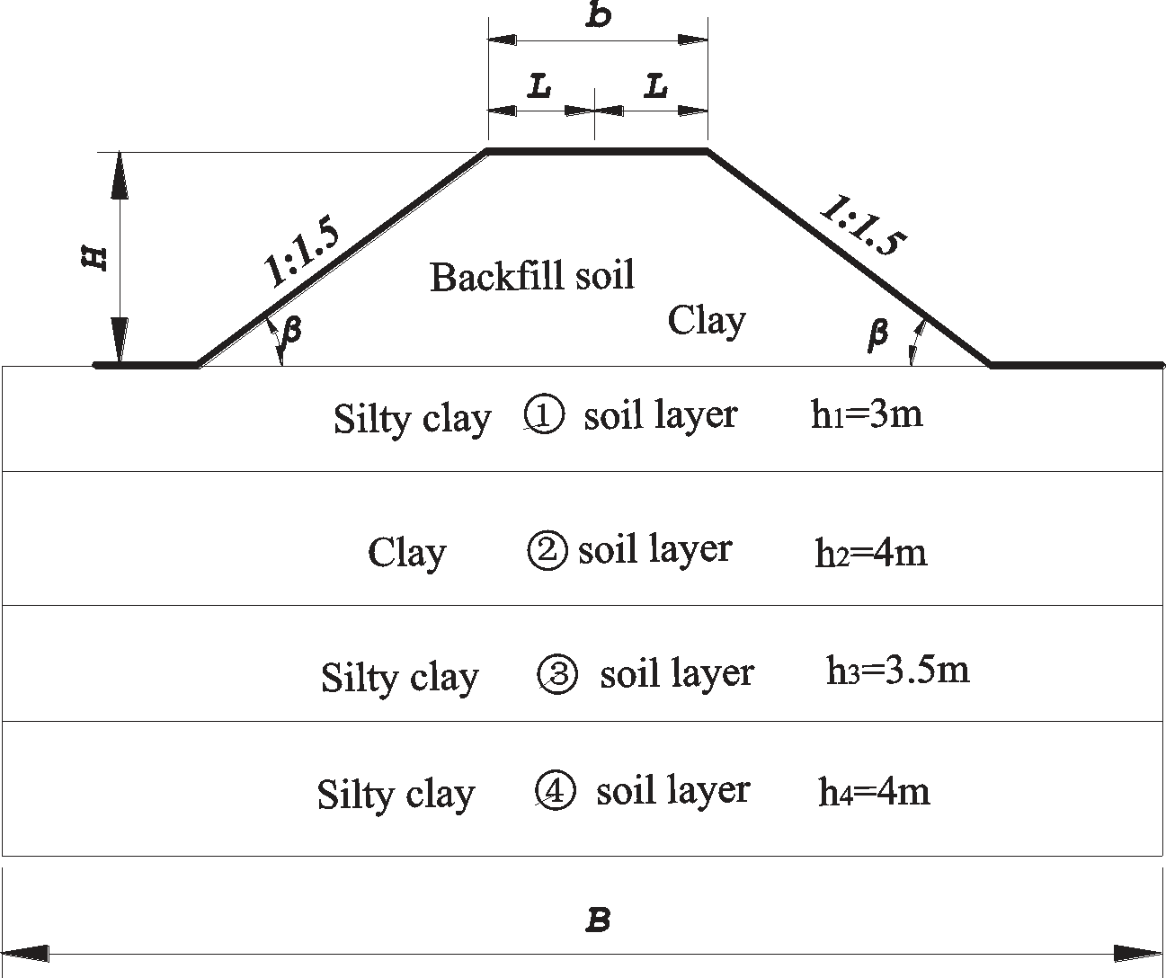
In order to build a numerical analysis model for the foundation soil, the high-plateau airport embankment is divided into four depths, which are numbered as ①, ②, ③ and ④. It selected the segment which can synthetically reflect the nature of this work site, the cross section is in Fig. 5.
The width of embankment bottom b = 20 m, the slope toe β is approximate to 35°, the height is H = 9 m, L is half of the bottom width. The foundation soil is divided into four layers along the calculation depth. In order to analyze the rule of soil stress changed with depth and settlement in the embankment filling stage, the embankment backfill soil was filled by nine layers and each layer was of 1m. The initial parameters of foundation soil are shown in Table 1.
The pressure plate apparatus (Fig. 6) was employed to determine the soil water characteristic curve (SWCC) of the foundation soil and it was fitted with the Van-Genuchten model (Formula 4), which was summarized in Table 2. The apparatus consists of strongly built metal chambers containing one or more ceramic plates onto which uniform soil samples are placed. Having attained maximum moisture retention (field capacity) the samples within the cells are then subjected to controlled positive air pressures and water is gradually removed.
Model Establishment and Mesh Layout
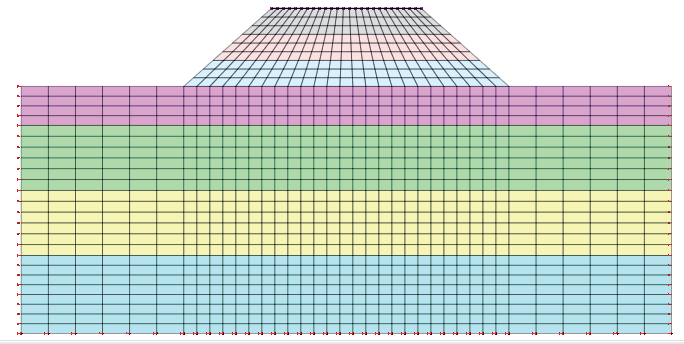
Midas/GTS was used to establish the foundation model with inserting into the function of SWCC. The horizontal restraint was adopted for the left and right margins of the model, and horizontal and vertical restraint was used for the bottom surface of foundation. The top was the drainage and exhaust surface. The layout of mesh is shown in Fig. 7. According to the actual engineering environment, the load condition and deformation of the soil, the grid is divided, and the mechanical model of rectangular element is selected to analyze the grid division. The number of grid nodes is 1024, part of which is shown in Fig. 7.
Results and Discussion
Analysis of Ground Stress
In the design code of high-plateau airport, the ground stress caused by the embankment is often simplified in the form of approximate load. There are two main methods: the method of proportional load and the method of uniformly distributed load. In essence, the embankment and foundation are all considered separately in the two methods. But in the practical airport engineering, the stress, the deformation of embankment and foundation was continuous. So, it isn’t consistent with the actual project according to the above two kinds of methods to calculate stress. Some researchers proposed an elastic embankment method which treated the embankment and foundation as a continuous whole to calculate foundation soil stress [19]. But it is not convenient in engineering application as a result of the complicated calculation formula. In this paper, it analyzed the stress of embankment foundation soil by the means of making relevant program to calculate the process of layered filling, which each layer filled 1m and a total of 9 layers, that is to say, it set up a total of 9 stages. The corresponding interval was set after each layer filling completed, so as to make the unsaturated foundation soil consolidated for a period of time and the interval was respectively set by 5d, 10d, 15d and 20d. For comparison, overall filling (interval of 0d) also considered. The variation nephogram of ground stress of the whole section was shown in Fig. 8, and the distribution curves of ground stress were shown in Fig. 9.
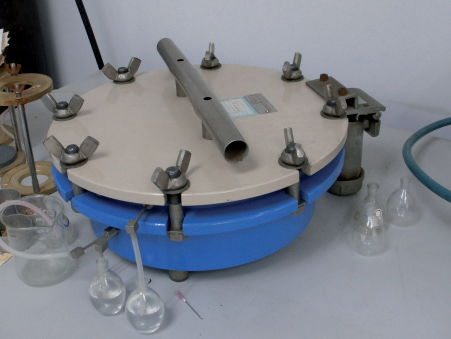
Table 2.
SWCC fitting curve of foundation soil of high-plateau airport.
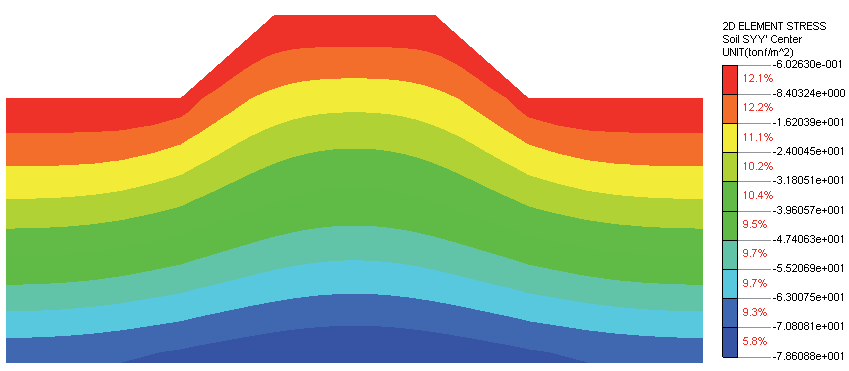
Figs 8-9 shows that depth-stress curves of different interval are similar. For the overall filling, the curve could be similarly looked as two straight lines: when depth is within 0-4 m, with the increase of depth, the stress increasing rate gets smaller; when depth is within 4-14.5 m, with the increase of depth, the stress increasing rate gets bigger.
Fig. 9.
Curves of depth-stress distribution: a) Overall filling (interval of 0d), b) Layered filling (interval of 5d), c) Layered filling (interval of 10d), d) Layered filling (interval of 15d), e) Layered filling (interval of 20d).
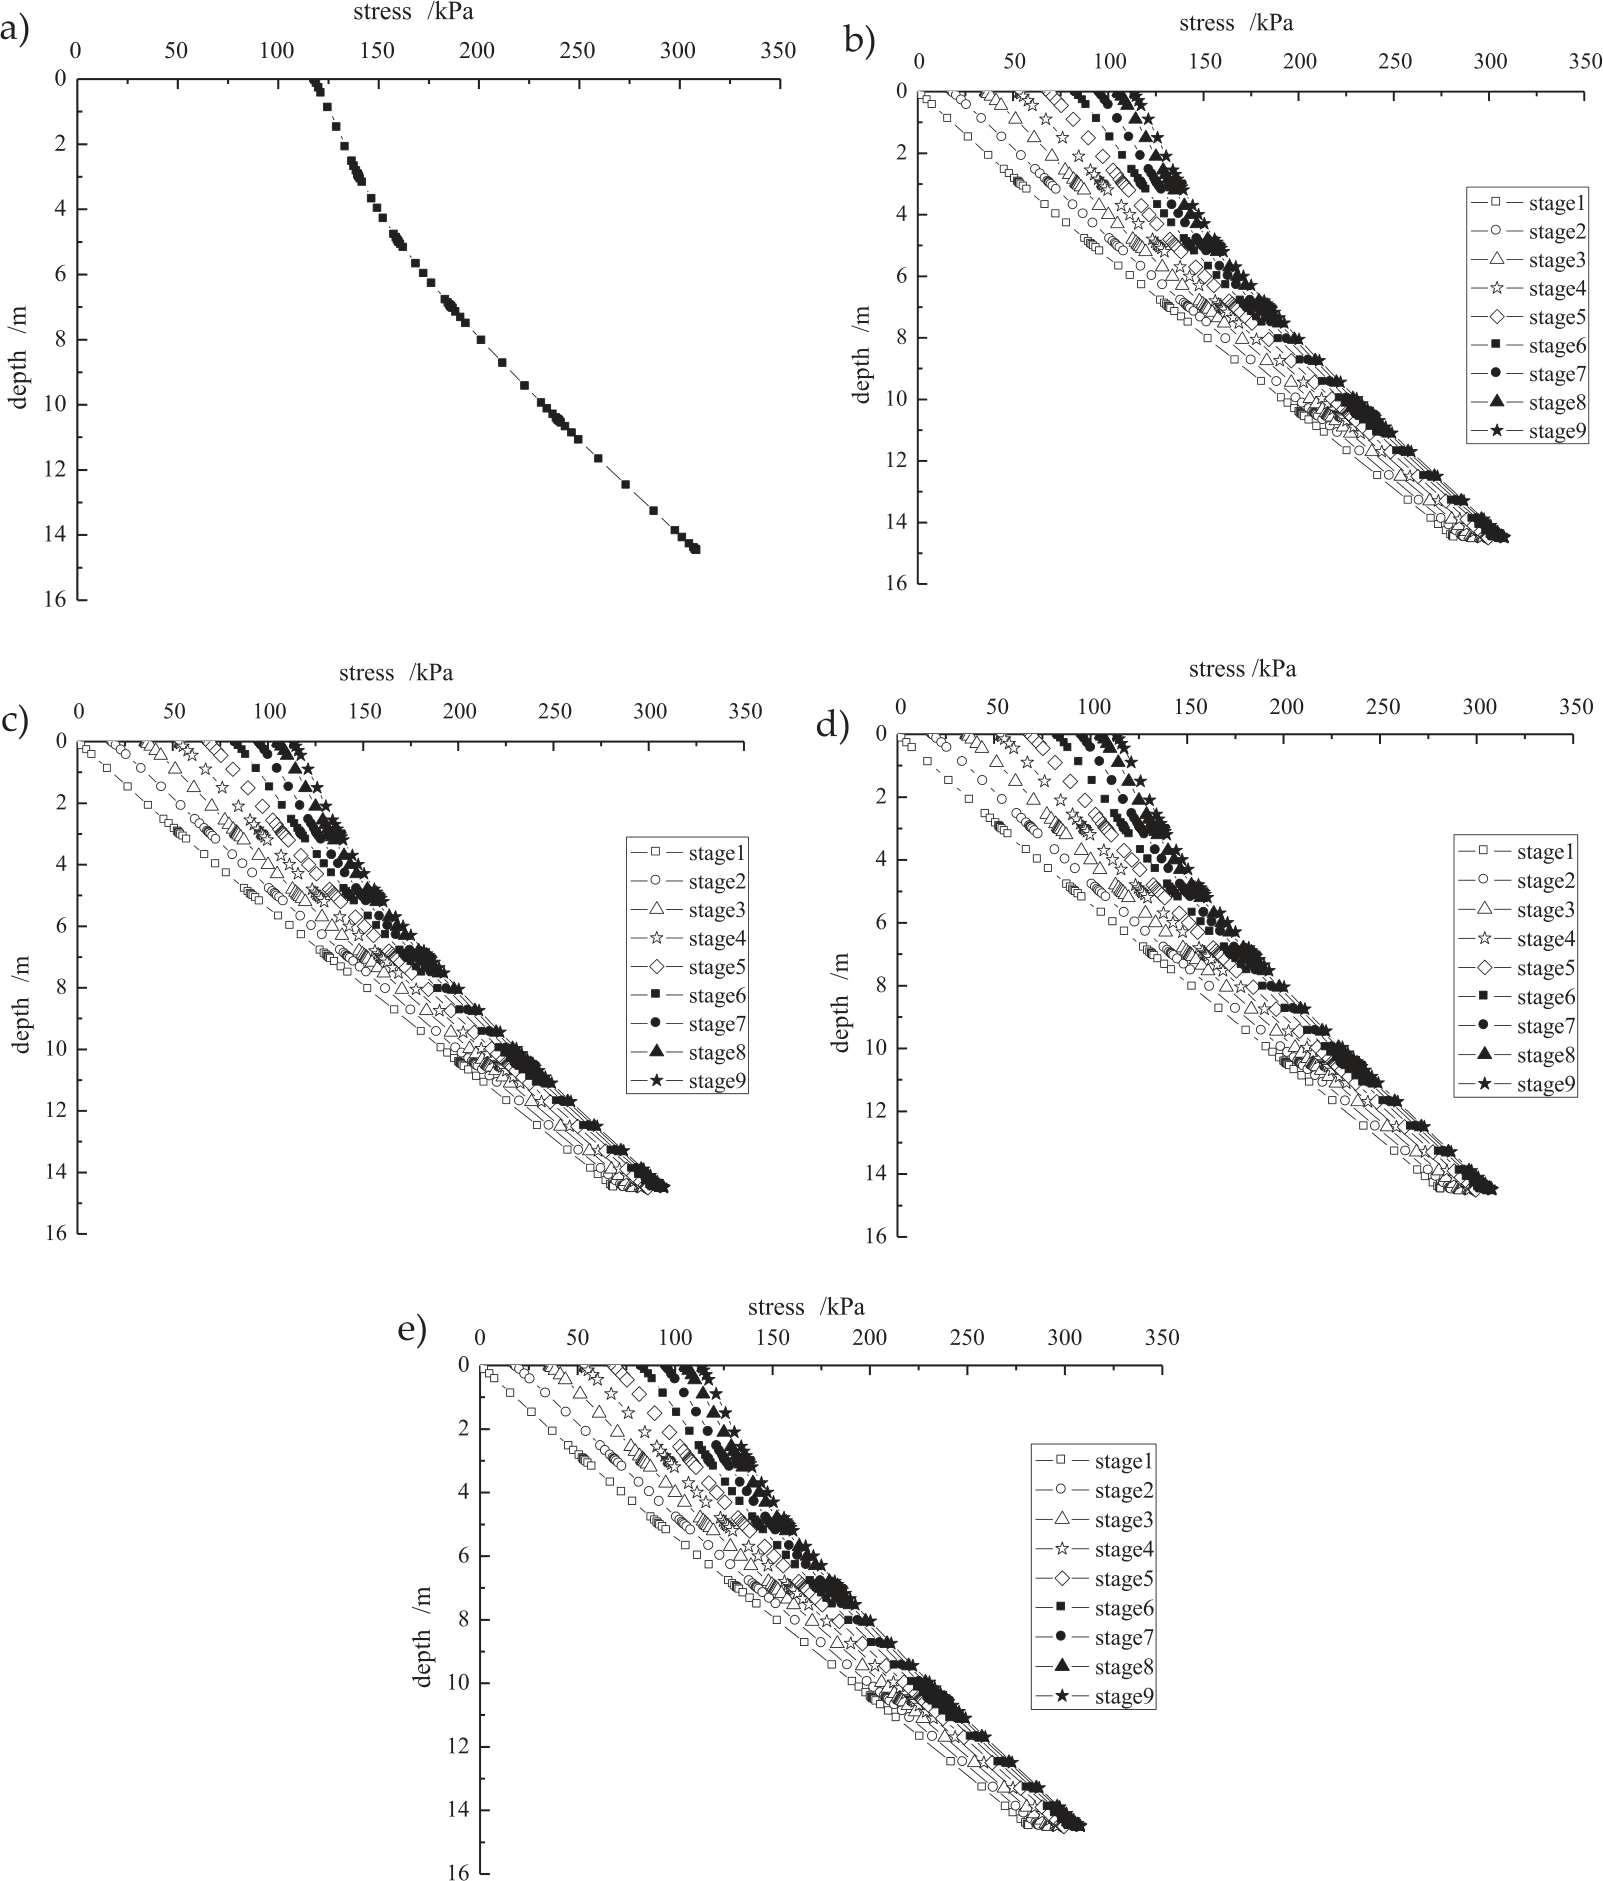
For the layered filling, the depth-stress curves of previous six layers are similar to a straight line, but began with the filling layer 7, the curve could be regarded as two straight lines composition: depth of 0-4 m is regarded as the first stage, depth of 4-14.5 m is regarded as the second stage, which the former slope is slightly bigger than the latter. It indicated that in the depth of 0-4 m, with the increase of depth, the stress increasing rate gets smaller and bigger in 4-14.5 m. In short, there were little differences in the biggest stress value no matter of overall filling or layered filling. It indicated that the backfill interval time had low impacts on the changes of stress.
Analysis of Settlement
The variation nephogram of settlement of the whole section was shown in Fig. 10, and the distribution curves of settlement were shown in Fig. 11.
Figs 10-11 showed that the depth-settlement relation of overall filling was different from layered filling. The maximum settlement value of overall filling was 35 mm. But for the layered filling, the settlement values slightly increased with the increase of interval time and the settlement value was greater than the overall filling. For the reasons, the overall filling, belongs to the instantaneous settlement because the pore water and pore gas are too late to discharge in unsaturated soil, so the settlement value also is small. But the layered filling, consolidation time increased with the corresponding interval time, the settlement values were bigger.
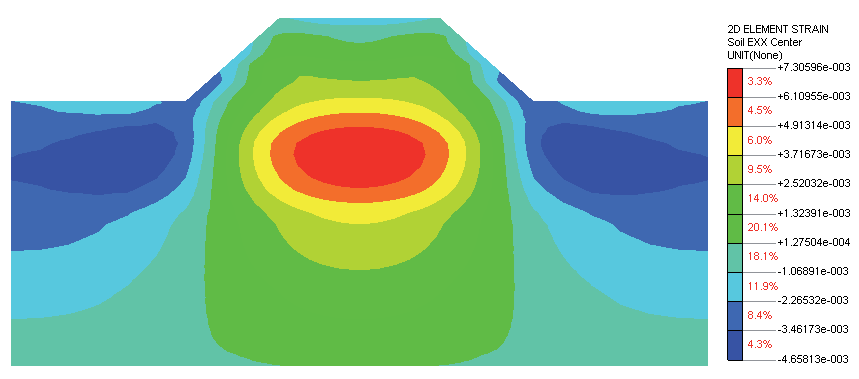
Fig. 11.
Curves of central depth-settlement: a) Overall filling (interval of 0d), b) Layered filling (interval of 5d), c) Layered filling (interval of 10d), d) Layered filling (interval of 15d), e) Layered filling (interval of 20d).
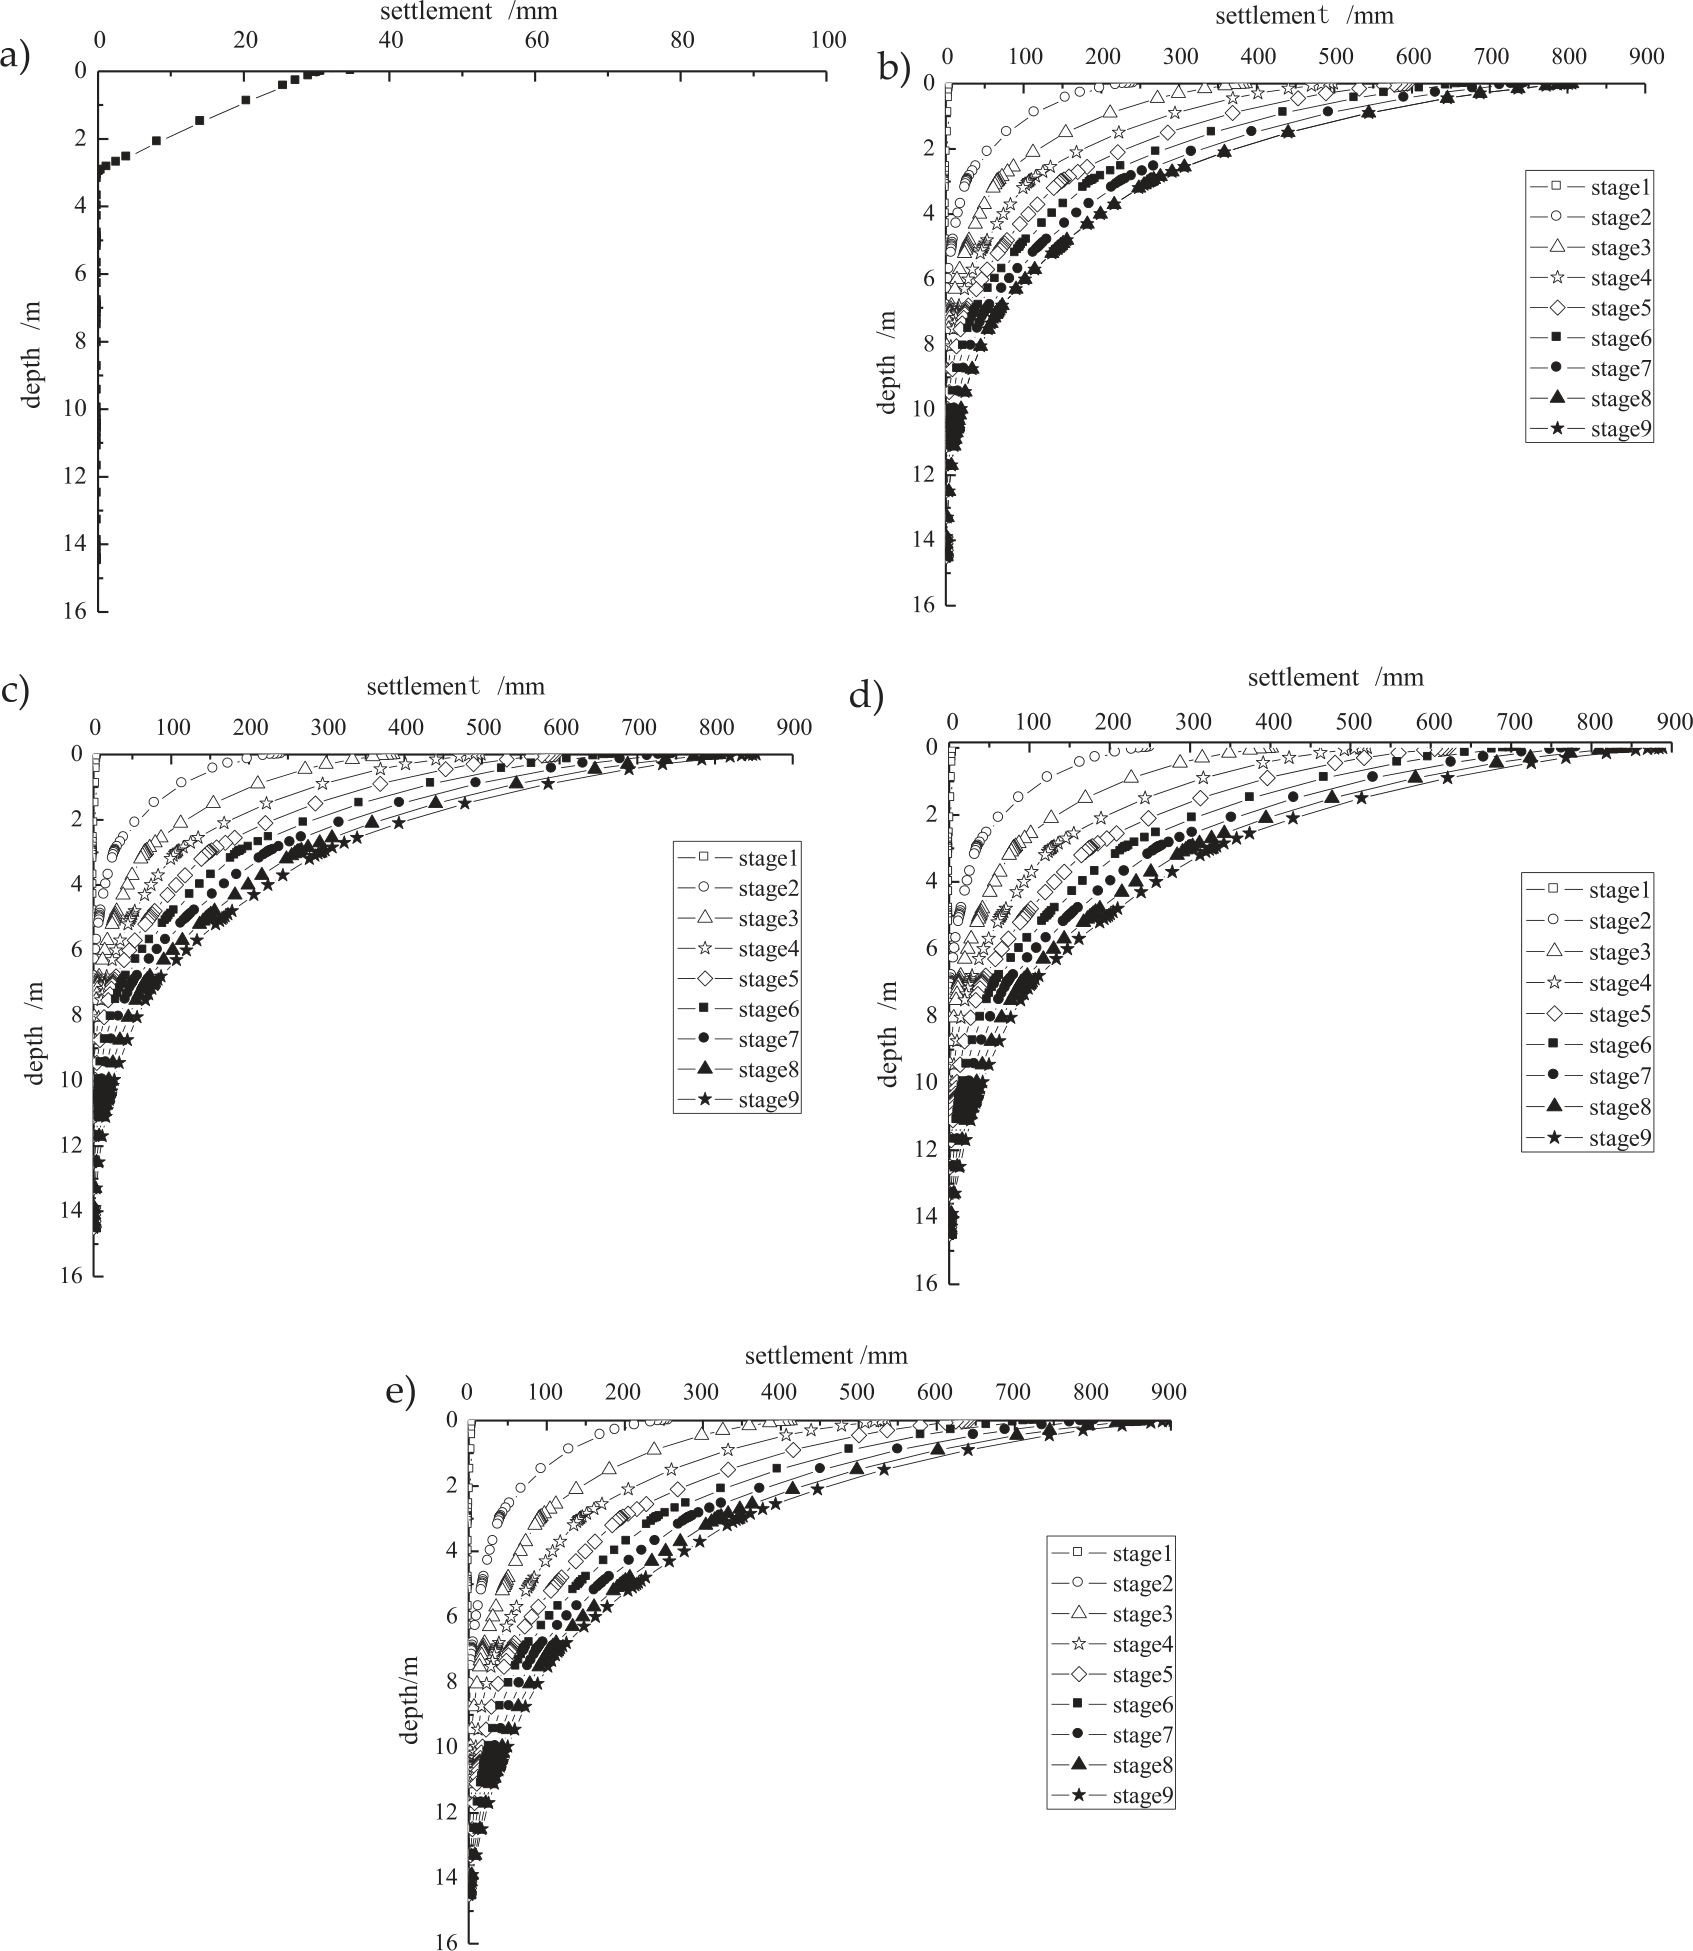
For the layered filling, depth-settlement curves of different intervals were similar, in overall tendency, the settlement value gradually decreased with the increase of the depth, the maximum settlement value appeared on the ground surface. As a result, both of two fillings could be approximately divided into two stages: at the depth of 0-2 m, the settlement decreased quickly with the increase of depth, but decreased gradually at the depth of 2-14.5 m.
Conclusions
The effect of embankment filling interval on the engineering characteristics of unsaturated cohesive foundation soil at a high-plateau airport was analyzed based on the one-dimensional consolidation theory and the VG model of SWCC of unsaturated soil. There can be obtained the conclusions as follows:
(1) The depth-stress curves with different interval time are similar, all of their stress decreased with the increase of depth. For the overall filling, the curve could be similarly looked as two straight lines: when depth is within 0~4 m, with the increase of depth, the stress increasing rate gets smaller; when depth is within 4~14.5 m, with the increase of depth, the stress increasing rate gets bigger.
(2) For the layered filling, the depth-stress curves of previous six layers are similar to a straight line, but began with the 7th filling layer, the curve could be regarded as two straight lines composition: at the depth of 0~4 m was regarded as the first stage and the second stage at the depth of 4~14.5 m. The former slope is slightly bigger than the latter. It indicated that in the depth of 0~4 m, with the increase of depth, the stress increasing rate gets smaller and bigger in 4~14.5 m. In short, there were little differences in the biggest stress value no matter of overall filling or layered filling. It indicated that the backfill interval time had low impacts on the changes of stress.
(3) The depth-settlement relation of overall filling is very different from layered filling. For the overall filling, the pore water and pore gas are too late to discharge in unsaturated soil. But for the layered filling, the corresponding consolidation time had been set up for the foundation soil. Therefore, the settlement values of layered filling were greater than the overall filling.
(4) For the layered filling, depth-settlement curves of different intervals were similar, in overall tendency, the settlement value gradually decreased with the increase of the depth, the maximum settlement value appeared on the ground surface. As the result, both of two fillings could be approximately divided into two stages: at the depth of 0~2 m, the settlement decreased quickly with the increase of depth, but decreased at the depth of 2~14.5 m.

