

Introduction
The 2022 Central Rural Work Conference of China proposed strengthening the comprehensive management of agricultural non-point source pollution and promoting rural ecological revitalization. Green control technology, based on the principles of “public plant protection” and “green plant protection,” is a technical concept formed under the guidance of the plant protection policy of “prevention first, comprehensive control” [1]. The promotion and application of green control technologies in agriculture are vital for ensuring the quality and safety of agricultural products, addressing agricultural pollution at its source, and driving high-quality agricultural development.
The tea industry is a pillar industry for poverty alleviation and rural revitalization in China, playing a significant role in achieving common prosperity [2]. At the same time, as a healthy beverage, tea has a wide consumer base in China, and the issue of pesticide residues has long been a concern. Throughout the process of tea plantation management, the widespread application of green prevention and control technologies ensures a higher quality of tea leaves, fostering consumer confidence and, consequently, elevating their willingness to pay. Ultimately, this dynamic enhances the prosperity of tea growers by increasing their income. Furthermore, it helps implement the Party’s strategy of consolidating and expanding the achievements of poverty alleviation and effectively linking them with rural revitalization, thus advancing the important goals of common prosperity and sustainable economic and social development.
Changes in income are a primary concern for farmers during the process of technology adoption. Can the adoption of green control technologies lead to income growth? What heterogeneity effects will the adoption of green control technologies have on different value-added segments of the tea value chain? Answering these questions is crucial for promoting the further adoption of green control technologies and holds significant practical and academic value.
Therefore, this paper utilizes fixed observation points from the National Tea Industry Technology System of China, selecting data from 2,155 tea farmers in 70 major tea-producing cities across 16 tea-producing provinces in 2016. Through the use of an endogenous transformation model, it explores the impact of the adoption of green control technologies on tea farmers’ income.
Literature Review
In recent years, scholars have paid great attention to the impact of agricultural technology adoption on farmers’ income. For instance, Rejesus et al., using propensity score matching, found that the adoption of water-saving irrigation technology effectively improved irrigation water efficiency and subsequently increased farmers’ income [3]. Liu et al., employing a three-stage least squares and mediation effect model, revealed that the adoption of agricultural machinery services significantly reduced land transfer-out and increased land transfer-in, thus helping farmers increase their income [4]. Himmelstein et al., through empirical analysis of the income of farmers with different initial endowments, identified scientific fertilization technology as an important means to promote grain yield increase and farmers’ income [5]. Chivenge et al., based on survey data from family farms engaged in planting in sub-Saharan Africa, demonstrated the positive income effect of site-specific nutrient management technology, which significantly enhanced agricultural income [6]. Hu et al., in their study on the rice-crayfish co-cultivation model in China, found that ecological agricultural practices had a significant impact on increasing agricultural income [7].
With the introduction of top-level designs and policy concepts regarding ecological civilization construction in China, research related to green control technologies has been increasing. Qing et al., based on data from rice farmers in Sichuan Province, showed that the adoption of green control technologies significantly improved rice farmers’ economic benefits [8]. Li et al., utilizing factor analysis and analyzing data from vegetable farmers in Shouguang, Shandong Province, found that the adoption of green control technologies had a certain impact on farmers’ income [9]. Li et al., using structural equation model to analyze fruit farmers in Shaanxi Province, concluded that increasing government subsidies for green control technologies would promote their adoption by fruit farmers and, consequently, increase their income [10]. In the context of the tea industry, Lou et al., through micro-level data analysis of tea farmers in the Dabie Mountain area, found that the adoption of green control technologies significantly increased agricultural income for farmers in mountainous areas [11]. Xie et al., based on survey data from tea growers in Fujian Province, revealed that the adoption of green production technologies increased the expected income of tea farmers [12]. Hu et al., in their study on the welfare level of tea farmers in the main tea-producing areas of Sichuan Province, found that the adoption of green control technologies significantly improved tea farmers’ profits per mu of tea, disposable household income, and living consumption expenditure [13]. However, there is still some controversy in the academic community regarding whether the adoption of green control technologies promotes farmers’ income. Huang et al., in their investigation and research on rice farmers in Hubei, Jiangxi, and Zhejiang provinces, concluded that the improvement in cost-benefit resulting from the adoption of green control technologies was not significant [14]. Malacrinò et al., in their study on 24 long bean farms in Cambodia, found no significant improvement in farmers’ income from the adoption of green control technologies [15].
Although there have been relevant studies as mentioned above, several issues remain to be addressed. First, most studies are based on small-scale regional data [16-18], with limited coverage and sample size. While some scholars have delved into research on the relationship between green prevention and control technologies and changes in tea farmers’ income [19- 21], the studies’ scope is primarily confined to a single province or region. These studies often encompass a limited number of households, which introduces certain constraints. Second, there is a lack of differentiation in income sources for tea farmers. Many tea farmers engage in multiple income-generating activities [22], not just tea production. Failure to distinguish income sources as explanatory variables can lead to overestimation or underestimation of income effects. Third, inappropriate selection of instrumental variables. Although instrumental variables have been used to address endogeneity issues, the use of regional averages as instrumental variables may introduce noise and potential omitted variable bias [24], as these aggregated data cannot guarantee complete exogeneity. Fourth, there has been limited research on the impact of green control technologies on tea farmers’ income from the perspective of value chains or division of labor.
This study aims to address these issues. Firstly, it employs a large sample of data that covers nearly 90% of tea-producing regions nationwide, which enhances the representativeness and generalizability of the findings. Secondly, it separates tea income from overall agricultural income, enabling a more accurate assessment of the net effects of adopting green control technologies. Thirdly, it further disaggregates tea income into income from fresh tea and income from processed tea, allowing for an evaluation of the impacts of green control technologies on different value chain segments of the tea industry. Finally, it uses farmers’ awareness of pesticide residue limits for tea and their participation in pest and disease control technology exchange with other tea farmers as instrumental variables, satisfying the exogeneity and relevance conditions and passing relevant tests, thereby enhancing the reliability of the estimated results.
Theoretical Framework and Model Construction
Theoretical Framework
Chen Zongmao [25] pointed out that the large-scale use of chemical pesticides in tea gardens since the 20th century has led to five major changes in pest populations nationwide, with a significant reduction in beneficial biological populations in some areas and an increasing cost of pest control. Furthermore, the issue of pesticide residues in tea leaves has severely hindered the export of Chinese tea. The adoption of green control technology not only promotes the restoration of ecological levels in tea gardens but also enables higher premiums through improved raw material quality, thereby increasing tea farmers’ income. Therefore, this paper proposes the following hypotheses 1:
H1: Compared to tea farmers who have not adopted green control technology, tea farmers who have adopted green control technology show a significant increase in their tea leaves income.
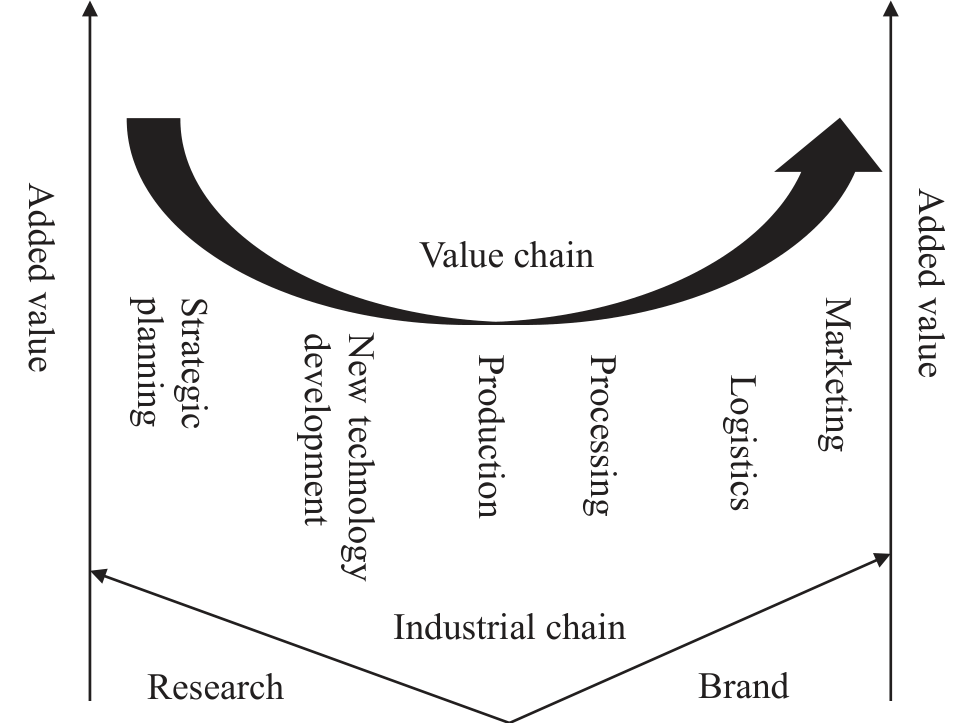
The agricultural value chain can be roughly categorized into six value-added stages (as shown in Fig. 1), presenting an upward-opening U-shaped structure [26]. The production stage, represented by cultivation, is at the bottom of the value chain, with relatively lower growth rates in the value-added process of agricultural products. On the other hand, the processing and marketing stages hold advantageous positions in value addition. Tea farmers’ income mainly consists of sales revenue from fresh tea leaves and processed tea. The sales of fresh tea leaves correspond to the production stage in the agricultural value chain and represent the lowest part of the overall value distribution. On the contrary, the sales of processed tea correspond to the processing stage, which is situated in a higher value-added position. Therefore, this paper proposes the hypothesis 2:
H2: The adoption of green control technology has differential effects on the income of different segments of the tea value chain, with a greater increase in income observed in the processed tea segment compared to the fresh tea leaves segment.
Model Construction
Drawing inspiration from several researches on tea farmers. [27-29], we begin by constructing a linear equation for the income of tea farmers derived from total tea sale (including fresh tea and processed tea):
Where Yi represents the income of tea farmers. Li is a dummy variable indicating whether tea farmer i has adopted green control technology, with Li = 1 for adoption and Li = 0 for non-adoption. controlsi represents a series of control variables related to tea farmers’ tea income. μi is the random error term. In this study, we use the endogenous switching regression (ESR) model for estimation, which consists of two parts: the selection equation that measures the factors influencing the adoption of green control technology, and the outcome equation that estimates the income changes of tea farmers in different scenarios by dividing them into the adoption and non-adoption groups. First, we establish the equation for tea farmers’ adoption of green control technology and the equation for determining their income.
Zi represents several factors that affect tea farmers’ technology adoption. According to the setting of the endogenous switching equation, Zi should include at least one variable that is different from the outcome equation and affects the adoption of green control technology but does not affect tea farmers’ income. Therefore, this study selects tea farmers’ awareness of the tea pesticide residue limit standard and whether they exchange pest control techniques with other tea farmers as the influencing variables for the adoption of green control technology. After testing, these two variables are significantly correlated with the adoption of green control technology by tea farmers and are not directly related to tea farmers’ income. Y1i represents the tea income of tea farmers who have adopted green control technology, while Y0i represents the tea income of tea farmers who have not adopted green control technology. controlsi represents a series of control variables that may affect tea farmers’ income. μi is the random error term. Based on Equation (1), after introducing the two variables that influence tea farmers’ technology adoption, the equation for determining tea farmers’ income is adjusted as follows:
λi is the inverse Mills ratio calculated based on Equation (2) and is included in the outcome equation to correct for bias caused by self-selection issues. σ∈ represents the covariance of the error term, and τi is a random error term with a mean of 0. From this, we can obtain the average treatment effect on the treated (ATT) for the adoption of green control technologies and the average treatment effect for the untreated (ATU) under counterfactual conditions:
Interpretation of Data and Variables
Data Sources
The Chinese mainland (excluding Taiwan) consists of 18 tea-producing provinces, stretching from Shandong in the north to Hainan in the far south, with the majority of tea regions located south of the Qinling Mountains and the Huai River. The data for this study are sourced from the survey conducted by the National Tea Industry Technology System (of China) on the adoption of green control technologies in 2016. The survey covered 16 major tea-producing provinces: Yunnan, Guizhou, Sichuan, Hubei, Fujian, Zhejiang, Anhui, Hunan, Shaanxi, Henan, Jiangxi, Guangxi, Guangdong, Chongqing, Jiangsu, and Shandong. It encompassed 70 tea-producing cities, accounting for 88.89% of the total tea production area nationwide, ensuring the sample’s representativeness. After excluding questionnaires with high rates of missing data and obvious outliers, a total of 2,155 valid questionnaires were obtained. Among them, 1,408 households (65.34% of the total sample) adopted green pest control technologies, while 747 households (34.66% of the total sample) did not.
Variable Definition and Descriptive Statistics
Table 1 presents the codes and definitions of the variables, while Table 2 provides the descriptive statistics of each variable. The dependent variable is tea farmers’ income, which is distinguished from the overall household income to measure the net effect of adopting green control technologies. To mitigate the influence of outliers, the natural logarithm of tea income is taken. In robustness tests, we replace the dependent variable with per capita tea income. Furthermore, tea income is disaggregated into green tea income and processed tea income, to determine the differential income effects of adopting green control technologies across different value-added stages of the tea value chain.
The key explanatory variable is whether the tea farmer adopt green control technologies, where 1 represents “Yes” and 0 represents “No”. In the survey conducted by the National Industry Technology System, the main observed green control technologies used in tea gardens include manual killing, color boards, biological pesticides, and insecticidal lamps. Among the 2155 samples, 1408 tea farmers adopted at least one of these green control technologies, accounting for 65.34% of the total, while 747 tea farmers did not adopt any green control measures, accounting for 34.66%.
Table 1.
Variable definitions.
Table 2.
Descriptive statistics.
This study also incorporates individual characteristics of household heads, household operational characteristics, and regional characteristics as control variables that are related to tea farmers’ tea leaves income. From the descriptive statistics, it can be seen that the average age of the sample household heads is 51.19 years, with a predominance of middle-aged and elderly individuals, and over 90% are male. Only 27.3% have a high school education or above, indicating a relatively low level of education overall. About 66% of tea farmers participate in cooperatives, and the average tea garden size is 28.584 mu (approximately 1.9 hectares), with an average of 2.8 laborers per household.
Model Estimation Results and Analysis
Income Effect
This paper employs an ESR model to assess the impact of adopting green control technologies on tea farmers’ tea leaves income (as shown in Table 3). The results indicate that the Wald test statistic and lnσ1 are significant at the 1% level, suggesting that the adoption of green control technologies by tea farmers is influenced by unobservable factors, indicating the presence of self-selection bias in the sample. This highlights the rationale for using the ESR model to estimate the income effects of green control technologies.
Table 3.
Estimates of the impact of adopting green control technologies on tea farmers’ income.
Explanation of the Selection Model Results
From the estimated results of the selection equation (as shown in Table 3), it can be observed that variables such as participation in cooperatives, tea production region, communication with other tea farmers on pest control techniques, and awareness of green control technologies significantly influence the adoption of green control technologies. The positive correlation between participation in cooperatives and the adoption of green control technologies at the 1% significance level indicates that tea farmers who are members of cooperatives are more likely to adopt green control technologies. Compared to other technical training providers, cooperatives provide practical and targeted training programs, which greatly enhance farmers’ adoption of green production techniques. The tea production region also affects the adoption of green control technologies by tea farmers, with farmers in South China, Jiangnan, and Jiangbei tea regions showing lower enthusiasm for adopting green control technologies compared to those in the Southwest tea region. The significant positive correlation at the 1% level between communication with other tea farmers on pest control techniques, awareness of green control technologies, and the adoption of green control technologies indicates that these factors play important roles in influencing farmers’ adoption decisions. This demonstrates the effectiveness of the selection model results.
Explanation of the Income Determination Equation Results
From the estimated results of the income determination equation (as shown in Table 3), it can be observed that regardless of whether farmers adopt green control technologies, tea leaves income is significantly positively correlated with tea garden area, the number of family laborers, internet access by the household head, and the tea production region. This finding can be explained by several factors. Larger tea garden areas are associated with economies of scale, and having more family laborers allows for increased input in tea production and operation, resulting in higher tea leaves output. Internet access is increasingly important for acquiring production and marketing information, and there is a growing body of literature suggesting that internet skills can help farmers reduce production costs and expand agricultural profits. The Southwest tea region, including provinces such as Yunnan, Guizhou, Sichuan, and Tibet, lags behind other tea regions in terms of economic development, which also affects the tea leaves income of tea farmers in the Southwest region.
Explanation of the Control Variables Results
Among farmers who adopt green control technologies, tea leaves income is also related to the age, gender, and educational level of the household head. Older household heads with lower educational levels may have poorer absorption and understanding of new technologies, which can impact overall tea leaves income. Male household heads, compared to female household heads, tend to allocate more energy to agricultural production activities, which is beneficial for increasing tea production and income.
Among farmers who do not adopt green control technologies, tea leaves income is related to whether they are members of cooperatives. Research by Lei et al. indicates that cooperatives provide support in terms of capital and human capital, enhance individual farmers’ bargaining power, expand the market for agricultural products, and promote income growth among farmers [30].
Estimation of the Average Treatment Effect in Two Scenarios
The average treatment effect on the treated (ATT) and the average treatment effect on the untreated (ATU) of the adoption of green control technologies on tea farmers’ income were calculated using equations (7) and (8) as mentioned above. The calculations yielded an ATT of 0.399 and an ATU of 1.705. This means that tea farmers who adopted green control technologies experienced an average income increase of 0.399 units, corresponding to a 4% change, while tea farmers who did not adopt green control technologies would have an income increase of 1.705 units, representing a 16.6% change if they were to adopt the technologies.
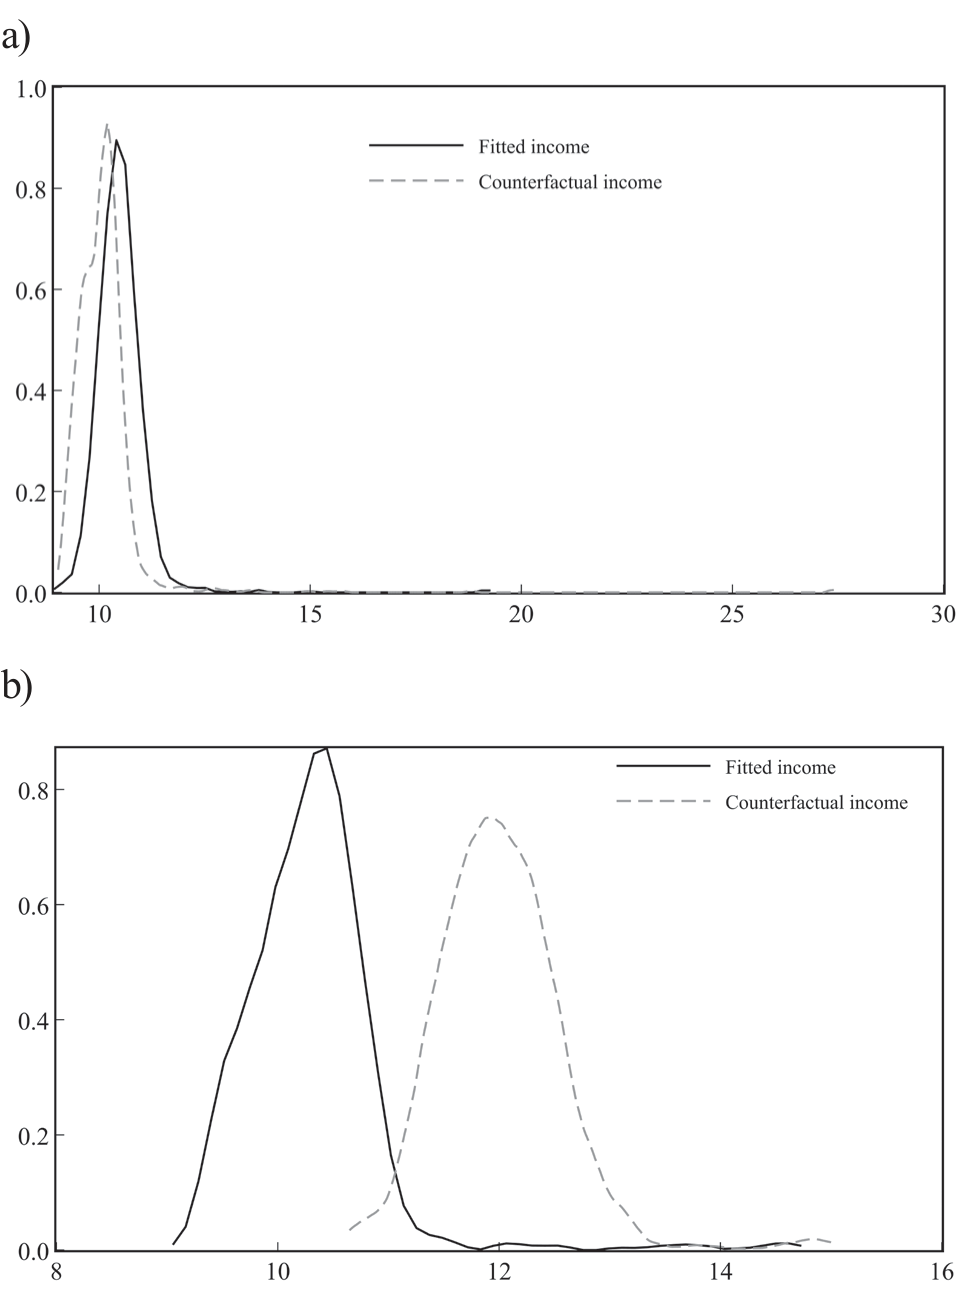
To provide a more intuitive reflection of the impact of adopting green control technologies on tea farmers’ income, the study also plotted the fitted income and counterfactual income probability density distributions for farmers who adopted and those who did not adopt green control technologies. Fig. 2a) shows that for tea farmers who adopted green control technologies, their income probability density distribution curve would shift from the solid line segment to the dashed line segment if they had not adopted the technologies, indicating a significant overall decrease in income. Fig. 2b) shows that for tea farmers who did not adopt green control technologies, their income probability density distribution curve would shift significantly from the solid line segment to the dashed line segment if they were to adopt green control technologies, indicating a substantial income increase associated with the adoption of green control technologies. This confirms the validity of hypothesis 1.
Robustness Test
To ensure the robustness of the results, this paper followed the methodology of Wu et al. [31], Jin et al. [32] and Li et al. [33], conducted tests by replacing the dependent variable and changing the estimation methods. The tests were performed using ordinary least squares (OLS), instrumental variable (IV) estimation, and treatment effects model (TEM). As shown in Table 4, the estimation results from all four methods consistently indicate a significant positive impact of adopting green control technologies on tea farmers’ income at a 1% significance level, further validating the conclusion that the adoption of green control technologies promotes tea farmers’ income. In the instrumental variable model, cognitive factors and technology exchange were used as instrumental variables, with a Hansen J-value of 0.257, which does not reject the null hypothesis, satisfying the exogeneity assumption of instrumental variables. Additionally, the first-stage F-value is significantly greater than 10, satisfying the relevance assumption of instrumental variables, indicating the appropriateness of instrumental variable selection.
Table 4.
Comparison of estimation results by different methods.
| Project | ESRM | Treatment effect (TEM) | IV | OLS |
|---|---|---|---|---|
| Regression coefficient (ATE) | 1.22*** | 1.257*** | 0.195*** | |
| ATT | 0.399*** | |||
| ATU | 1.705*** |
Table 5.
Impact of the adoption of green control technologies on per capita tea income.
This paper also conducted a re-estimation by replacing the dependent variable with per capita tea leaves income. The estimation results show that the adoption of green control technologies is significantly correlated with tea farm size, membership in cooperatives, tea-growing regions, cognitive factors, and technology exchange. For tea farmers who adopted green control technologies, tea leaves income is significantly correlated with age, gender of the head of the household, tea farm size, education level of the head of the household, and internet usage in tea plantation region. For tea farmers who did not adopt green control technologies, tea leaves income is significantly correlated with tea farm size, membership in cooperatives, number of family laborers, education level, internet usage, and tea-growing regions. The estimation results are consistent with the baseline regression results, indicating the robustness of the estimates, as shown in Table 5.
Differences in the Revenue Increase Effect of Technologies Adoption on Different Parts of the Value Chain
To clarify the heterogeneous effects of income improvement on different stages of the value chain, this paper further disaggregated tea farmers’ income into income from tea leaves sales and income from processed tea sales, and estimated them separately using the ESR model. The estimation results are presented in Table 6.
Table 6.
Impact of green control technologies adoption on tea green and dry tea revenue.
| Type of farmer | Tea leaves income | Processed tea income | ||||
|---|---|---|---|---|---|---|
| ATT | ATU | Range of change | ATT | ATU | Range of change | |
| Adopt | 0.365*** | 3.752% | 0.560*** | 5.656% | ||
| Not Adopt | 1.828*** | 18.797% | 2.819*** | 27.395% | ||
The average treatment effect on tea leaves income from adopting green control technologies (ATT) is 0.365 units, resulting in a 3.752% income increase for tea leaves sales. The ATT for income from processed tea sales is 0.560 units, leading to a 5.656% income increase. The income improvement effect of green control technologies on tea leaves sales is significantly lower compared to processed tea sales. In the counterfactual scenario, the average treatment effect on tea leaves income (ATU) from adopting green control technologies is 1.828 units for tea leaves sales and 2.819 units for processed tea sales, resulting in income increases of 18.797% and 27.395%, respectively.
Further analysis reveals that the adoption of green technologies has a significant income improvement effect on both tea leaves sales and processed tea sales, but the effect is more pronounced for processed tea. Additionally, the sample statistics show that tea farmers who only sell tea leaves have an average tea garden size of 13.2 mu, significantly smaller than the 49.59 mu for tea farmers who sell processed tea, indicating a characteristic of small-scale operations. This suggests that tea farmers who only sell tea leaves struggle to achieve economies of scale and have weaker bargaining power in tea leaves sales. For tea leaves buyers, it is challenging to identify the adoption of green technologies by small-scale farmers, which further affects the income growth of this group of tea farmers. On the other hand, processed tea is directed towards the end market, and consumers generally have a higher willingness to pay for green and organic agricultural products. For example, Zhou et al. [34] found that consumers’ willingness to pay for green agricultural products was higher than for regular agricultural products by using eco-labels of rice as an example. This indicates that the value-added in the production stage of the tea value chain is lower than in the processing and marketing stages, confirming hypothesis 2.
Conclusions
This paper employs the ESR model to empirically analyze the production and operation data of 2,155 tea farmers from 16 major tea-producing provinces in China, aiming to investigate the income improvement effect of adopting green control technologies. The following outcomes can be derived:
(1) The adoption of green control technologies significantly promotes tea farmers’ income growth. The analysis using the endogenous switching model reveals a clear income improvement effect of adopting green control technologies for tea farmers, which is also significantly influenced by individual, household, and regional characteristics.
(2) The awareness of tea farmers regarding tea leaf pesticide residue standards and their exchange of pest control techniques with other tea farmers significantly enhance the adoption of green control technologies. The empirical analysis shows that higher levels of awareness of tea leaf pesticide residue standards and more frequent exchange of pest control experiences with other tea farmers lead to a higher likelihood of adopting these technologies.
(3) The income effects of adopting green control technologies vary across different stages of the value chain, with a lower income improvement magnitude observed in the cultivation stage compared to the processing and marketing stages. The empirical analysis reveals that adopting green control technologies has significant income improvement effects for both tea leaves and processed tea sales, but the income improvement magnitude is relatively higher for processed tea.
Drawing from the conclusions mentioned above, this paper presents several recommendations:
(1) Increase the promotion of green control technologies and enhance farmers’ willingness to adopt them. The adoption of green control technologies by tea farmers depends on whether they can achieve increased output and profits from these new technologies. Therefore, it is important to understand the local farmers’ needs and adoption willingness during the promotion process [35]. Conducting technology demonstrations can effectively guide tea farmers in understanding and adopting green control technologies [36].
(2) Promote education and training on green control technologies for tea farmers. Farmers with higher levels of education and awareness tend to have a stronger willingness to adopt new agricultural technologies [37- 39]. Therefore, supporting tea farmers in continuous learning and experience accumulation, improving their cultural and scientific literacy, can help them better perceive the income improvement benefits brought by green control technologies and empower them with a proactive attitude.
(3) Ensure fair distribution of benefits along the agricultural value chain. Actively build mechanisms that connect the interests of enterprises and farmers, with farmers’ professional cooperatives as the link, to facilitate the integration of small farmers into larger markets and safeguard their operational profits [40]. Optimize and strengthen the agricultural value chain and allocate the benefits of the value chain’s various segments fairly. Explore multiple channels to expand farmers’ income opportunities and enable them to gain a sense of achievement and happiness through collaborative and shared development. Encourage farmers to participate in the division of labor within the industry chain, ensuring that more sales profits stay with the farmers.
(4) Increase promotion efforts for green control technologies at the consumer end of the market. Enhance consumer awareness and guide them to consume more green and ecological products. By increasing the premium level of green agricultural products, the intrinsic motivation for tea farmers to adopt green control technologies can be strengthened.
Certainly, this paper still exhibits several limitations. First, there is a multitude of factors influencing the adoption of green prevention and control technologies by tea growers. The presence of these latent influencing variables, which this paper cannot comprehensively control, to some extent diminishes the precision of the results. Second, the paper does not make a distinct differentiation between adoption intention and adoption behavior. In reality, the process from a farmer’s willingness to adopt eco-friendly farming to the actual behavior is influenced by various factors, potentially leading to deviations between intention and behavior. Third, new formats and new trends have emerged. Modern communication technologies have propelled rural informatization, and farmers’ social networks, influenced by information technology, have extended from real-world interactions to online communications, indicating a digital transformation. Whether the adoption behavior and income effects of green prevention and control technologies among farmers will undergo a transformation in this digital context remains a topic for future research.

