

Introduction
Among the cereals used as a source of energy in human nutrition, wheat (Triticum L.) ranks first in the world with 215.9 million ha of cultivated area and 766 million tons of production due to its great adaptability [1]. Triticum durum Desf., Triticum compactum Host (known as club wheat) and T. aestivum (known as common or bread wheat) together account for nearly 90 percent of overall world wheat production [2]. Common wheat/bread wheat (T. aestivum) is considered an important crop (cereal) and is a major component of bread [3]. Wheat is used as a staple food worldwide and is an important source of dietary fiber and B vitamins due to its favorable nutritional value and ease of storage and processing. Wheat is an important crop for the economies of many countries and provides 20% of the vital calories and 20% of the protein source for more than 4.5 billion people in 94 developing countries [4]. Overall, 95% of people in developing countries rely on flour from wheat or maize as their primary source. A variety of foods, including bread, chapattis, cakes, cookies, and confectionery are made from it. In recent years, it is grown on the largest cultivated area in Pakistan [5]. During the last few decades, better progress has been made in increasing the unit area yield of wheat in the country [6]. In 2018, it was grown on an area of 8.7 million ha in Pakistan with a production of 250 million tonnes in Pakistan [7]. However, among the biotic factors, rust diseases caused by Puccinia species belonging to the order Uredinales in the Basidiomycetes class threaten wheat production around the world. One of the most important species causing rust diseases in wheat is stripe (yellow) rust, caused by Puccinia striiformis West., and leaf (brown) rust, caused by Puccinia triticina, which are biotrophic fungi and cause significant crop losses and quality degradation depending on the growing area [8-10]. It causes yield and quality losses by suppressing photosynthesis in the infected leaves and especially in the flag leaf [11]. It is estimated that 5 million tons of product are lost annually and the market value of this lost product is $1 trillion [12, 13]. Chemical sprays used to control these diseases affect the biological environment, disturb the balance, and may even enter the food chain and have toxic effects on humans. Considering all these negative aspects, genetic resistance of crops in disease control is an alternative approach preferred by producers as a convenient, cost-effective and practical control method. Therefore, it is of great importance for breeding to determine the presence of resistant and susceptible wheat varieties to rust diseases and evaluate them in production [14].
It is noteworthy that, if conventional methods, technologies or practices are applied to wheat cultivation in the South Asian zone, there is a high probability that yields will decrease by almost 30% [15]. The most important goal of bioscientists is to develop new varieties that have all three qualities, i.e. high productivity, stability, and good nutritional quality, and also to avoid yield loss in the near future, as mentioned above [16]. To achieve this, we need to vary and broaden the genetic base of our germplasm to include them in breeding programs, because genetic differentiation/ variation of plants determines their ability to potentially increase efficiency and thus their use in different breeding programs, ultimately leading to an increase in food production by plants [17]. Furthermore, in plant breeding programs, direct and morphological selection of crops for grain or leaf yield can be misleading because of the factors mentioned above. Thus, the most successful and accurate method of selection depends on background information about crop stability, morpho-agronomic traits, and genetic variation [18, 19]. Improving germplasm by using molecular markers such as SSRs for genetic diversity is considered critical for sustainable, reliable, and efficient food crop production [20-23]. Measuring the extent of accessible genetic diversity is critical for efficient evaluation and utilization of germplasm. An essential tactic for classifying the germplasm and analyzing the genetic links among the breeding material is the use of multivariate statistical algorithms [5]. Some other suitable methods are stability analysis, cluster analysis, PCA and correlation analysis for identifying genetic diversity, parental selection, tracing the evolutionary path of crops, center of origin and diversity and studying the interaction between environments are currently available [24, 25].
Fig. 1.
Principle component analysis for 40 SSRs gene markers used for genetic variations for wheat germplasm.
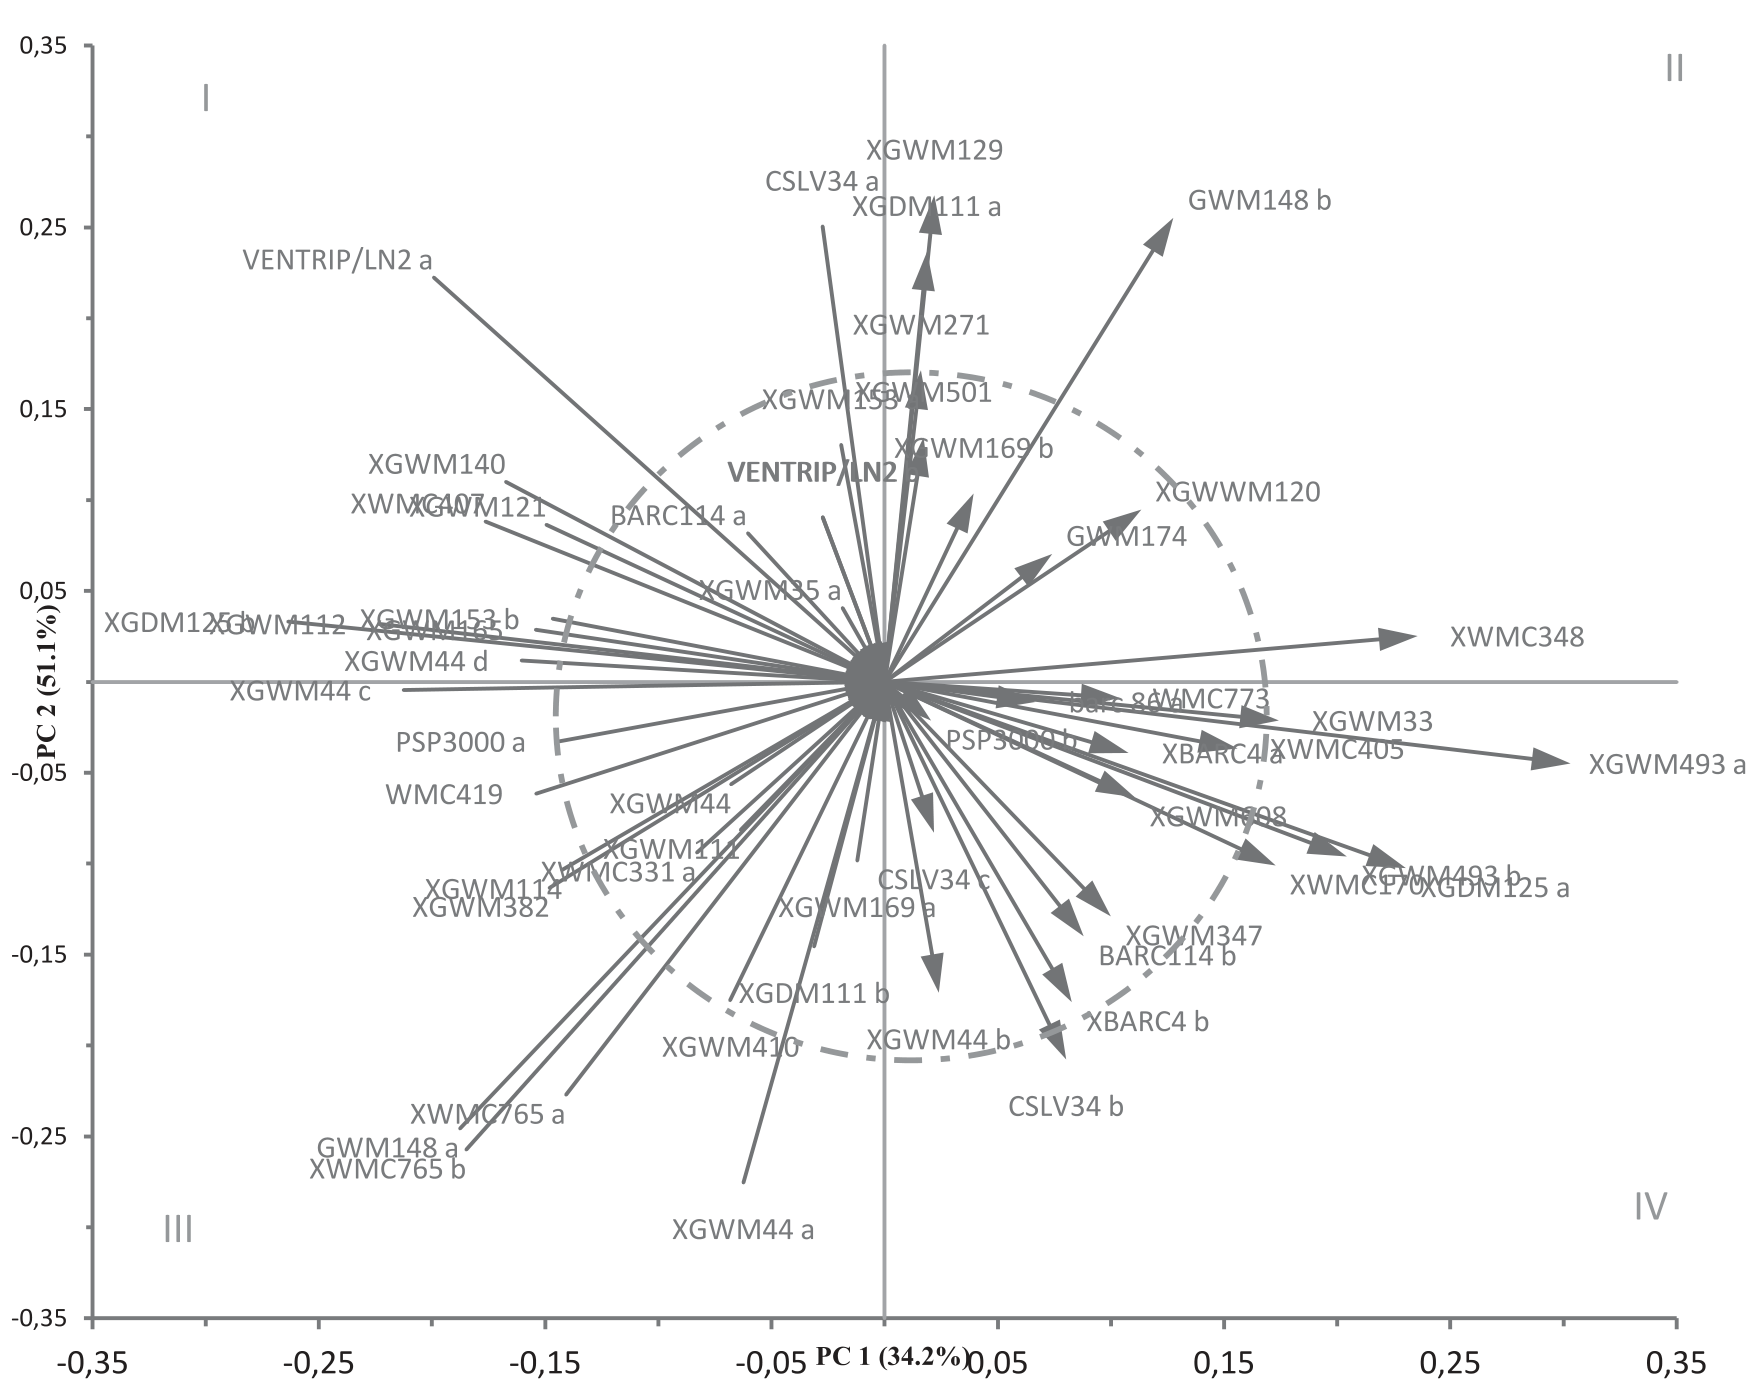
Simple sequence repeats (SSRs) or microsatellites, i.e. PCR-based molecular markers, have gained importance as genetic markers in a variety of crop species, including wheat. SSRs markers are more numerous, evenly distributed across the genome, and more polymorphic than other genetic markers. These characteristics and their ease of recognition make them most suitable for detecting and distinguishing between accessions that are genetically very similar. SSRs markers have been used in several studies to investigate the genetic diversity of cultivated wheat genotypes of T. aestivum (hexaploid). [26]. The use of molecular markers to evaluate genetic variation has received considerable attention because they are not affected by environmental variation. Many scientists have studied the genetic diversity of common wheat using SSRs markers because of their high potential for use in evolutionary studies, genetic diversity, genetic relatedness, and genetic distances [27]. In the present study, genetic markers (SSRs) should be used to identify the genetic basis of wheat germplasm. In addition, the most suitable marker that might be able to identify rare alleles or detect the narrow or broad genetic base will also be reported by using cluster analysis, PCA, correlation and SSR gene marker comparison.
Materials and Methods
Bio-Resources Conservation Institute (BCI), National Agriculture Research Center (NARC), Islamabad, Pakistan provided the breeding material (official germplasm of Pakistan). The germination test (15 seeds of each accession) was done at lab for the selection of 50 best performing land races using Filter paper (Whatman filter paper No. 1) for experimental study and screening of huge breeding material [28]. Accessions with a higher germination rate, greater than 70%, were selected for further testing.
DNA Extraction and Molecular Marker Analysis
A total of 50 genotypes were grown in a tray at room temperature with an equal mixture of sand, farmyard manure, and clay when they were seven days old (Fig. 1). After one week, plant (seedlings) emerged, and they were utilized to isolate DNA. DNA was extracted using the procedure with some modification described by Doyle and Doyle [29] and Begum et al. [30]. Fresh and young leaves of all the accessions were finely ground in 3 mL of 2XCTAB buffer to extract DNA using a modified version of the CTAB technique methodology. The RNAse (2-3 µL) were added to the DNA pellet and incubated at 37ºC for one h to digest the RNA from the sample. Then centrifugation was performed at 12000 rpm for 12 min. Supernatant was then transferred to new tube by adding chloroform: isoamyl alcohol and inverted gently 4-5 times followed by centrifugation. Chilled iso-propanol was added afterwards and again incubated for 10 min at 4ºC. After centrifugation pellet was removed and washed with 75% ethanol and oven dried for 30 min. The pellet was resuspended in 100 μl of nuclease free water.
Table 1.
List of SSRs markers used for identifying genetic variation among 50 wheat lines.
Quality and Quantification of DNA
50 g of DNA in 0.8% agarose gel was used to examine the integrity and quality of the DNA during gel electrophoresis. The DNA isolation process was repeated on the samples with identifiable smear in the gels. For DNA quantification (50 accessions) of wheat samples (in 5 replications) subjected to nano-drop for quantification by observing the OD values. The samples with OD value above 0.7 were selected for PCR analysis.
PCR Amplification of SSRs Markers
In the current investigation, 40 SSRs markers, including 12 polymorphic and 28 monomorphic markers, were employed (Table 1). For the purpose of determining the molecular basis of genetic diversity, SSRs markers (Primer Invitrogen) were employed. A commercially available kit (Thermo Fisher Scientific, Waltham, MA, Fermentas) was used to extract the DNA, and the procedure described by Begum et al. [31] was followed to perform the PCR (96 well-Applied Biosystems, Model-990, USA). The PCR was performed in 2 μL of 10 X-PCR buffer solutions, 4 μL of 2.5 mM dNTPs, 1.6 μL of 25 mM MgCl2, 1.5 μL of forward and reverse primers, 2.0 μL of genomic DNA, and 7.15 μL of double distilled water, for 20 μL of each reaction. The PCR was performed on an Advanced BioRAD-25 PCR machine.
Gel Electrophoresis/Band Visualization
TBE buffer was used to prepare the agarose gel, which was then stained with Ethidium bromide (EtBr) and visualized under UV light. For photographing, a UV-tec documentation system (made in the UK) was used. PCR products were resolved on a 4% agarose gel in a gel tank with TBE buffer (0.5X) with EtBr staining for visualization. For identification, the fragments were visualized under UV light in IBGE’s gel documentation system (BioRad).
Results
PCA Analysis
The PCA was constructed to find out the genetic difference between the accessions and the SSRs markers used for the study. Overall the PCA analysis revealed 85.3% variation among the germplasm based on the SSRs marker used. The PCA1 and PCA2 contributed 34.2% and 51.1% to the total variation, respectively (Fig. 1). The variance for both these components was also more than the rest of the components 9.957 and 8.213, respectively revealing the major contribution of first two components (Table 2). The SSRs markers (XGWM169b, GWM174, barc86a, PSP3000b, WMC773, XBARC4a, XGWM608, XGWM347, BARC114b, XBARC4b, CSLV34c, XGWM44b, XGWM169a, XGDM111b, XGWM410, XGWM44, XGWM111, XWMC331a, XGWM114, XGWM382, WMC419, PSP3000a, XGWM165, XGWM153b, BARC114a, XGWM35a, VENTRIP/LN2b, and VENTRIP/LN2c) in the blue circle were more reliable in finding out the diversity based on the alleles/band size in the study, as they lie close to the origin. Moreover, these markers are contributing to the maximum proportion in finding out the genetic variations among the population.
Fig. 2.
Heat-map for correlation matrix for 40 SSRs markers used to identify variations among wheat population. The red gauge indicates negative correlation while green gauge shows positive correlation.
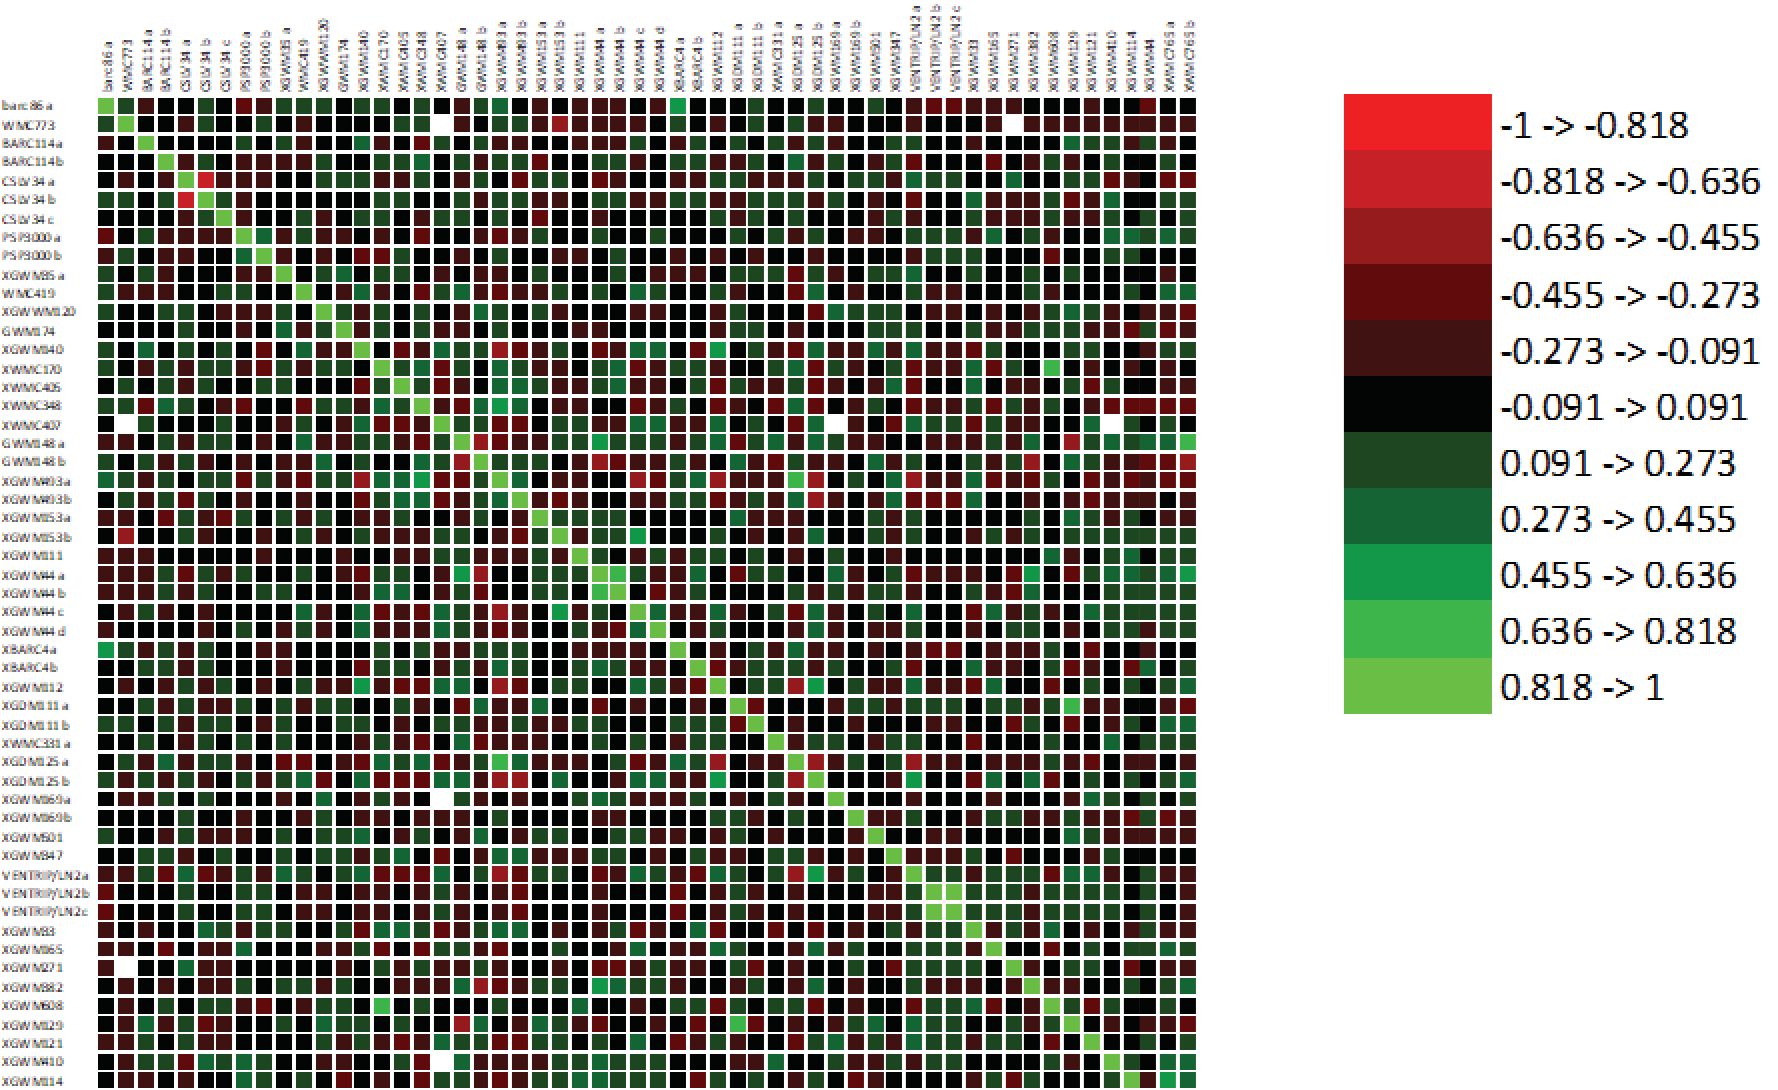
Table 3.
Cluster analysis based on 40 SSRs markers to group 50 wheat accessions.
The markers and accessions were equally distributed among four quadrants i.e. I, II, III, and IV. All the quadrants had negative value as indicated by the measuring scale as shown in the figure except II. The SSRs markers in quadrant II are both reliable and authentic in differentiation of both similar and diversified germplasm. The SSRs marker lying in quadrant II i.e. XGWM169a, GWM174, and barc86a proved to the best suited markers among 40 selected markers for accurately identifying the genetic variation among wheat population.
Correlation Analysis
Association between the parameter was also done in order to check and recommend highest associations of parameters for the studied germplasm. Results indicated the highest association was observed between bands of VENTRIP/LN2b and VENTRIP/LN2c i.e. is “1” in accessions 39 (Fig. 2). This complete correlation may be due to the detection of the bands by same SSRs marker VENTRIP/LN2 or could have the same priming DNA region on different alleles. The association between markers XWMC170/XGWM608, XGWM44a/ XGWM44b, XGDM111a/XGWM129, XWMC765a/XWMC765b, and GWM148a/ XWMC765b were also high with the correlation values of 0.368, 0.678, 0.655, 0.653, 0.653 and 0.643, respectively. The positive association between the parameters shows that both will equally detect the genetic variation in the wheat germplasm, which will help in confirmation of accurate detection of genetic variations.
Fig. 3.
Cluster analysis for grouping of wheat accession in the different groups based on genetic variations.
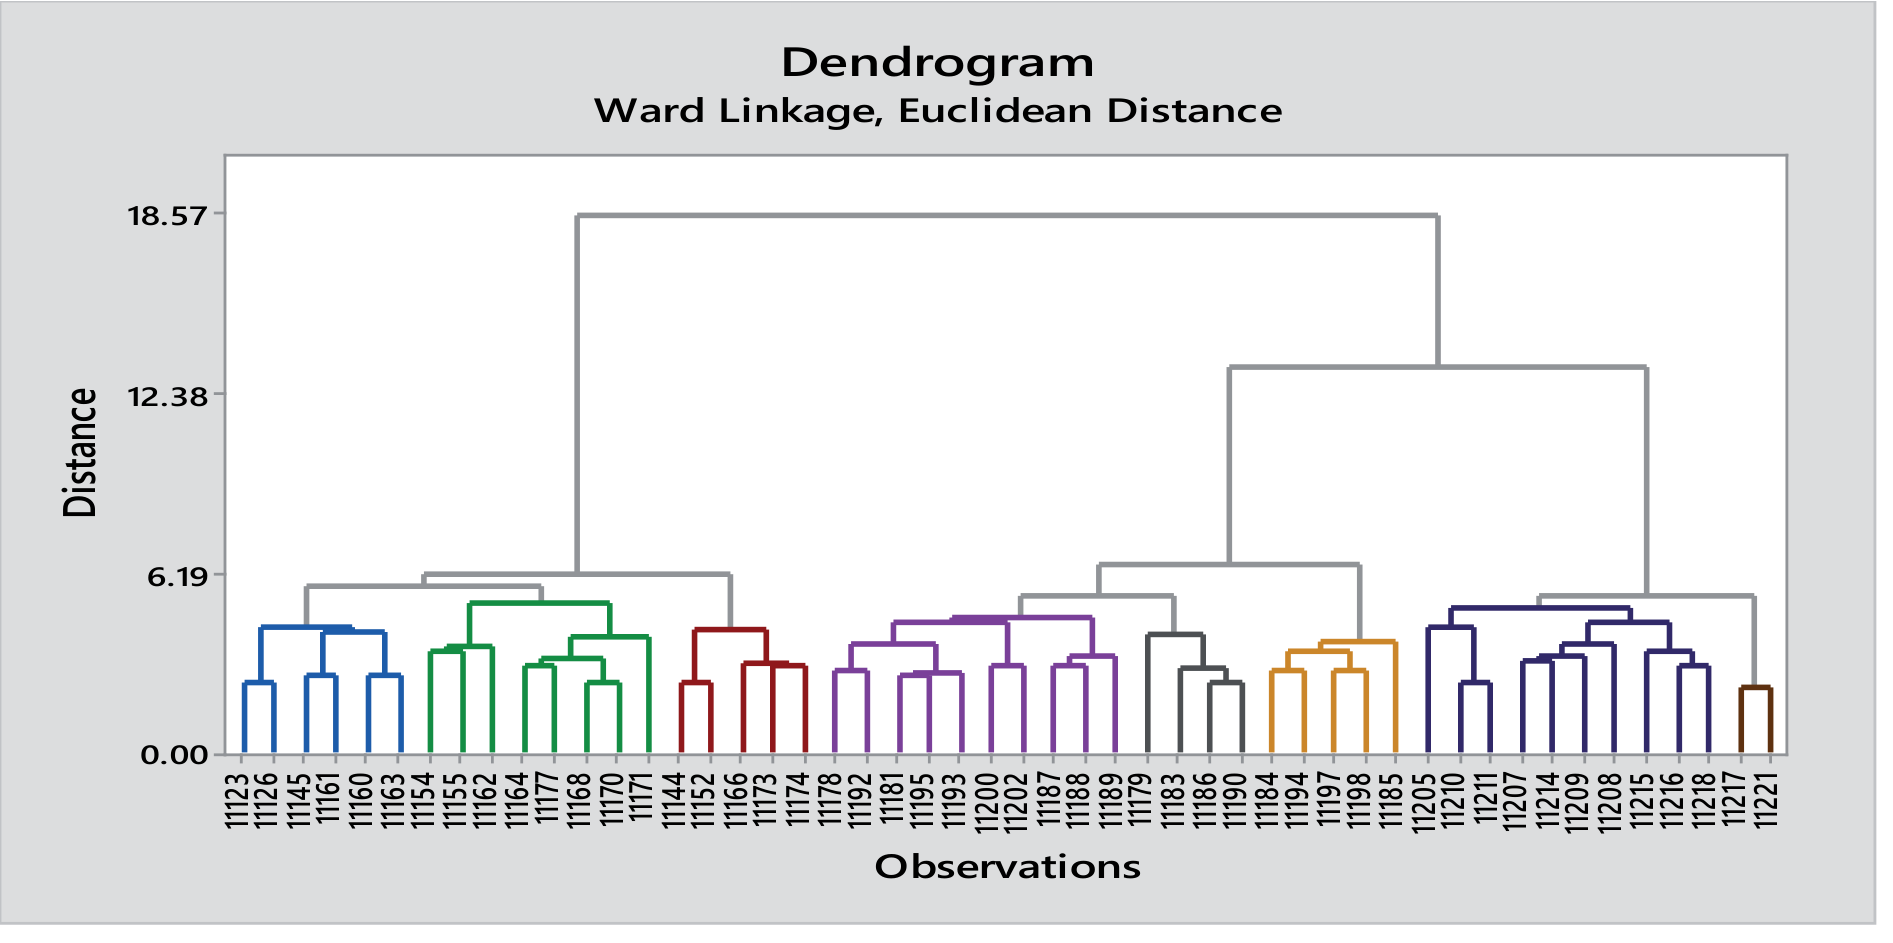
Fig. 4.
Amplification of 130 bp bands by XGDM19 gene marker for genetic variation among wheat germplasm. M is 100 bp standard/ ladder, +ive is positive control and 1-50 are wheat accessions.
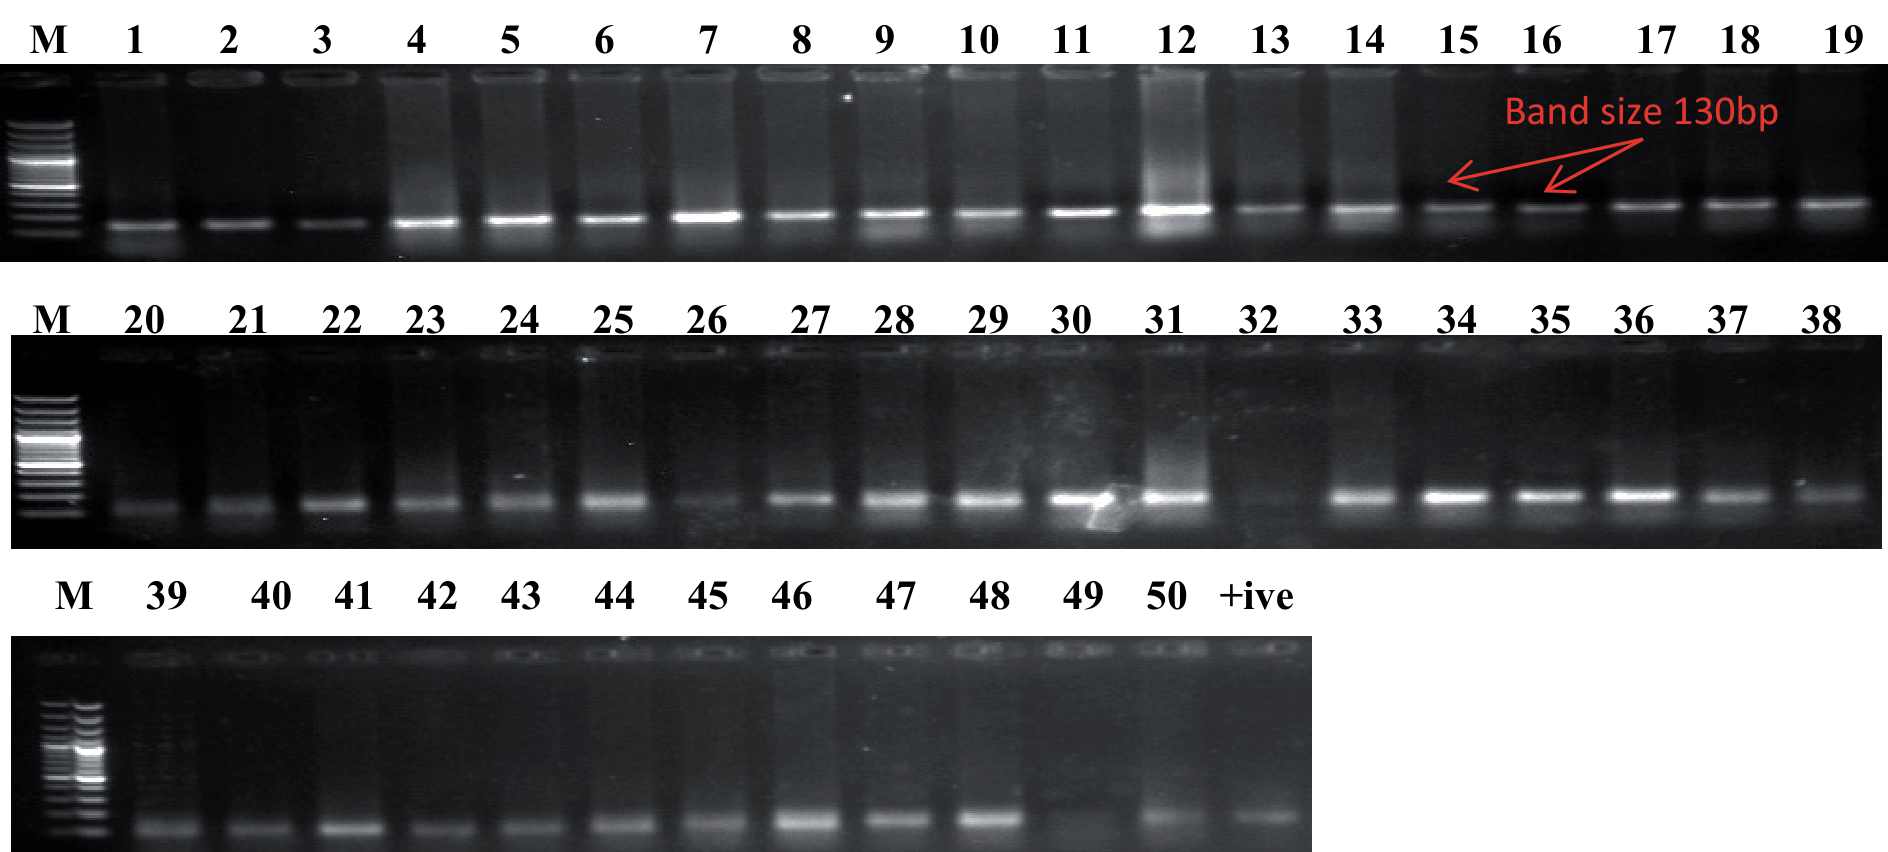
Fig. 5.
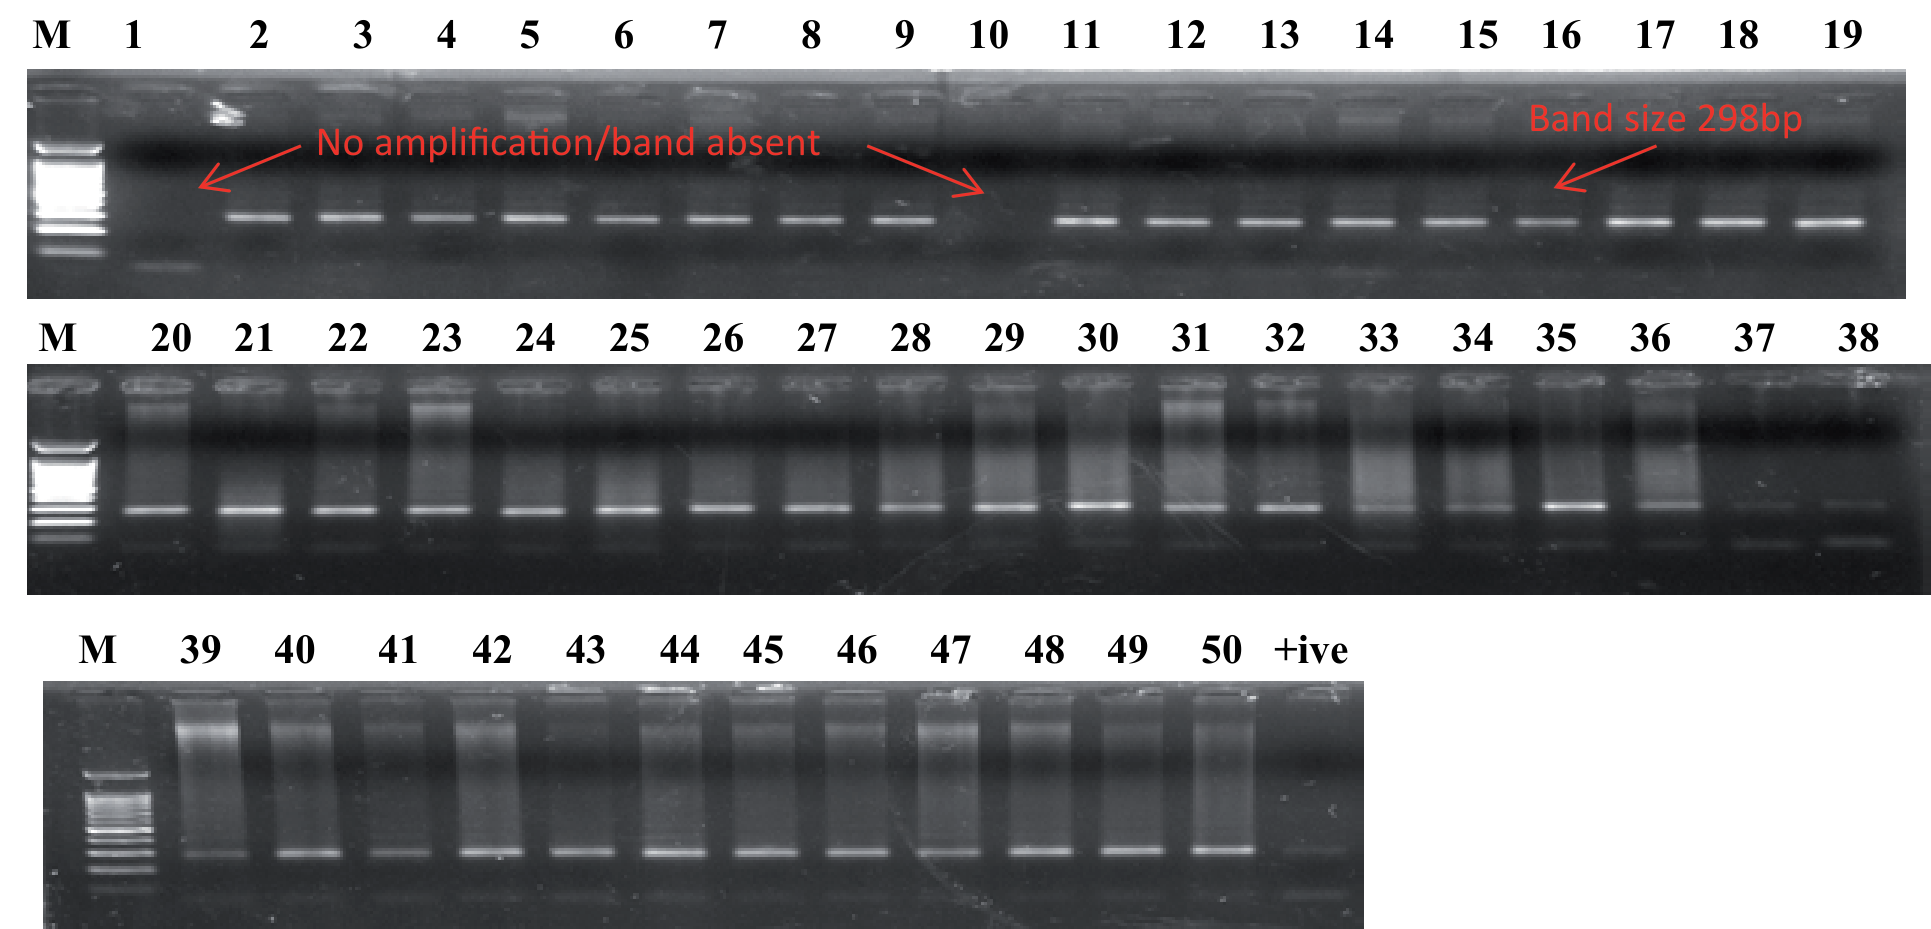
Amplification of 130 bp bands by WMC773 gene marker for genetic variation among wheat germplasm. M is 100 bp standard/ ladder, +ive is positive control and 1-50 are wheat accessions.
Similarly the lowest correlation was observed between the markers CSLV34b and CSLV34a i.e -0.688 followed by GWM148a and XGWM129 i.e -0.633. The other lowest or negative association was observed between the genetic markers XGWM493a/ VENTRIP/ LN2a, GWM148a/ GWM148b, XWMC765b/ GWM148b, XGDM125a/ VENTRIP/LN2a and XGWM493a/ XGDM125b with correlation values of -0.613, -0.608, -0.608, -0.600 and -0.569, respectively. The negative correlation shows that both the marker must not be used for confirmatory as they have the least chance to detect the same genetic variation among the wheat germplasm, though they can be used for collection and identifying different genetic variations but that will need the confirmations of other SSRs markers for accurate detection of genetic diversity.
Cluster Analysis
The entire 40 SSRs marker were applied on the studied germplasm (50 selected accessions) to group the accessions on the basis of genetic differentiation. Cluster analysis revealed three main groups A, B, and C. Group A and B had three cluster each while group C has only two cluster and least number of germplasm percentage i.e only 12 accessions. Cluster I, II and III were separated at genetic distance of 6.19 (Euclidian distance), while Cluster IV, V and VI were differentiated form each other with 6.21 Euclidian distances. Both cluster of group C i.e VII and VIII were separated from each other with a genetic distance of 5.7 (Euclidian distance). Group A and B had total of 19 accessions each that were distributed between three cluster, respectively (Table 3 and Fig. 3).
The groups in the present study revealed that the studied germplasm of wheat were having broad genetic base as the accessions were not in same group and were distributed in various cluster. The cluster of group B and C were separated from each other with a Euclidean genetic distance of 14.2. While the group A was totally different from B and C with the genetic distance of 18.5 revealing that these accessions were having totally different genetic base and are more diversified than the others.
Wheat Germplasm Genetic Variation
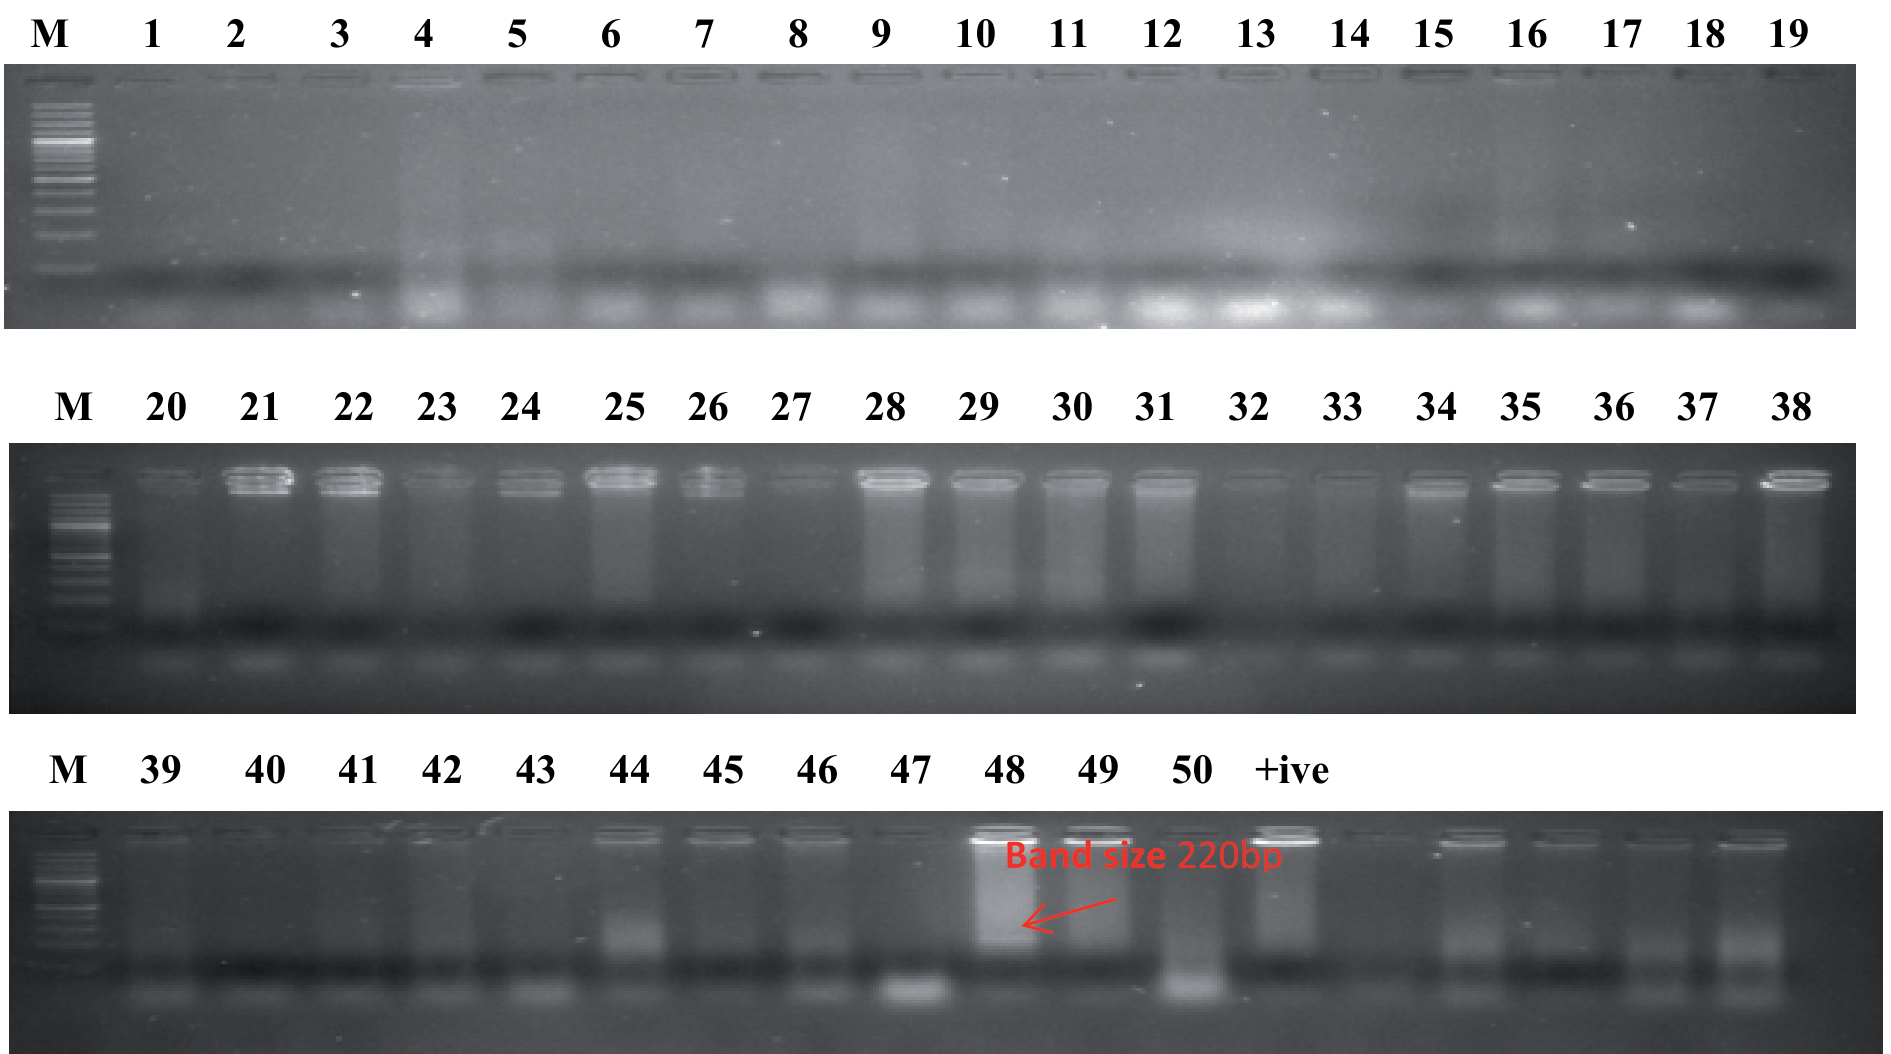
A total of 40 reported SSRs markers were used in the present study. These markers were able to amplify the required bands (Table 1, Figs 4-6) for identifying the genetic distance in term of variations between the wheat germplasm used in the present study. The highest amplification was revealed by XGDM19 (130 bp), WMC773 (298 bp), XWMC331a (210 bp), BARC114a (105 bp), barc86a (200 bp), and XBARC4a (90 bp) i.e. 50, 48, 47, 46, 45, and 42 respectively. While the gene markers i.e. CSLV34c, GWM174, XGWM169b, VENTRIP/ LN2b (300 bp), and VENTRIP/LN2c (1000 bp) were only able to amplify one wheat accessions out of 50. The SSRs markers XGWM153b (300 bp), BARC114b (200 bp), and XGWM44d (700 bp) also amplified bands in very less accessions i.e. 2, 3, and 4 accessions.
Discussion
Most agronomic traits are influenced by environmental factors and heritability, making genetic basis dissection difficult if molecular techniques are not used [32, 33]. Breeding nowadays only concentrates on yield-related characteristics, which results in a decrease in genetic base and variation of the wheat crop [34, 35], this is cause for serious concern because narrowing wheat’s genetic base could be devastating in combating climate/weather change by only disease resistance-related parameters or yield-related issues [36]. Non-conventional approaches including high throughput techniques like transformation, Marker assisted selection, gene sequencing etc., must be employed to solve the issues [37, 39].
Cluster analysis can identify similarities and differences among germplasm based on genetic variations or distance between two different/distinct groups or clusters [40, 42]. The accessions in a single cluster/group are genetically related or similar, while all of the accessions in the other cluster are genetically dissimilar. Our findings are consistent with previous research that found different clusters and subgroups of ninety wheat accessions based on geographical zone [15, 43, 44]. The PCA can be utilized effectively in trials that may involve multiple location for evaluation of genetic variability [15-35, 45, 46]. The present study PCA results are similar to previous findings as their results showed above 80% variation by PC compartments [35, 36, 45]. The PC plot showed high genetic diversity that may be that these landraces consisted of exceedingly admixed lineages. The findings of other studies are dissimilar to present study as their PC1-PC7 contributed approximately 80% of the total variability/variation while in the present study PC1 and PC2 contributed almost 80% to the total variations. Though PCA explained the source of the dataset used in the investigation, observed different variations in germplasm that were discovered in the two studies. In the present era one of the prime ways to improve the crop yield is to reduce the loss mainly because of the outbreak of lethal diseases. The best and suitable way for genetic diversity or broadening the genetic base is the used of disease related SSRs markers, as they will serve dual purpose i.e. is genetic diversity among the germplasm as well as identification of important disease resistant genes [15]. In the current study, accessions that were having more combinations of resistance gene were investigated further in breeding program with available rust markers for broadening the genetic base that is specific to disease resistance, as newly developed cultivars may have a broad genetic background but still be susceptible to lethal diseases because they were developed primarily to improve yield-related parameters [15]. By locating accessions with rust-resistant genes, the current study sought to extend the genetic base of our existing wheat varieties and increase the genetic variety of Pakistan germplasm. Similar study was done by other researcher as they used SSRs marker linked to rust disease and found genetic diversity [15].
The SSRs marker Xgwm120, that is presents 12 cM distance from Yr5 Begum et al. [31], showed a 150-bp fragment 42% wheat land races. The marker psp3000 was used for the detection of Yr10 gene. Similarly the Xgwm44 revealed polymorphic nature by amplifying various bands with sizes 120, 185, 500, and 700 bp. The band size 185 bp is closely linked to Lr 19 gene [47] and is generally used for its identification. It is also used for mapping of gene as well. Previous studies findings reported to screen the population with this marker for Lr 19 gene [48]. It has also been linked to the Yr18 gene. The csLV34 marker successfully amplified 150 bp as well as 190 bp fragments in 26% of accessions demonstrating the presence of the Yr18 gene, on the other hand a marker with 215 bp size was associated with the absence of Yr18 and was able to amply in 60% of the total population. Because this marker is co-dominant, it is appropriate for use in early segregating generations [49]. As previously reported [15], the occurrence of this gene in the Pakistan wheat population is quite low, as a result, there is an urgent need to extend the race-nonspecific yellow rust resistance. Previously, Begum et al. [50] all advance wheat lines were tested for the occurrence of Lr34/Yr18 using CSLV34, which yielded a 150 bp PCR product that was amplified in almost 43% accessions. Yr26 gene was detected using two markers i.e. barc 86 (200 bp) and Wmc773 (298 bp). The former was found in 90% of the accessions, while the latter was found in 96% of the accessions. In virulent tests, accessions with the presence of Yr26 gene were having resistant for the majority of Pst races [15, 33]. The virulence, however, has lately been identified in Australian wheat population. Three additional markers (SSRs) were utilized for the identification/presence of the Yr29 gene. Similarly the Wmc 419 (with a band size of 200 bp) was found in 54% of the population, whereas Xgwm 140 (band size of 120 bp) and xgwm 410 (with band size of 140 bp) were found in 48% and 56% of the landraces, respectively. Similar findings were also reported by many other studies as well [15, 31] for Yr26 and Yr 29 genes. The resistance for Yr with Xbarc4 (90-100 bp) is located on arm 5BS of the chromosome was amplified in 84% accessions. This gene has been linked to yellow rust resistance [51] but some study revealed a significant QTL for Powdery mildew resistance on 5BS as well [52]. The presence of Lr49 in this population was confirmed by screening microsatellite marker (SSRs Xwmc348 in 42% of the land races. Similar results were reported by previous studies [53] as well. The SSRsmarker Xgwm153 was identified in almost 82% (100 bp) and 2% (300 bp) of the population, respectively. Its location has reported at 8.2 cM from the YrP138 resistance gene and is distinct from other known resistance in that it exhibits resistance to the dominant Chinese Pst raceCYR32 at the seedling stage [54].
The marker Xwmc407 was also applied to identify Lr17 in 50% of the studied population, which is present on short-arm of wheat 2A chromosome [33]. However, it is also commonly used to test for the presence of the Yr17 gene [15]. Xgwm140 was also used in previous studies for genetic diversity to identify heat tolerant lines in wheat of guinea savanna [55]. They have also reported low allele frequencies (25 %) for random DNA marker allele while in present study it differentiated nearly 48% population from the rest. Sardouie-Nasab et al. [56] used XWMC170 i.e. is located on 2A and is for stripe rust but it was used for Haplotype analysis of QTLs attributed to salinity tolerance in wheat. He also further reported that this is also linked to Na+ ions. In present study it was only used for identifying rust resistance genes rather than ions demarcation.
Conclusion
Further studies on genetic diversity profiling may lead to the development of efficient and economical new breeding lines that are resistant or tolerant, have higher genetic characteristics, are environment-friendly, human-friendly and meet the needs of societies. The study was useful as disease related SSRs markers were used for general diversity, making the single SSRs marker used for multiple purposes including disease resistance, genetic diversity, mineral or ion identification. Furthermore the dual nature of marker can be fruitful as a single marker may be linked to multiple traits which will ultimately help in saving the cost, time and efforts rather using individual/ or specific markers for evaluating the genetic distance or base for the diversity analysis. Moreover, the combination of recent studies on the breeding traits of the same/similar genotypes existing in the gene pool and genetic diversity analyses can lead breeders to predict further selection of varieties to develop elite breeding lines resistant to fungal outbreaks from the existing gene pool.

