

Introduction
Water, energy, and food (WEF) are the basic resources for survival and development, which are important to sustain society and promote human well-being [1]. Nowadays, the interdependency among WEF is increasingly intensifying [2]. To address the complex relationships, the Bonn Conference, held in Germany in November 2011, first introduced the concept of the Water-Energy-Food nexus (WEF-Nexus) and highlighted the importance of exploring synergies and trade-offs among the resources [3]. The complex interconnections of WEF are commonly referred to as a nexus, wherein these three components form an integrated system known as the WEF system. The boundaries of the WEF system are dynamic [4], which means a change in any one resource may result in substantial changes in the other two. More importantly, external changes such as economic growth and social development have exacerbated the tension between increasing demand and resource scarcity. It is estimated by the United Nations [5] that the global urban population experiencing water scarcity will grow from 930 million in 2016 to a range of 1.7 to 2.4 billion in 2050. The demand for energy and food will rise by 50% and 70% respectively [6]. As a populous and rapidly developing country, China is confronted with the challenge of achieving harmonious development in the WEF system. The sustainable utilization of the three resources has directly impacted national security and social stability in China [7]. How to integrate the WEF system and improve sustainability in China is an important issue in achieving multiple goals and addressing conflicts.
The Sustainable Development Goals (SDGs) issued by the United Nations provide an action plan to address the multiple challenges faced by humanity and guide the path to long-term development [8]. Complex interactions widely exist in the SDGs [9], which means that prioritizing implementation goals differently may lead to different results [10]. It is important to note that, in some cases, even when SDGs are met, there may be adverse effects on the environment, particularly in the context of water, energy, and food security [11]. Hence, there is an urgent need to mitigate the trade-offs impacting WEF sustainability due to single-system sustainable solutions and to gain a comprehensive understanding of the interconnections within the WEF system.
This underlines the importance of understanding WEF system from the SDGs perspective. Various methods have been made to assess the overall performance of the WEF system such as calculating input-output efficiency [12, 13], constructing a pressure-state-response framework [14], and using life cycle assessment [15, 16]. These approaches are feasible to quantify complex systems by collecting and integrating data from diverse sources [4]. However, it primarily focused on mapping causal loops and hierarchies within the WEF system, often neglecting interactions between different components [17]. Node optimization is an emerging focus that enriches the previous WEF sustainability, which facilitates effective management of the interests of multiple parties and simulates the interrelationships among key nodes. For example, Zeng et al. [18] and Liu et al. [19] adopted a system dynamics model to explore the interactions in the WEF system and underscore the importance of sustainable practices and resource optimization. Huang et al. [17] employed a structural equation model (SEM) to analyze the interrelationships and determinants of WEF and identified the primary influences of each subsystem. To conclude, these studies have enhanced our understanding of WEF management and provide valuable guidance for sustainable resource optimization.
However, there are a few studies paying attention to the impacts and implications of taking sustainable development actions on it. From an economic perspective, economic growth and rising income levels have placed a greater burden on natural resources and the environment [20]. This aligns with SDG 8, which focuses on ensuring economic growth and inclusivity. From a social standpoint, changes in consumption patterns are impacting the total consumption levels and demand structure of resources [21, 22], which relates to SDG 12 from the SDGs perspective. Allen et al. [23] mentioned that SDG 8 and SDG 12 are closely linked to WEF. From the perspective of climate change, the increased temperature and the altered rainfall patterns can lead to reduced power generation capacity, diminished crop yields, and heightened resource conflicts [24]. SDG 13 serves as a pathway to address these challenges. Fu et al. [25] highlighted that the establishment of responsible production and consumption patterns (SDG 12) and the adoption of climate action (SDG 13) play crucial roles in managing and controlling emissions from agricultural production and energy consumption. To sum up, changes in SDGs 8, 12, and 13 can lead to shifts in the dynamics of WEF provision and interaction. There is a research gap in exploring the implications of taking actions to promote WEF sustainability from the Sustainable Development Goals (SDGs) perspective.
The selection of relevant SDGs indicators poses significant challenges during the initial stages of monitoring sustainable progress [23]. Scholars predominantly constructed SDGs indicators based on theoretical framework models. For instance, Wang et al. [7] and Qian and Liang [26] adopted the Pressure, State, and Response (PSR) model for indicator selection to assess sustainability in China. Sun et al. [14] employed a theme-based framework to construct an indicator system, enabling an examination of the spatio-temporal variations in the degree of coupling coordination. Nonetheless, these studies only exhibit a partial representation of the SDGs, resulting in a restricted elucidation of strategies aimed at enhancing the realization of SDGs related to the WEF system [27].
In summary, despite significant advancements in research on WEF interactions and efforts to node optimization of WEF sustainability, several prominent gaps exist. (1) Impacts of taking related sustainable development actions. (2) Challenges in selecting SDGs Indicators. This underscores the scientific and practical necessity for a comprehensive understanding of the WEF sustainability to guide sustainable development. To fill the gaps in current research, this paper constructed a comprehensive indicator framework for WEF sustainability from the perspective of the SDGs. Subsequently, we examined the dynamic interplays within the WEF system and untangled how the related SDG actions, SDG 8 (Decent Work and Economic Growth), SDG 12 (Responsible Consumption and Production), and SDG 13 (Climate Action) affected WEF sustainability. From a theoretical standpoint, this study extends the investigation of WEF sustainability by adopting an SDG perspective, thereby enriching the existing body of WEF sustainability research. Concurrently, from a pragmatic perspective, it offers a valuable example of how sustainable development actions can affect the WEF system and identify the trade-offs to promote WEF sustainability.
Material and Methods
Framework of WEF Sustainability from the SDGs Perspective
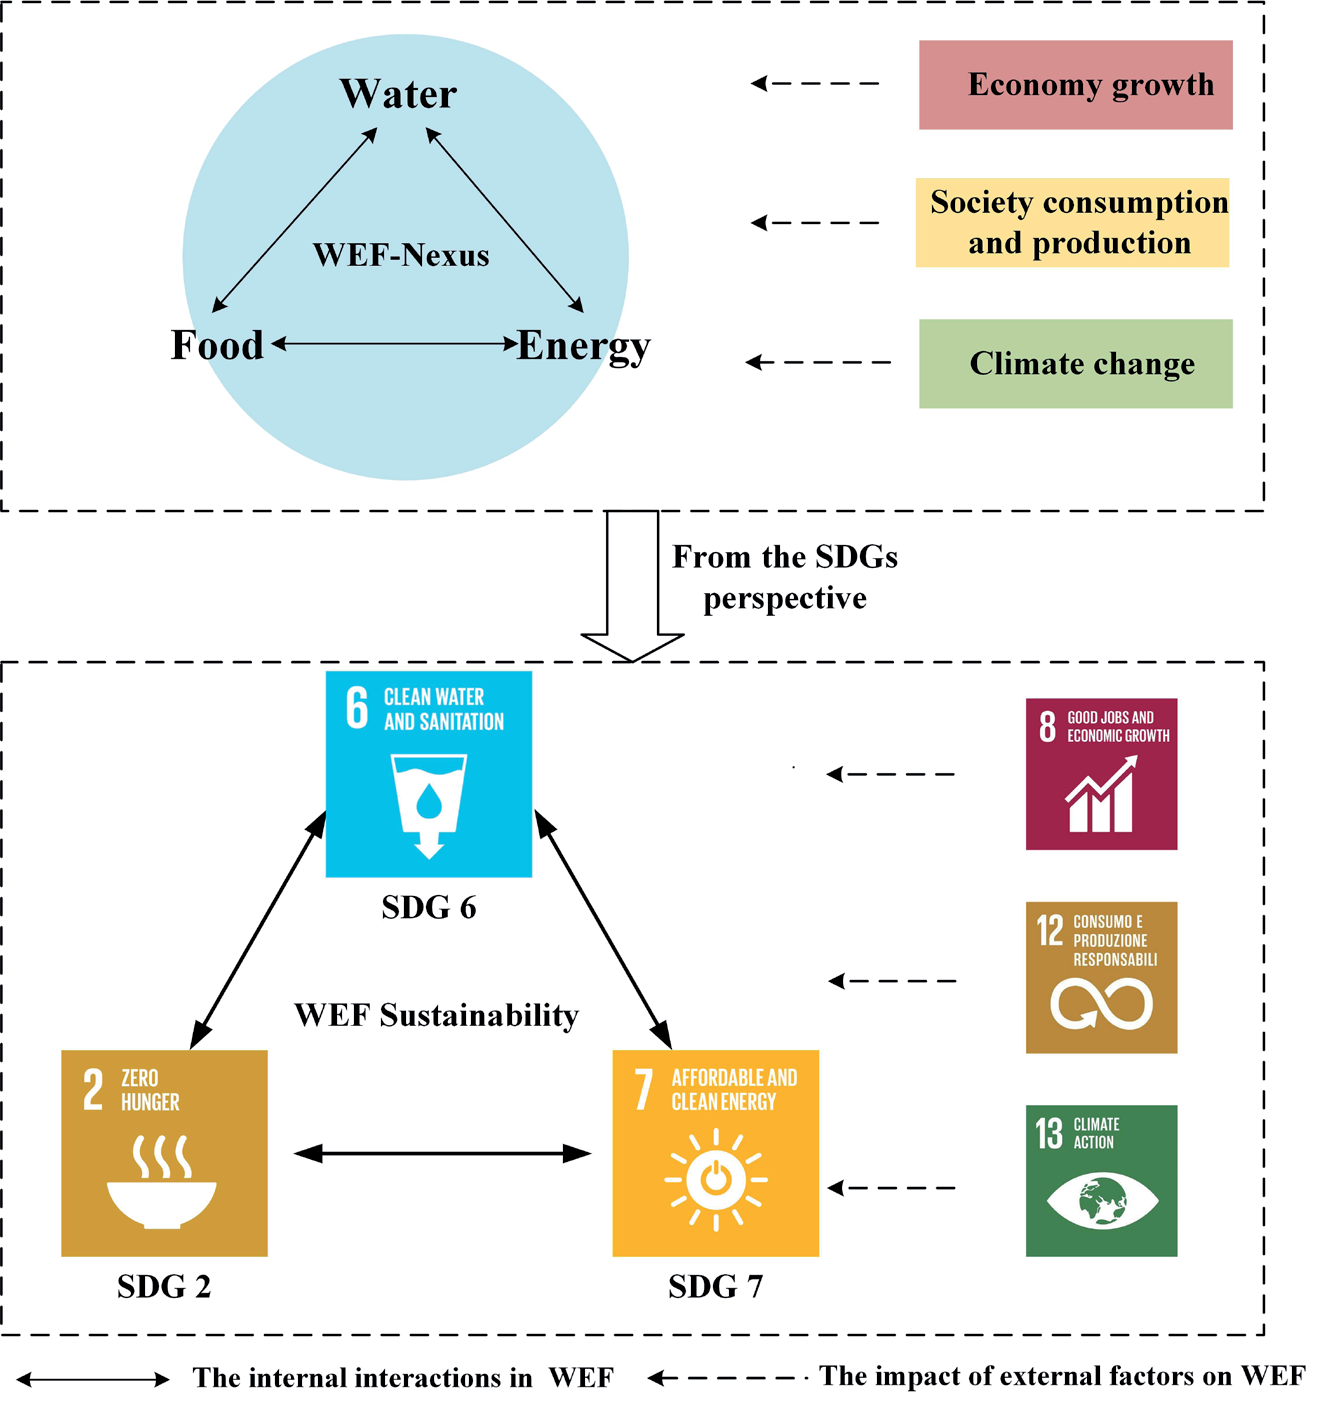
Quantifying WEF sustainability is essential for advancing the SDGs process, but a precise definition remains elusive. According to the SDGs agenda [28], the goal of water systems is to “ensure availability and sustainable management of water and sanitation for all”. The energy system aims to “ensure access to affordable, reliable, sustainable and modern energy for all”. The food system aims to “end hunger, achieve food security and improved nutrition and promote sustainable agriculture”. Building upon these definitions, WEF sustainability is defined as the ability of each subsystem within the WEF system to meet the requirements outlined in the 2030 Agenda for SDGs, with synergistic interactions among these subsystems. From the perspective of SDGs, food, water, and energy subsystems can be characterized as SDG 2 (Zero Hunger), SDG 6 (Clean Water and Sanitation), and SDG 7 (Affordable and Clean Energy).
As described above, WEF interactions are related to economic growth, social production and consumption, and climate change. While taking these related actions can contribute to accelerating the progress of the SDGs, the implementation can also bring about unintended consequences for WEF. Firstly, it can directly influence the supply-demand balance of the resources in a particular area. For instance, the implementation of water conservation measures or the adoption of renewable energy sources can impact the availability and distribution of resources within the WEF system. Secondly, external factors can transform existing mechanisms within the WEF, thus exacerbating resource conflicts within the system [18]. For example, implementing climate-friendly energy practices can have significant impacts on energy production, which in turn further influences agricultural production and water availability through the transmission mechanism of linkages. The concept framework for studying WEF from the SDGs perspective is illustrated in Fig. 1.
Furthermore, we delved into the specific actions of the related SDGs, including maintaining stable economic growth, optimizing industrial structure, ensuring employment rate, reducing resource consumption, improving waste utilization rate, mitigating the impacts of natural disasters, and minimizing CO2 emissions. These actions serve to advance the progress of related SDGs, as well as exert an influence on WEF dynamic interactions.
Quantifying WEF Sustainability
Constructions of WEF Sustainability Indicators
The indicators of the WEF sustainability index were built based on the selected SDGs. To minimize subjective interpretations, the study utilized the global indicator framework proposed by IAEG-SDGs as a foundation. We referred to existing evaluation indicators of China’s sustainable development from public literatures [29, 30] to adjust the indicators based on the specific context. Considering the data availability and comparability among Chinese provinces, the study established a total of 19 indicators (see Appendix Table A.1).
Panel Vector Autoregression (PVAR) Model
The panel vector autoregression model (PVAR) is primarily used for processing short-time span panel data. This paper selected the PVAR model based on the following considerations: Firstly, the PVAR model focuses on interactions between selected variables, allowing for dynamic mapping of complex relationships rather than relying on fixed theories or models. Secondly, PVAR treats all variables as endogenous, analyzing the current and future effects of an endogenous variable on itself and other variables [31]. Additionally, by incorporating fixed effects, the PVAR model helps address unobserved individual heterogeneity factors in the data [32]. The panel autoregressive distributed lag model (PVAR) can generally be specified as:
Where: yi,t represents the matrix of endogenous variables, where i denotes the individual unit, representing the 30 mainland provinces of China (excluding Tibet, Hong Kong, Macao, and Taiwan); t denotes the period from 2003 to 2020. The term yi,t–j denotes the lagged term of j for yi,t, p denotes the lag order; βj represents the parameter estimation matrix; μi represents the time-fixed effects. γi represents the individual effect differences specific to each province; εi,t represents the random error term.
This study developed four equation sets to examine the two-way interactions within the WEF system and the influence of actions in SDGs (SDG 8, 12, 13) on the WEF sustainability. The first equation set measured the two-way interactions of WEF-related SDGs, y in this equation includes the performance of SDG 2, 6, 7, 8, 12, 13. In the second equation set, y included WEF sustainability, the annual growth rate of real GDP per capita (%) (SDG 8_GG), the urban registered unemployment rate (%) (SDG 8_ UR), and the added value of the third industry as a proportion of GDP (%) (SDG 8_ TI). In the third equation set, y involved WEF sustainability, resource consumption per capita (SDG 12_RC), and comprehensive utilization rate of industrial solid waste (%) (SDG 12_ CU). In the fourth equation set, y involved WEF sustainability, impacts of natural disasters (%) (SDG 13_ND), and CO2 emissions intensity per GDP (kg/yuan) (SDG 13_ EI). We utilized Stata 16 software for constructing PVAR models and conducting statistical analysis. To address the issue of “pseudo-regression” resulting from unstable data, we conducted stability tests using the Levin-Lin-Chu (LLC) and Im-Pesaran-Shin (IPS) methods. The results of these tests are presented in Table A.2. To mitigate the influence of both individual and time fixed factors on the variables, we employed the generalized method of moments (GMM) for parameter estimation.
Calculation of the WEF Sustainability Index
We employed normalization techniques to establish target and baseline values, ensuring the comparability of indicator values. They were constructed by referring to the Sustainable Development Report [33] and the published literature [30]. The indicator scores were aggregated into SDG target scores using arithmetic averaging, indicating their equal importance [34]. This approach aligned with the objective that all countries achieve each of SDGs through integrated strategies [35].
Specifically, the SDGs scores were calculated using formulas (2)-(4). xmax is the target value and xmin is the baseline value, and for indicators of neutral nature, xint is the target value. The raw data value of each SDG indicator is denoted as x. The SDG score is in the range of 0-100 points. A province with an SDG score of 50 means that it is halfway to achieving its best performance. WEF sustainability index was calculated by taking the arithmetic mean of the three SDGs scores, referring to the aggregation of different objectives [29]. The WEF sustainability index refers to the average sustainable process of the province across the water, energy, and food resource systems.
Data Sources
This study focused on the time span from 2003 to 2020 covering 30 provinces in China (excluding Tibet, Hong Kong, Macao, and Taiwan). The data of CO2 emission was from China Emission Accounts and Datasets [36, 37]. The data of most indicators selected were collected from public statistical databases, including China Statistical Yearbook, China Statistical Yearbook on Environment, China Health Statistics Yearbook, and China Energy Statistical Yearbook.
Results and Discussion
The WEF Sustainability Assessment
The Spatial Patterns of WEF Sustainability Assessment
China, being a vast country with significant regional diversity, is officially divided into four major economic regions: Eastern Region, Central Region, Northeastern Region, and Western Region. These regions represent varying resource endowments and development patterns in terms of WEF resources within the country. Fig. 2 illustrates a visual representation of how the WEF scores vary across these four regions over the given period. From a regional perspective, the sustainable development process of the WEF system was characterized by a decreasing trend from the eastern region to the central, northeastern, and western provinces. The provinces with high levels of sustainability in all three subsystems were Beijing, Shanghai, Zhejiang, Tianjin, and Fujian, all located in the eastern region. As the eastern region mainly acts as an agglomeration of capital and technology and demonstrates high efficiency in resource allocation, making it a frontrunner in WEF sustainable development in China. In contrast, in the western region, there was a large gap between food, energy, and water scores. It is worth noting ten provinces (excluding Xinjiang) achieved the national level in SDG 2 and six western provinces exceeded the national average in SDG 7. However, there are nine provinces (excluding Yunnan and Xinjiang) where the SDG 6 scores fell below the national average. As the western region is characterized by inadequate water resources and vulnerable ecological environment, the production of energy and food in this area could potentially worsen existing resource conflicts.
Fig. 2.
Spatial distribution of mean WEF SDG scores (2003 to 2020) for Chinese provinces and four major regions of China by province.
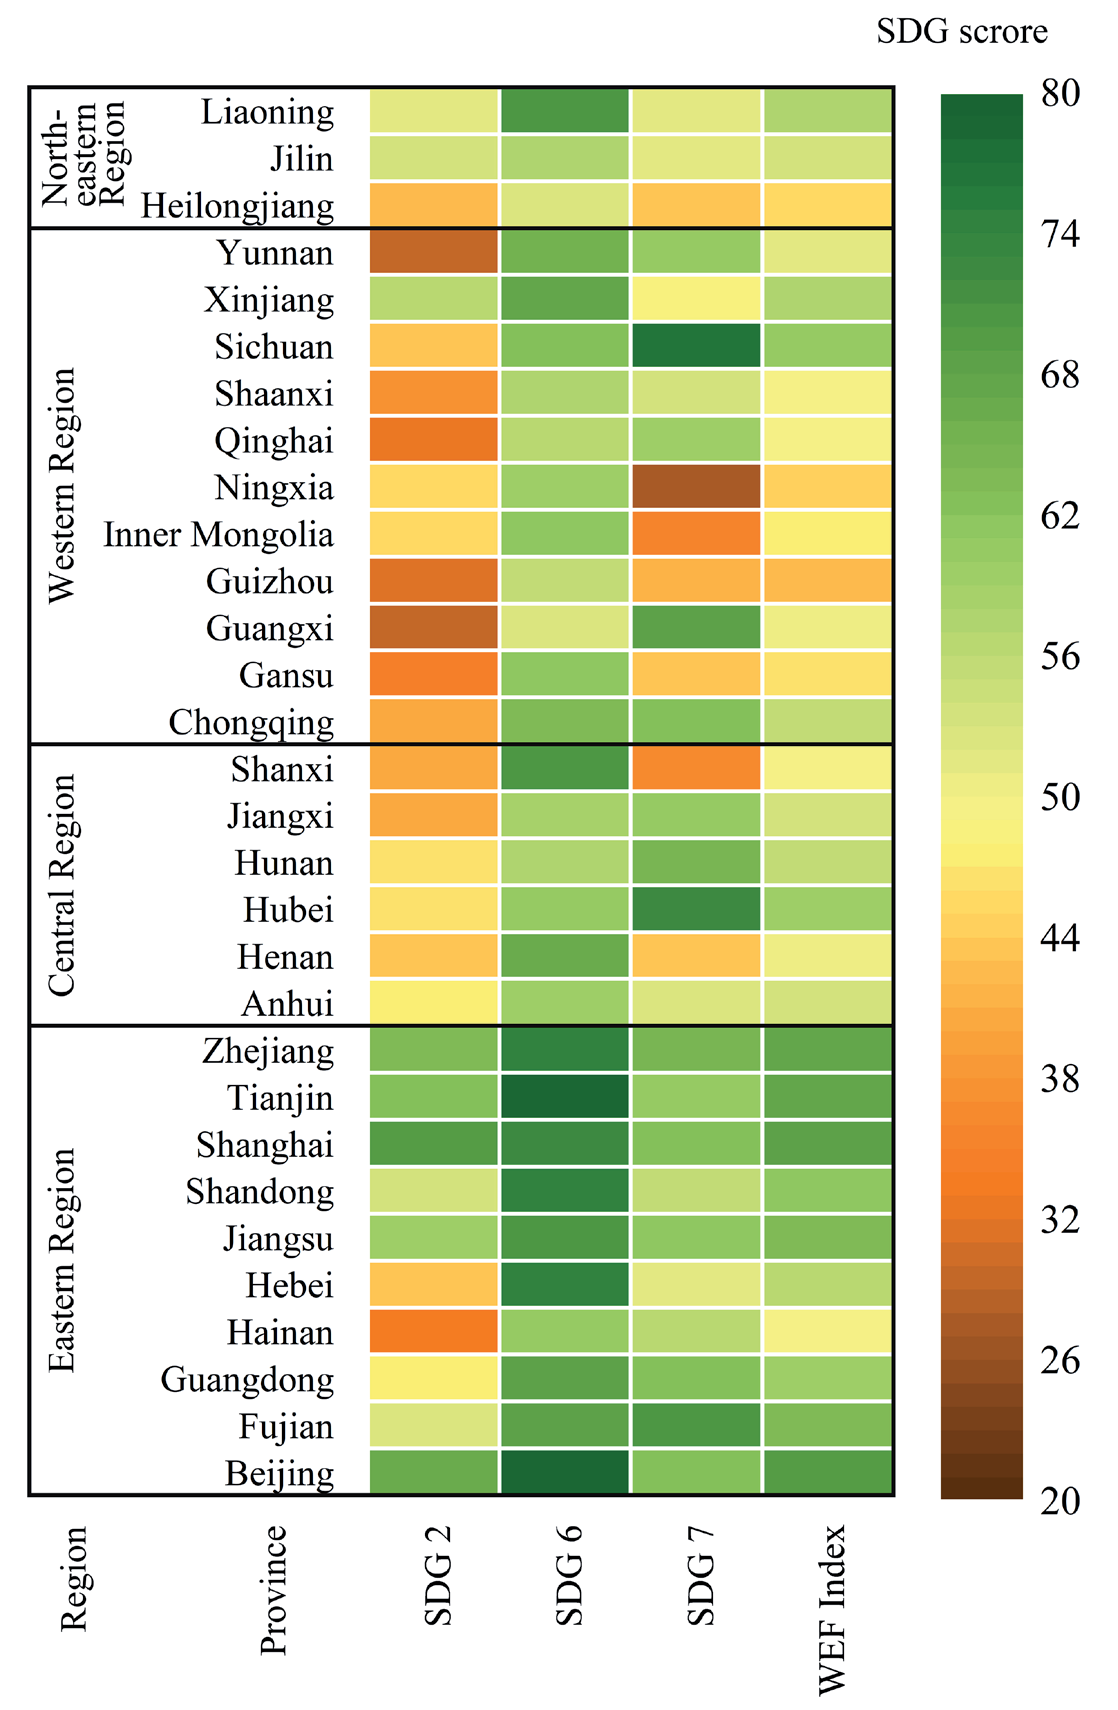
From the individual subsystem processes, China demonstrated substantial advancements in water system processes related to SDG 6, whereas progress in SDG 2 was relatively slower. The regions with an advantage in the energy system were mainly distributed in the western and central regions, namely Sichuan, Qinghai, and Hubei provinces, which served as major hubs for clean energy production. On the other hand, the regions where the sustainable food system outperforms energy production are predominantly situated in the northeastern region, including Liaoning and Jilin, as well as in the eastern region encompassing Shandong and Shanghai. This distribution pattern correlates with the geographic concentration of the main food production areas1 in China.
The Spatio-Temporal Evolution of WEF-Related Sustainability Assessment
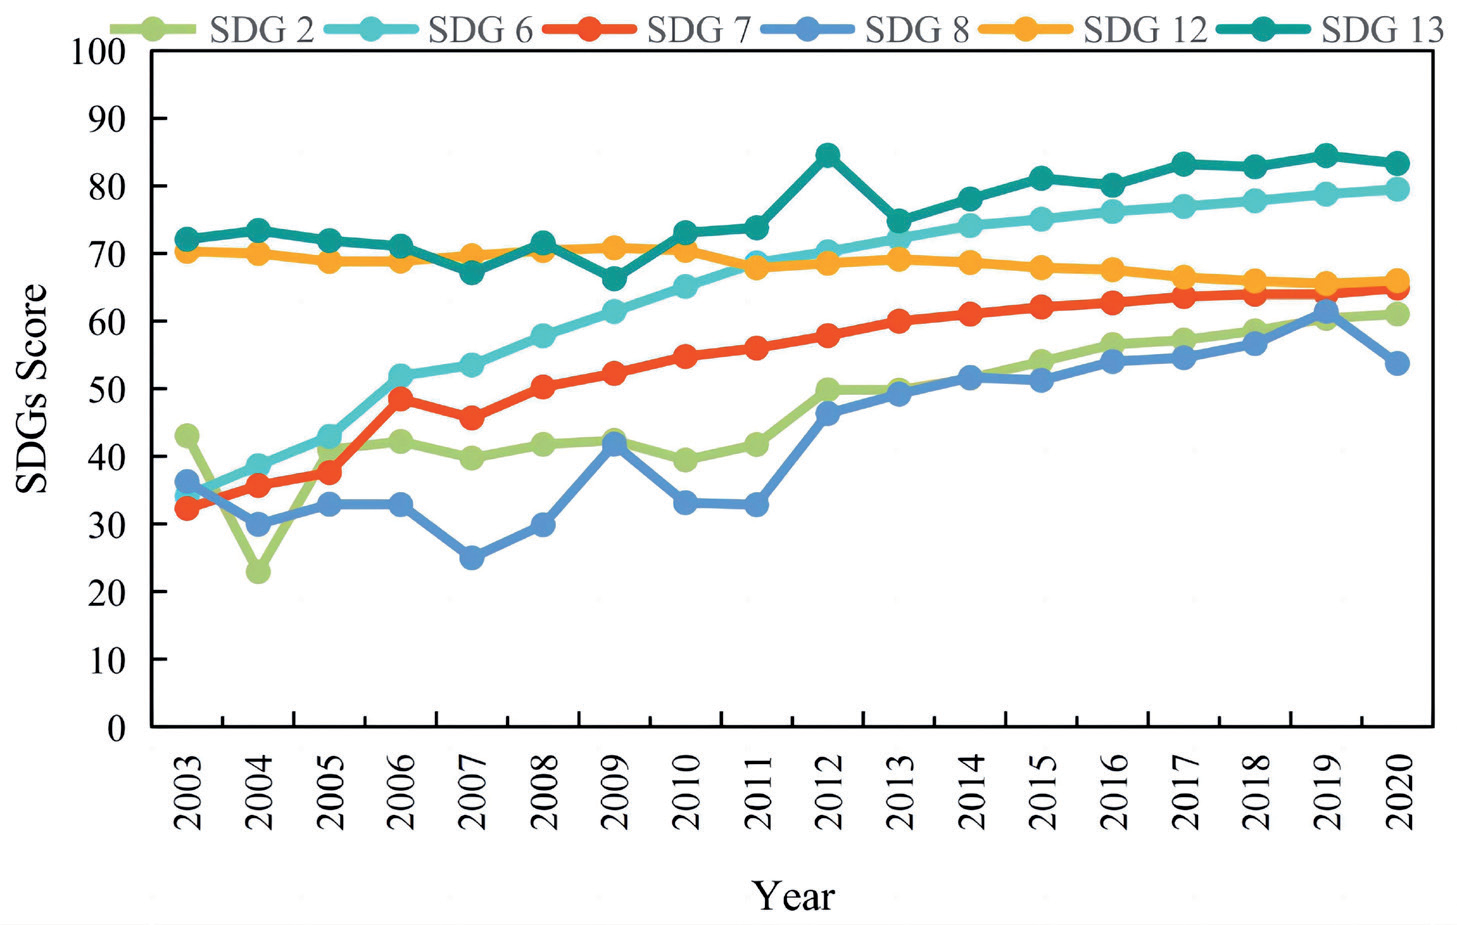
Fig. 3 shows the changes in WEF-related SDGs performance at the national level. Starting from a score of 43.0 in 2003, SDG 2 experienced a dramatic drop to its bottom of 22.94 in 2004 and then rose steadily, peaking at the score of 61.1 in 2020. The water system exhibited a stable increasing trend, with its score rising from 34.1 in 2003 to 79.5 in 2020, representing a growth of 130%. The energy system showed a positive trend, with a starting score of 32.3 in 2003 (the lowest among the six WEF-related SDGs), experiencing remarkable progress, especially since 2006 and culminating in a peak score of 64.89 in 2020. The notable improvement can be attributed to China’s target in 2006 to reduce energy consumption per unit of GDP by 20%, with the implementation of effective energy reduction measures playing a significant role. SDG 8 and 13 essentially exhibited an upward trend but with fluctuations. SDG 8 peaked at 61.45 but dropped to 53.76 in 2020, lagging behind the level in 2016, primarily as a result of the COVID-19 pandemic’s disruptive impact on the economy. Similarly, SDG 13 witnessed a fluctuating increase from 72.11 in 2003 to 83.32 in 2020. However, SDG 12 reached its peak at 70.84 in 2009 but exhibited a subsequent downward trend, with a score of 65.98 in 2020. This score was 4.34 points lower than that of 2003, suggesting that the consumption and production patterns resulted in significant resource depletion and severe environmental pollution.
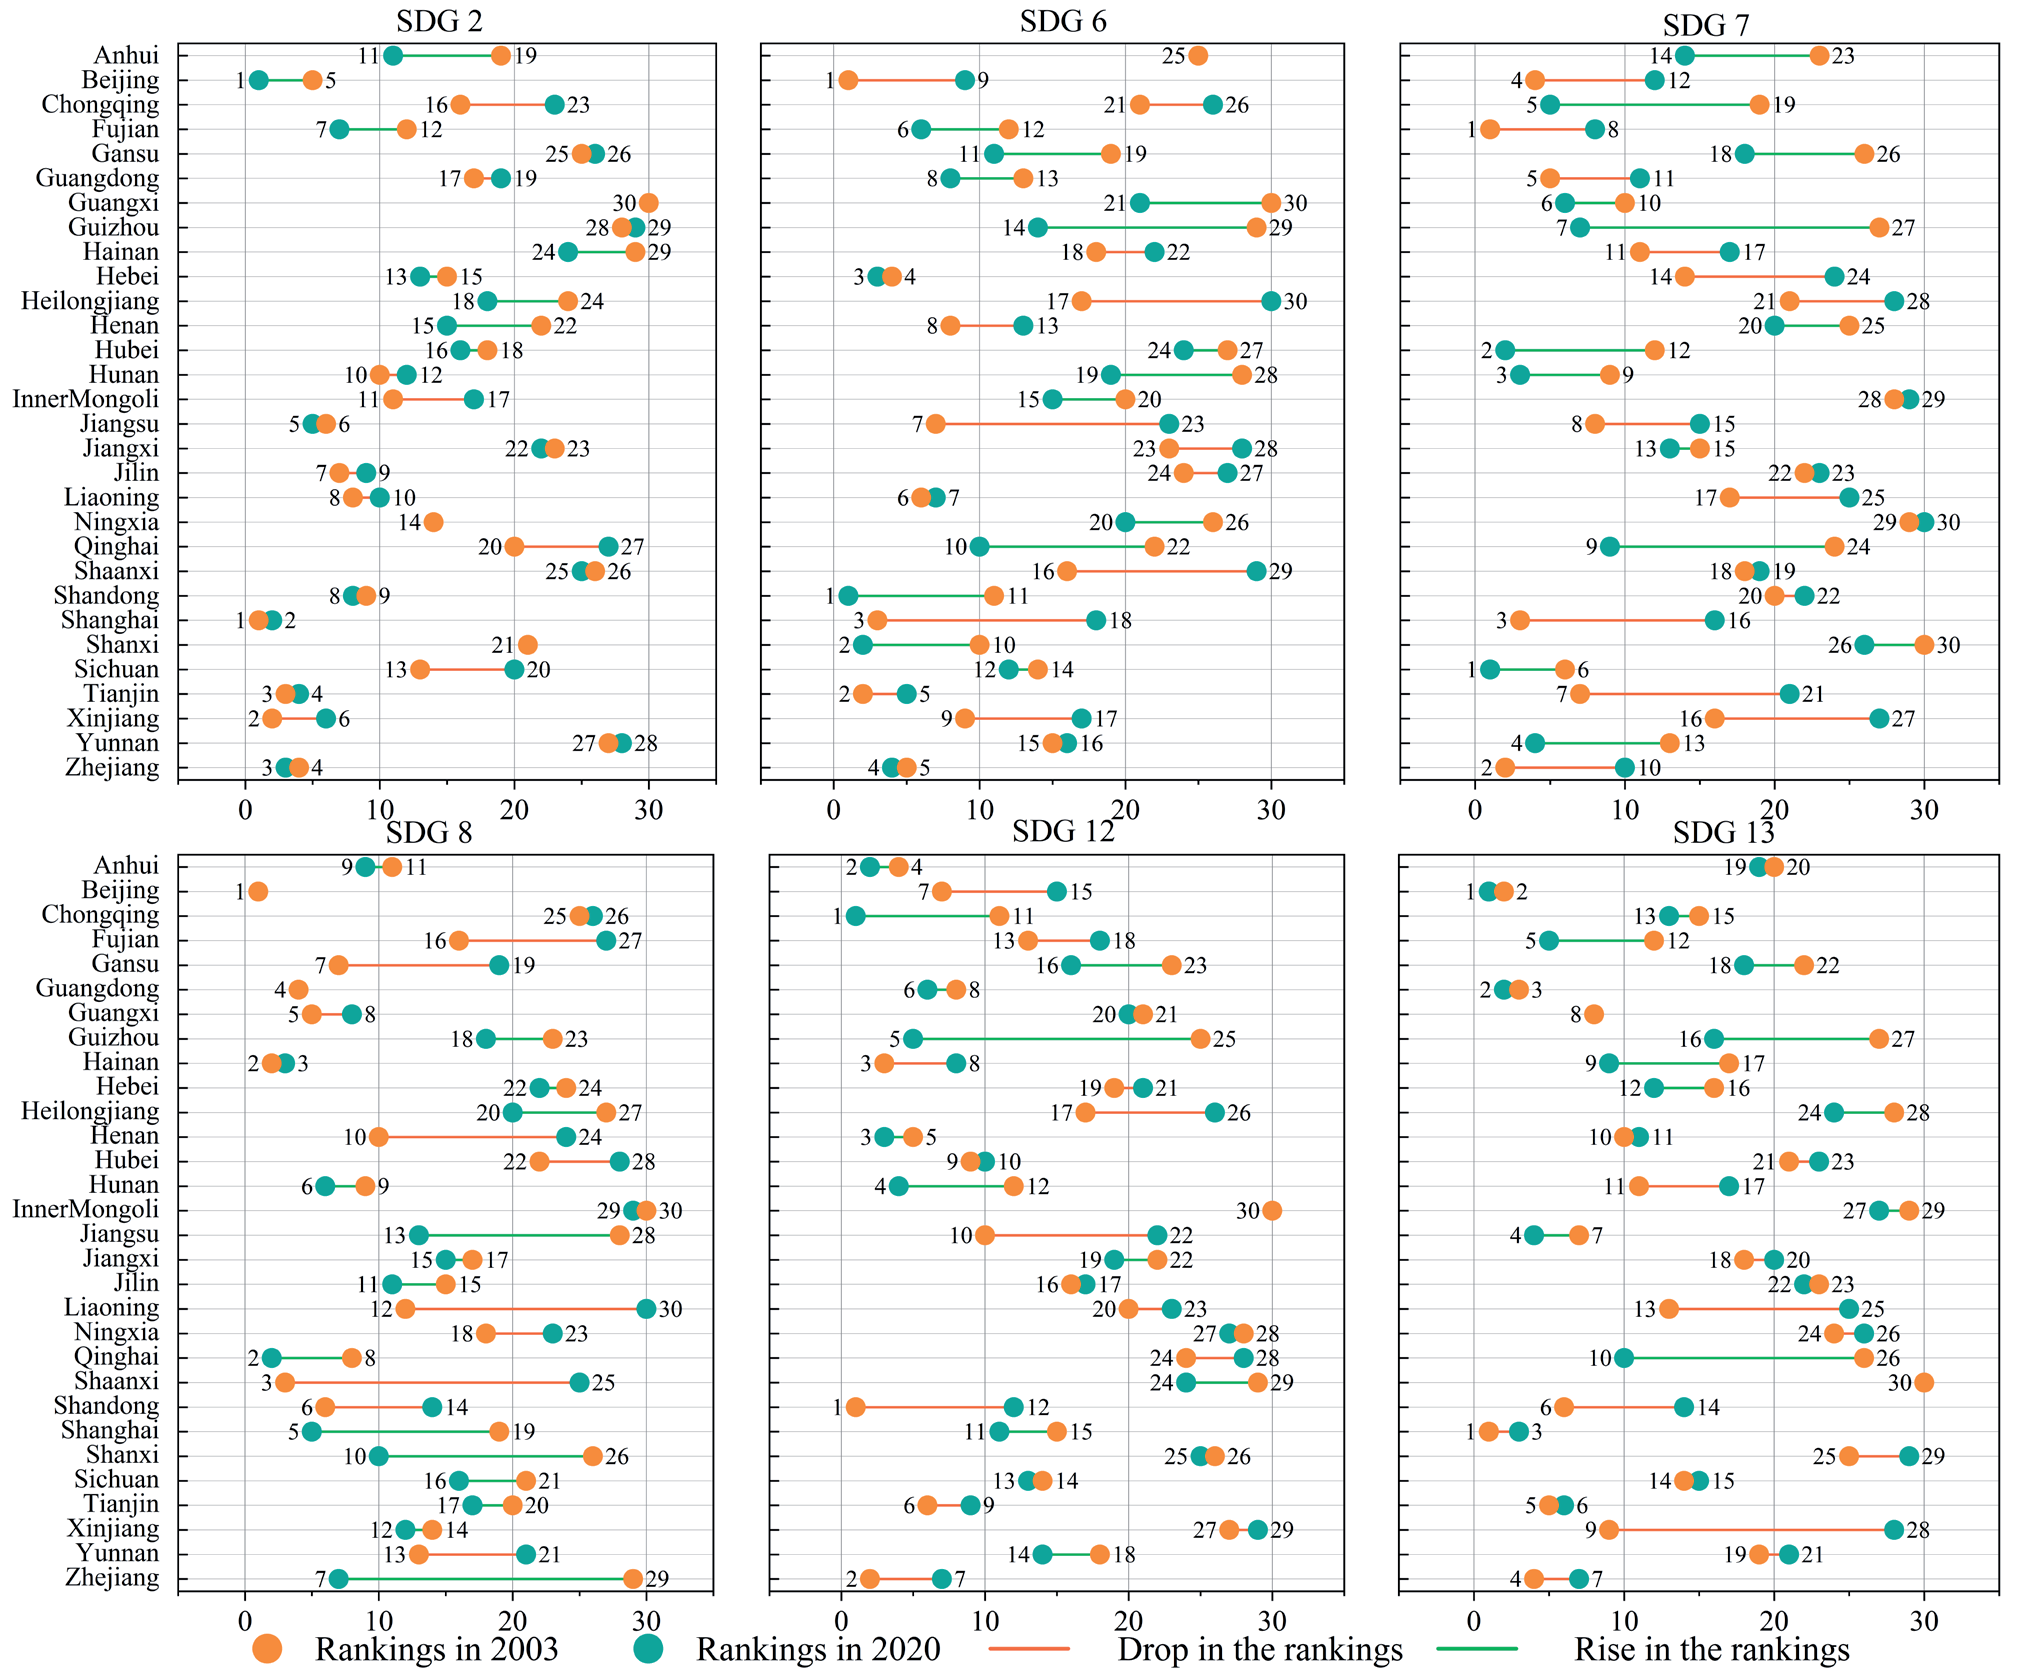
Although the WEF sustainability performance in all Chinese provinces showed an overall upward trend, there were variations in the degree of the increase. Further, we analyzed the dynamic progress of sustainable development by comparing the relative ranking of provinces at the national level in 2003 and 2020, which is illustrated in Fig. 4. The provinces in the eastern region showed little change in the rankings of the food system but witnessed a significant decline in their energy system rankings, particularly in the case of Shanghai, which dropped by 14 places. The western region provinces made significant progress in both water and energy systems, particularly in Guizhou Province (which improved by 15 and 20 places respectively) and Qinghai Province (which improved by 12 and 15 places respectively) over the years. Differently, all the six provinces from the central region exhibited improvements in the rankings for SDG 7, but five provinces (except Henan Province) ranked in the bottom 50 percent for SDG13 in 2020.
Dynamic Interactions within WEF System
The Interactions between Water and Food Systems
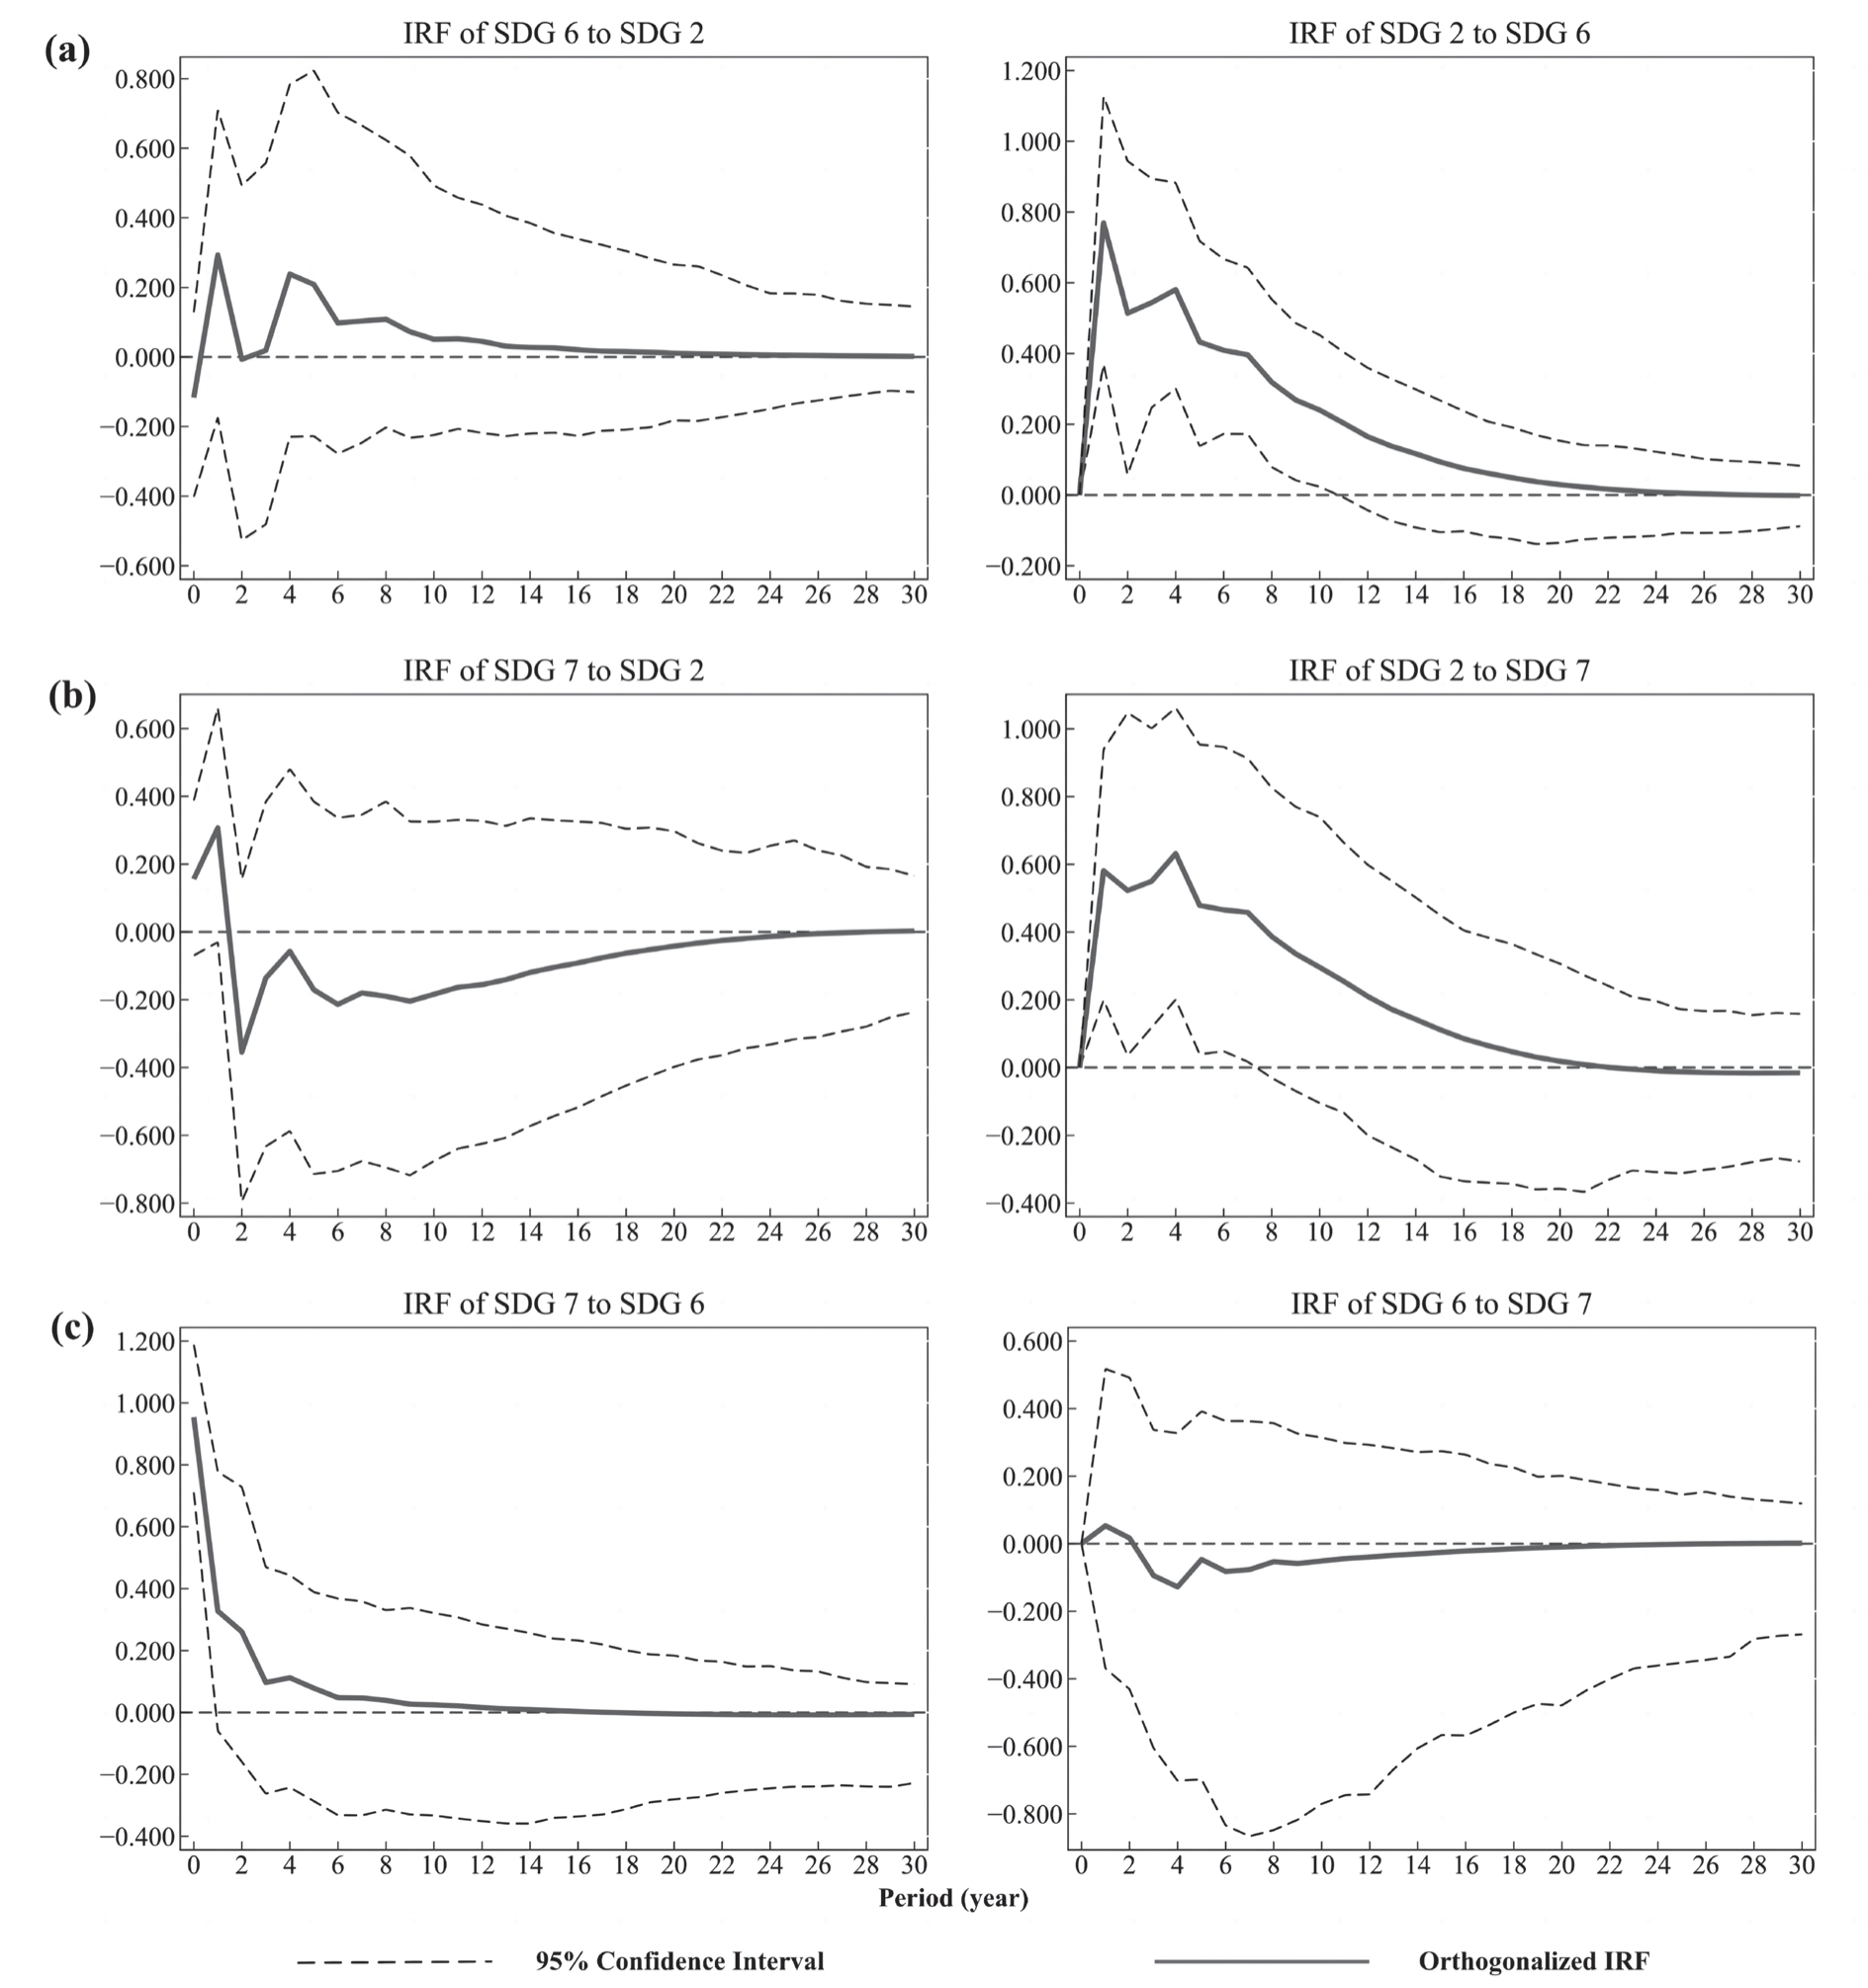
The SDG 6 score initially exhibited a negative response to the shock experienced by SDG 2 score at first but turned positive since the first period (Fig. 5a). Conversely, the SDG 2 score exhibited a significant positive impulse response to an increase in SDG 6 (Fig. 5a). This implies that while addressing food security and agricultural productivity, there are unintended consequences for water resources management. However, in the long term, the increased agricultural productivity as outlined in SDG 2 can contribute to alleviate pressure on water resources by reducing the requirement for extensive land input and excessive water usage.
The Interactions between Energy and Food Systems
The shock on SDG 2 had a positive impact on the SDG 7 at first but turned negative since the second period (Fig. 5b). This is primarily caused by the competition between energy and food production. The construction of biomass projects and other energy-related initiatives directly hampers the progress of SDG 2. However, SDG 2 score showed a positive response for one unit of positive variation from SDG 7 (Fig. 5b), which means that the positive socioeconomic impacts brought by SDG 7 contribute to alleviating the adverse negative effects from clean energy development on food security.
The Interactions between Energy and Water Systems
A unit increase in SDG 6 had a positive impulse shock to SDG 7 score, with the largest positive response in the initial period, followed by a rapid decline and convergence towards the zero curve (Fig. 5c). Water resources are essential for various processes, including production, transportation, water use, drainage, and wastewater treatment. Implementing sustainable water efficiency can reduce the energy footprint associated with these activities. In response to a positive shock of one unit from SDG 7, SDG 6 displayed a weak positive impulse response in the first period but turned negative from the second onwards (Fig. 5c). This suggests that reducing the reliance on traditional energy sources can help decrease water use for thermal cooling and mitigate water pollution associated with fossil energy production. However, in the long term, there can be conflicts between water requirements for residential households and that for energy production. This tension is exacerbated as the energy sector increasingly relies on water-intensive sources such as bioenergy and hydropower.
External Impact on WEF Sustainability
Impact of SDG 8 on WEF Sustainability
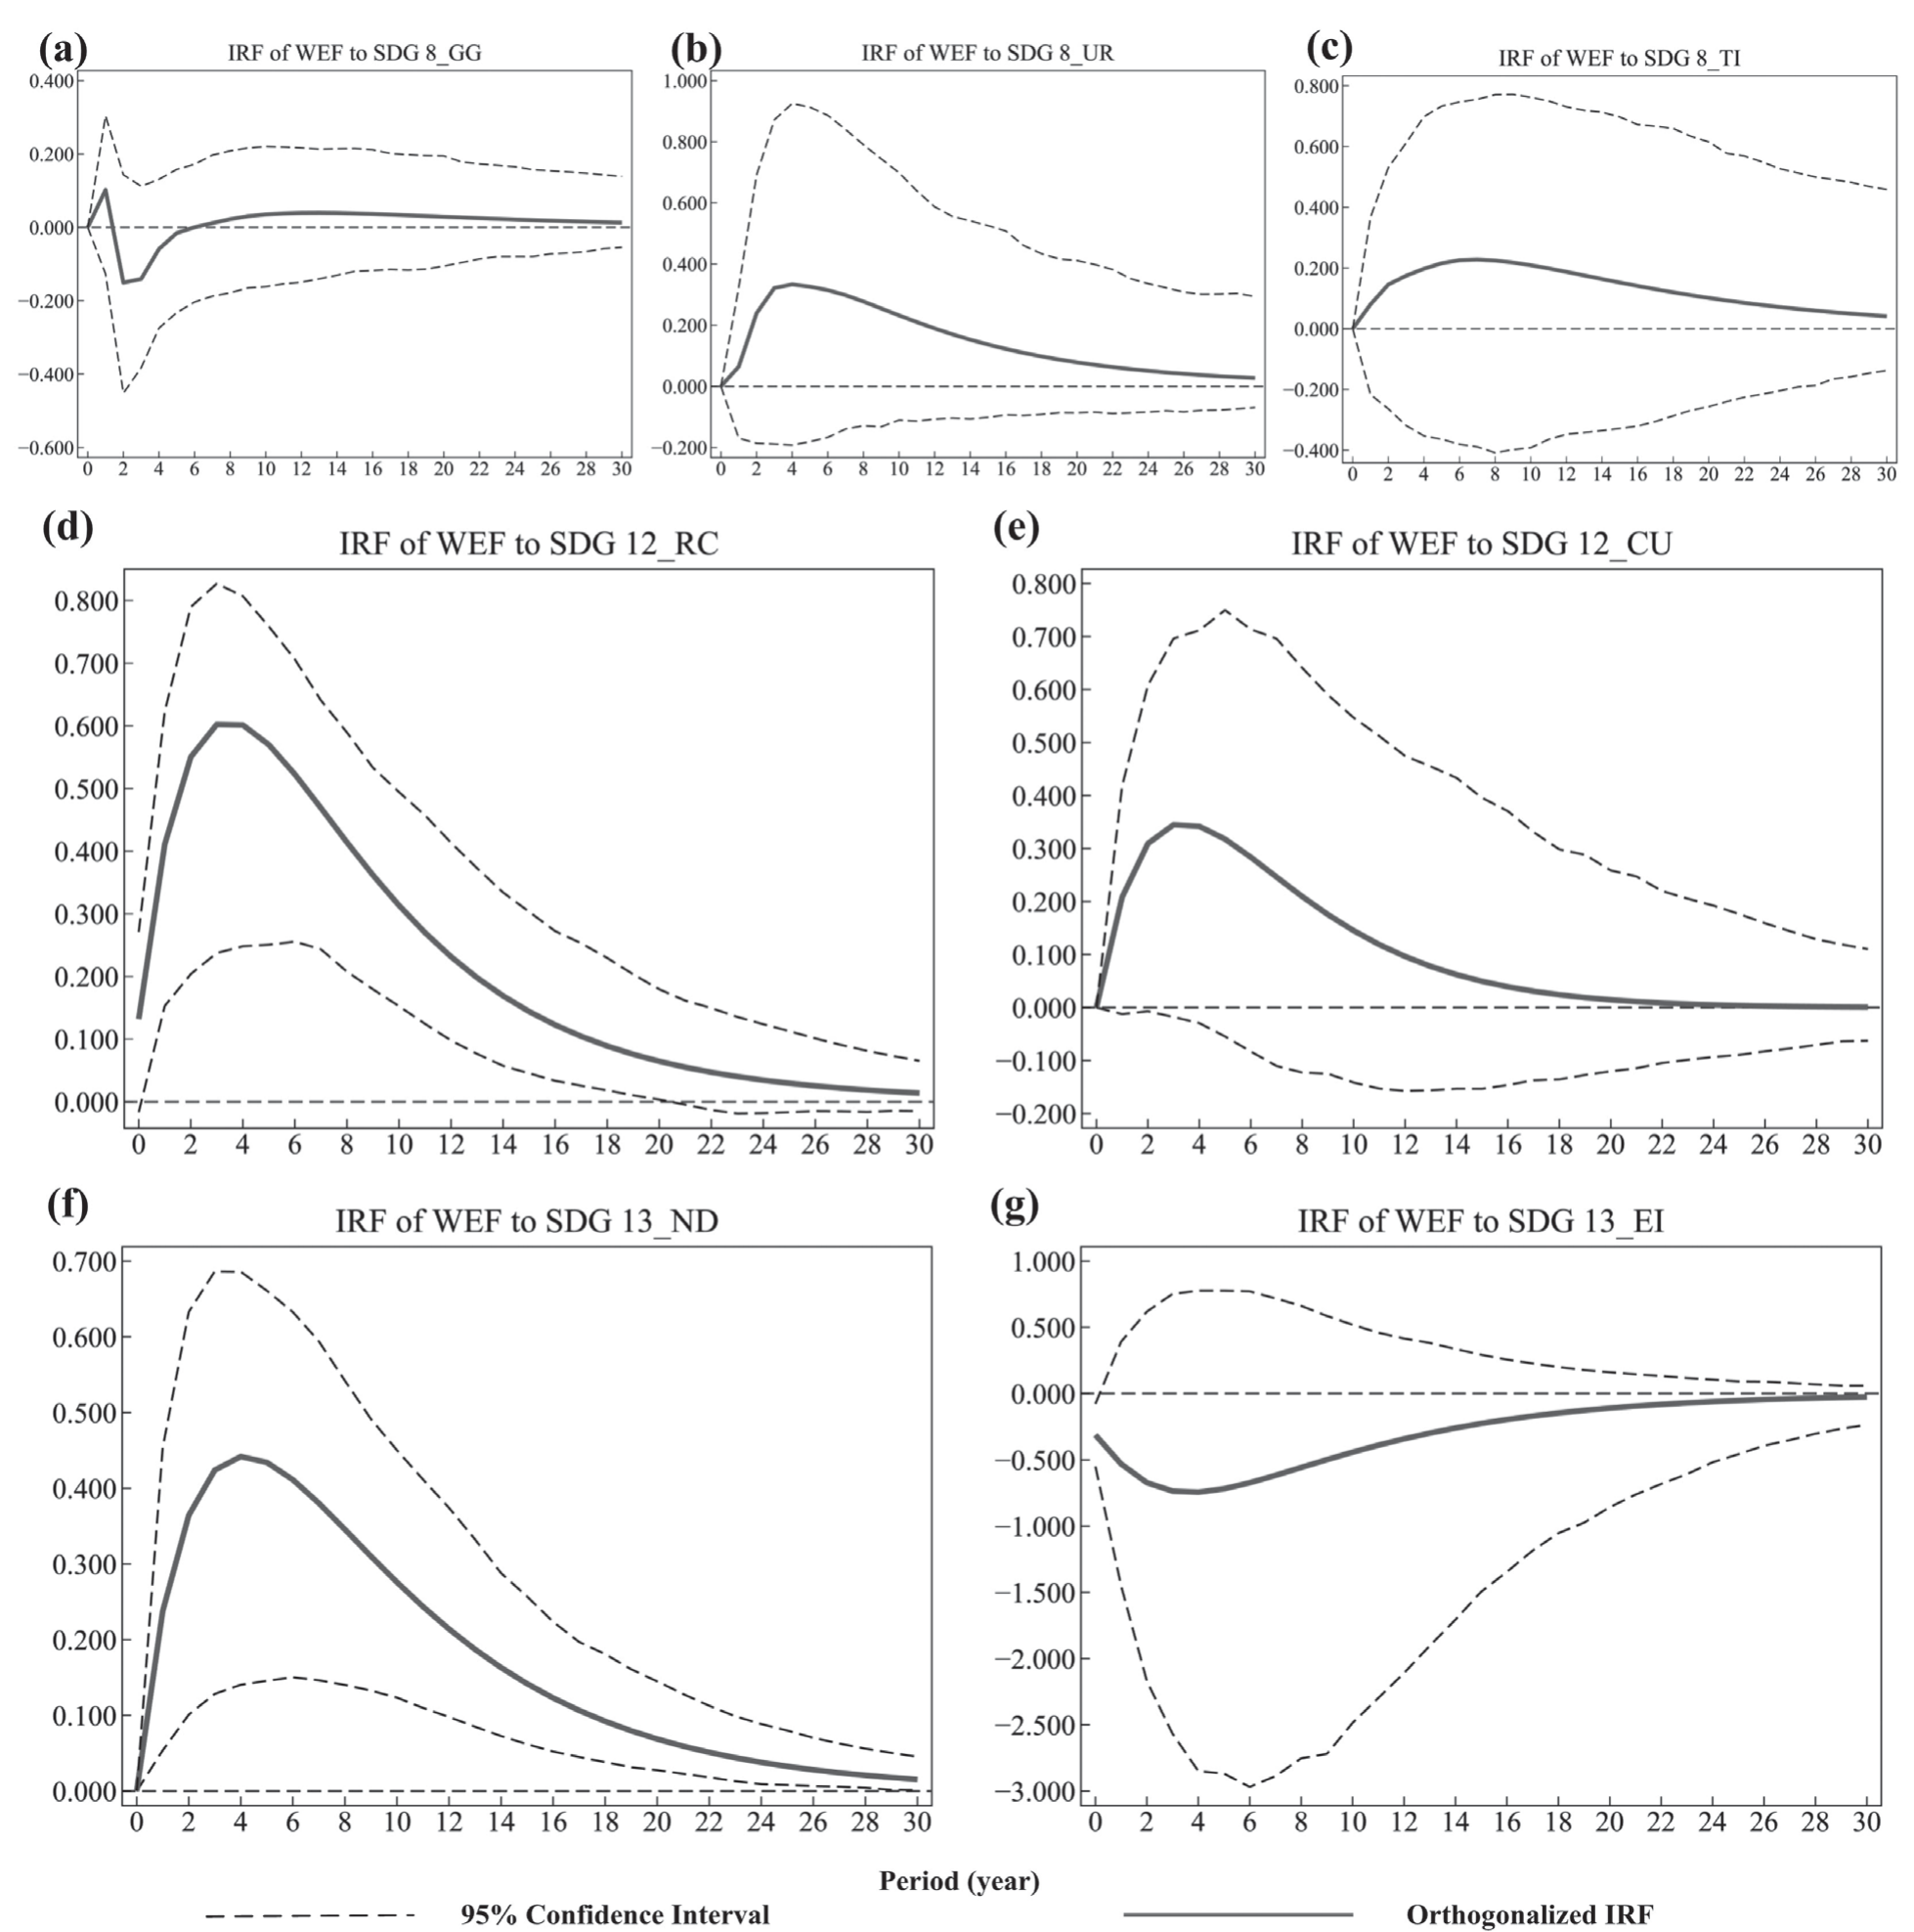
In order to isolate the specific response of the WEF system to individual actions related to SDGs, we used impulse responses in the PVAR model. We examined the impact of increasing the score of one indicator within each SDG by one unit, while holding the other indicators constant (Fig. 6).
Fig. 5.
The two-way interactions among the WEF system. The vertical axis represents the response value, and the horizontal axis is the lag period before the response. The black dashed line is the 95 percent confidence band, which is constructed based on 500 replications.
Among the three indicators of SDG 8, the impact of maintaining steady GDP growth on WEF sustainability varied across different stages. Initially, there was a positive shock to WEF sustainability in the first period. However, from the second period onward, it turned to a negative effect. After the sixth period, the effect turned positive and gradually converged (Fig. 6a). Differently, a unit increase in the score in the urban registered unemployment rate and the share of the third industry in GDP, both had a positive and lasting impact on the WEF system (Fig. 6b and Fig. 6c). It is worth noting that the effect of increasing the share of the third industry on the WEF sustainability was relatively smaller than that of reducing urban unemployment. The optimization of industrial structure can lead to decreased energy consumption per unit of GDP and lower pollutant emissions. Nonetheless, it is important to consider that technological improvements and the replacement of existing industries may inadvertently increase energy and water consumption, posing challenges in balancing competing needs for natural resources, which to some extent offsets the contribution to WEF.
Impact of SDG 12 on WEF Sustainability
Reducing per capita consumption of material resources contributed to WEF sustainability, with the highest impact occurring in the fourth period and lasting for approximately 30 periods (Fig. 6d). This result implies that the reduction in resource consumption and waste helped relieve pressure on water and energy demand. Furthermore, lowering SO2 emissions contributes to reducing atmospheric pollution and acid rain, which in turn mitigates water body pollution and restores crop productivity. The utilization rate of industrial solid waste positively impacted the WEF system, with the strongest influence occurring during the third period. This effect remained significant for approximately 20 periods thereafter (Fig. 6e). This means that incorporating industrial solid waste reuse practices can effectively decrease the discharge of pollutants into water bodies, resulting in a significant reduction in environmental contamination.
Fig. 6.
Impacts of SDG 8, SDG 12, and SDG 13 on WEF Sustainability. SDG 8 (Sustainable economic Growth) consists of SDG 8_GG, SDG 8_UR, and SDG 8_TI. SDG 12 (Sustainable Production and Consumption) consists of SDG 12_RC and SDG 12_CU. Impacts of SDG 13 on WEF Sustainability. SDG 13 (Climate Action) consists of SDG 13_ND and SDG 13_EI.
Impact of SDG 13 on WEF Sustainability
There was a significant negative association between reducing CO2 intensity and WEF sustainability (Fig. 6g). However, natural disaster reduction might have a positive effect on WEF, with a large magnitude, and peaked at the first period (Fig. 6f). This implies that the implementation of new energy technologies aimed at decarbonization inadvertently increase our dependence on water-intensive fuels. Although actions to reduce the intensity of CO2 emissions may initially have a negative impact on WEF sustainability, it is essential to consider that these efforts can mitigate climate change. This reduction in natural disasters not only restores the resilience of the WEF system but also helps avoid droughts and floods. Thus, the long-term benefits of reducing CO2 emissions outweigh the temporary challenges to some extent.
Further Discussion
From the Spatio-Temporal Evolution for WEF Sustainability
In 2004, China experienced a significant decline in its overall performance in SDG 2, primarily due to successive reductions in food production and increased vulnerability to international food price volatility. To address these challenges, the Central Government emphasized and refocused its efforts on agriculture, providing support to major food-producing areas and grain farmers. This shift led to a rebound improvement in SDG 2 score, emphasizing the significance of food security through increased food production, improved agricultural infrastructure, and active participation in international food markets. Both water and energy systems witnessed a remarkable increase of over 100% in the SDG scores within the period. This positive development can be attributed to increased investments in the related infrastructures and enhanced conservation efforts. For instance, the notable improvement of SDG 7 in 2006 can be attributed to China’s commitment that year to reduce energy consumption per unit of GDP by 20%, with effective energy reduction measures playing a significant role.
However, different regions exhibited distinct growth trends within the research period. Specifically, the western provinces saw a rapid rise in their rankings, indicating that these provinces have strengthened their water infrastructure and harnessed their energy resources to promote the development of clean energy projects, thereby narrowing the gap with other regions. In contrast, the eastern region experienced a decline in its rankings, particularly concerning the SDG 7 score. This decline can be attributed to low energy self-sufficiency, which limits the potential for energy savings and emission reduction within the constraints of the existing technological landscape. Consequently, it is imperative to persistently integrate green technologies across all sectors and industries to address these challenges effectively. It is also noteworthy that the provinces in the central region made progress in SDG 7 but lagged in SDG 13. This can be attributed to the rapid growth of traditional industries like coal, iron, steel, and chemicals during the early stages of development. The emphasis on traditional industries hindered progress in achieving SDG 7 and SDG 13. Therefore, despite progress being made towards SDG 7 through resource conservation and comprehensive utilization, achieving short-term reductions in carbon emissions remains a formidable challenge. This underscores the long-term consequences of excessive energy consumption, which result in carbon emissions, and further underscores the fact that efforts to reduce carbon emissions are a long-term endeavor. Overall, in order to enhance WEF sustainability, it is crucial to embrace a comprehensive approach that not only narrows the gap between China’s development process and the SDGs agenda, but also avoids the trade-offs caused by other SDGs actions.
From the Perspective of Internal Interactions within WEF System
Within the WEF system, giving priority to the implementation of SDG 6 fostered significant synergies with the other two systems. Conversely, prioritizing either SDG 2 or SDG 7 resulted in trade-offs within the water system. For example, the use of chemicals like fertilizers and pesticides in agricultural productivity has adverse effects on the water ecosystem, specifically causing phytoplankton blooms [38]. Prioritizing the development of water resources is a crucial strategy for achieving sustainability. On the other hand, water resources played a key role in both food and energy production. Nevertheless, the realization of SDG 6 necessitates collaborative efforts between the food and energy sectors. To address this, it becomes imperative to implement sustainable farming techniques and water-efficient energy practices, thereby achieving synergies between food and energy and furthering the overall equilibrium within the WEF system.
However, it is worth noting that trade-offs did exist in the interplay between SDG 7 and SDG 2. The implementation of SDG 7 demonstrated a positive effect on SDG 2, while conversely, SDG 2 had a negative impact on SDG 7 score, as renewable energy sources require large amounts of water and large tracts of land [39], they can compete directly (food for consumption) or indirectly (water for food production) with the food system [40], which undermines the objective of achieving sufficient food supply, as stated in SDG 2 [41]. Especially in water-scarce regions, mining operations involving conventional fossil fuels typically incur lower water costs compared to those involving unconventional fossil fuel deposits like oil sands, shale oil, and shale gas, which typically impose higher water inputs [51]. From the converse perspective, those actions taken under SDG 7 increase the available energy for SDG 2 initiatives [17]. Improved access to clean energy can, in turn, drive advancements in agricultural productivity through mechanization, better storage and processing, and enhanced irrigation, ultimately contributing to the alleviation of hunger and the reduction of food insecurity. In addition, the construction of clean energy projects creates employment opportunities, especially in rural areas, leading to increased incomes for residents [42]. Given the diverse pathways in clean energy development, such as hydroelectric, wind, and solar energy, which tend to have minimal adverse effects on farmland [27], the choice of energy sources significantly impacts interactions between water, energy, and food systems. Therefore, it is imperative to tailor the development of clean energy projects to the specific environmental and natural resource carrying capacity of each region, which not only mitigates conflicts between energy and food, but also acts as a critical optimization point for reducing the strain on water resources [43].
From the Perspective of External Impact on WEF Sustainability
When implementing relevant sustainable actions, the accelerated actions of SDG 8, 12, and 13 primarily enhanced the WEF sustainability. But the actions of maintaining GDP growth and reducing CO2 emissions negatively affected WEF sustainability. Exploring these trade-offs is often a crucial step to achieving sustainable development.
GDP growth is mainly driven by consumption, investment, and exports. From a consumption perspective, the increase in total consumption and the shift towards a consumption structure with a higher environmental footprint may be contributing factors to the temporary trade-offs. From an investment perspective, the short-term decline in WEF sustainability may be partially caused by the “rebound effect” [44]. Increased investment in environmental protection improves resource utilization efficiency, minimizing the need for resource extraction. However, the resulting savings can have a scale effect, leading to increased availability of resources and lower real expenditures. This, in turn, increases the additional demand for resources to some extent. Nevertheless, in the long run, green investment remains vital for advancing water and energy efficiency and promoting WEF sustainability. To achieve high-quality economic development through productive investments, it is imperative to expedite the implementation of production technologies to minimize cycle time and gain a competitive edge. Traditional consumption patterns in China revolved around high consumption, such as industrial energy consumption and non-intensive water usage [45]. From an export standpoint, although aligning with the requirements of importing countries can motivate domestic businesses to enhance technology and resource efficiency [46], it is important to acknowledge that exporting products, especially resource-intensive products, can result in increased resource consumption. To address these trade-offs, transitioning to environmentally friendly consumption patterns, shortening investment cycles to mitigate rebound effects, and decreasing the export of resource-intensive products are crucial strategies for promoting economic growth without adverse consequences.
On the other hand, there are trade-offs of WEF when aiming to reduce the intensity of CO2 emissions. Measures such as transition to low-carbon energy sources could result in a decrease of 10-34% in the net energy available to society [47]. In addition, it intensifies water scarcity due to water-intensive technologies like biofuel production, concentrated solar power, and carbon capture and storage. However, it is crucial to view this decline as an opportunity to optimize the overall energy mix and enhance energy efficiency in the long term. Therefore, it underscores the increased demand for careful selection of new energy technologies and the rational allocation of funds for climate change. In addition, implementing a carbon tax can encourage carbon emission reductions, by imposing a financial cost on greenhouse gas emissions, which may directly or indirectly affect the availability of resources. While it is beneficial for reducing industrial waste, it can increase energy costs and impact agricultural production, ultimately resulting in higher food prices [48]. Therefore, it is essential to conduct a comprehensive assessment of the effects of carbon reduction measures. Relying solely on a single measure is insufficient to fully offset the costs of reducing carbon emissions [49].
Furthermore, leveraging existing interactive relationships to propel sustainable process will stimulate innovation in resource management models. For instance, in the context of the impact of SDG 12, it is important to note that while enhancing solid waste utilization can benefit the WEF sustainability, the current waste generation and management patterns in China have a substantial ecological footprint. Traditional solid waste management modes will become more expensive and challenging in the future [42]. This emerging challenge is likely to drive technological innovations in waste treatment as well as shifts in production and consumption patterns. This finding may imply a reverse management paradigm, whereby strict restrictions on the consumption of resources could incentivize innovations towards more resource-efficient approaches in the long term [50].
Conclusion
This paper aimed to assess the sustainable development process of the WEF system in Chinese provinces and examined the interactions and driven factors from the SDGs perspective.
For the sustainable development process of the WEF system and related SDGs, it was found that WEF sustainability improved at different levels from 2003 to 2020. Notably, SDG 6 and SDG 7 exhibited the most substantial growth within the research period, attributed to amplified investments in associated infrastructures and intensified conservation efforts. However, it is imperative to note that SDG 2 is susceptible to fluctuations in food production and vulnerable to the volatility of international food prices. This underscores the necessity of implementing measures to ensure a steadfast domestic food supply.
It was also observed that each province made varying degrees of improvements in its WEF sustainability performance. The eastern region in China excelled in the sustainable development of the WEF system, serving as a role model to other regions. Nevertheless, despite its achievements, the region grapples with energy shortages, which have somewhat curtailed its advantage in SDG 7. In the western region, the scarcity of water resources and a delicate ecological environment intensified resource conflict. However, the development of clean energy projects, leveraging the advantage of resource utilization, has indeed played a significant role in narrowing the developmental gap with other regions. Provinces in the central region have made progress in SDG 7 but lagged behind in SDG 13 due to the early focus on traditional industries. While there has been some recovery in SDG 7, reducing carbon emissions requires sustained efforts and comprehensive strategies over an extended period. The northeastern region mainly relied on energy-intensive industries while having advantages in sustainable agriculture.
Furthermore, we examined both internal interactions and external drivers of WEF sustainability. This paper presents two internal conclusions regarding the enhancement of WEF sustainability. Firstly, prioritizing the development of water resources is a basic strategy for achieving overall WEF sustainability. Secondly, the selection of an appropriate new energy source emerges as a crucial factor in transforming synergies and trade-offs between food and energy systems. An external analysis comprises two key aspects. On one hand, it involves the specific measures to address the identified trade-offs. On the other hand, it proposes a reverse management paradigm that existing resource management modes will be driven by strict restrictions and further incentivize innovations.
Our study has several limitations that require ongoing improvement. Firstly, the selection of SDG 8, SDG 12, and SDG13 is based on their close relationship with economic growth, social development, and climate change. It is important to emphasize that the selection of these three SDGs does not suggest that other SDGs will not influence the WEF sustainability. The selection of SDGs should be ensuring that it reflects the actual issues prevalent in the region and identifies potential trade-offs accordingly. Additionally, our study relies on localized indicators based on interactions between the selected SDGs. Our research is focused on data from 2003 to 2020 in China, representing a specific phase of the WEF system, but it is crucial to consider the potential emergence of new role relationships in the post-epidemic period. It is crucial to recognize that the interconnections and relationships within the WEF system may evolve as new and more enriched data becomes available.

