

Introduction
In recent decades, nanotechnology has rapidly developed, especially in the areas of electronics, engineering and biomedicine. Carbon black nanoparticles (CBNPs), with a primary size of 10-500 nm, have been widely used in manufacturing materials, such as rubber and printing [1]. During production, CBNPs are released into the atmosphere, presenting inhalation hazards for the general population. CBNPs are also considered a core constituent of some air pollutants, such as particulate matter (PM), which is associated with increased morbidity and mortality in respiratory and cardiovascular diseases [2]. The previous studies have demonstrated that inhaled CBNPs can enter the central nervous system through the blood circulation and olfactory nerves, posing adverse effects on the central nervous system [3-5].
Due to great surface area, CNBPs generate greater threats to public health. Laurie et al. found that inhaled ultrafine iron-soot reached the brain via the olfactory nerves and was associated with indicators of neural inflammation [6]. The pulmonary effects of CBNPs have been well documented [7]. In addition, CBNPs can induce systemic effects in organs remote from the primary site of exposure. For example, CBNPs have been proven to accelerate the progression of atherosclerosis1 and increase vascular disease risks [8]. Meanwhile, genotoxicity has been observed in the liver after pulmonary exposure to CBNPs [9]. For CBNP-associated developmental toxicity, prenatal exposure to CBNPs has been shown to increase the reactivity of the offspring immune system and induce neurodevelopmental changes [10]. Evidence suggests that CBNP exposure induced long-lasting diffuse perivascular abnormalities, including swollen astrocytic end-feet in the cerebral cortex [11]. He et al. demonstrated that exposure to CBNPs increases seizure susceptibility in male mice [3].
With primary cultured neurons, CBNP exposure has been revealed to induce significant neuronal damage, manifesting as decreased expression of the neuronal marker MAP2; meanwhile, CBNPs exposure results in excitotoxicity, which may be ascribed to the enhancement of the action potential frequency in neurons [3]. Our previous study also showed that CBNP treatment decreased cell viability, accompanied by an enormous increase in generation of reactive oxygen species [12]. In addition, oxidative stress, inflammation and apoptosis in CBNP-induced neuronal toxicity were also proven following in vivo exposure of chicken embryos [13]. However, the underlying mechanisms of neurotoxicity induced by CBNPs remain poorly understood.
Metabolomics, which is the profiling of metabolites in biofluids, cells and tissues, is routinely applied as a tool for biomarker discovery [14]. Metabolites are substrates and products of metabolism that drive cell function. The combination of chemical analysis, research technology, bioinformatics, and metabolomics is commonly used to solve human health problems [15]. In the present study, metabolomic analysis was applied to unravel the potential adverse effects of CBNPs on the mouse brain, which may provide novel insight into the neurotoxicity mediated by CBNPs.
Material and Methods
Animals and Treatments
Male BALB/c mice (n = 24, 8 weeks old) were used in all experiments which were obtained from Experimental Animal Center of Nanjing Medical University. Food and water were given ad libitum. The mice were housed in plastic cages under controlled environmental conditions (temperature: 18~22ºC, humidity: 30~50%) with a 12:12 h dark/light cycle. The mice were randomly divided into four treatment groups: the control group and the CBNPs treatment groups (0.15 mg/ml, 0.5 mg/ml, 1.5 mg/ml). CBNPs Printex 90 were freshly prepared each time. In the suspension, CBNPs were suspended in normal saline (NS) and were de-agglomerated with the ultrasonic water bath for 30 min after vigorous vortexed to make sure the homogeneity. Each animal in the experimental group were intranasally administered by placing a pipette tip with the dosing solution (20 µl) into the nostril of the mouse once a day for 3 months, and the control animals received an equal volume of vehicle (NS).
And the experiments were conducted under the control of the Ethics Committee of Animal Care and Experimentation of Europe and approved by the Institutional Animals Care and Use Committee (IACUC) at Nanjing Medical University (IACUC-1801008).
Reagents and Materials (Particles)
Acetonitrile was acquired from Merck & Co Inc. (USA), deuterated phenylalanine was obtained from CDN ISOTopes (Canada), methoxypyridine and N-methyl-N-(trimethylsilyl)trifluoroacetamide were purchased from Sigma-Aldrich (USA). Other chemicals were analytical grade.
The carbon black nanoparticle Printex 90 (14 nm primary particle size) was purchased from Orion Engineered Carbons (Borger, USA) and stored in dry and sterile conditions.
MRI Imaging Technology in vivo
After treatment, 7.0 T magnetic resonance imaging (MRI, Bruker BioSpin MRI, Germany) was used to image the brains of the mice. Mice were anaesthetized and maintained with 2% isoflurane by continuous inhalation. Heart rate, respiration rate and rectal temperature were continuously monitored by a life sign monitor. Scanning coronal position of mouse head with T2 sequence (TR 3000 ms, TE 45 ms). In this experiment, the results were diagnosed and validated by two radiologists with over five years of work experience and they were blind to dose group.
Transmission Electron Microscopy Assay
After the neuroimaging studies, the mice were sacrificed, and the brains were immediately harvested and weighed.
The brains were collected and divided into three parts: the olfactory bulb, corpus striatum and hippocampus. The tissues were then immersed in 2.5% glutaraldehyde, after which the samples were rinsed 3 times with 0.1 M phosphoric acid for 15 min each time and postfixed in 1% osmium fixative for 3 hours. Subsequently, the brain tissues were immersed in 50% ethanol, 70% ethanol, 90% ethanol, 90% ethanol and 90% acetone (1:1) and 90% acetone for 20 min each at 4ºC and then immersed in a 100% acetone:embedding solution (2:1) volumetric mixture at room temperature for 4 h. Then, the brain tissues were immersed in 100% acetone:embedding solution (1:2) volumetric mixture at room temperature for 12 h, then immersed in pure embedding solution for 3 h at 37ºC, and subjected to a mixture of 100% acetone:embedding solution (1:2) volume for 12 h at room temperature and in pure embedding solution for 3 h at 37ºC and subsequently placed in the oven at 37ºC, 45ºC and 60ºC for 12 h, 12 h and 24 h, respectively. The sections were double-stained with 3% uranyl acetate and lead citrate. Finally, the slices were observed using a Japanese electronic JEM-1010 transmission electron microscope and photographed.
Brain Metabolic Extraction
Mouse brain samples were collected after dissection and stored in liquid nitrogen before analysis. The left half of the brain was placed in a 1.5 ml EP tube, and 800 μl of precooled 80% acetonitrile solution and an amount of deuterated phenylalanine were added. One steel ball (3 mm in diameter) was added to the EP tube, and the tissue was broken using a tissue crusher with a shaking frequency of 35 Hz for 15 min, which was repeated four times. The sample was centrifuged at 4ºC for 15 min at 12000 g after tissue fragmentation. A total of 300 μl of brain samples were concentrated and evaporated using a vacuum centrifuge concentrator, and 30 μl was mixed from the tissue supernatant of each sample to generate a sample pool for sample quality control (QC), divided into 300 μl per tube, and evaporated using a vacuum centrifuge. 70 μl of 20 mg/mL methoxypyridine solution was added after centrifugation, the mixture was vortexed for 2 min, and incubated at 80ºC for 40 min. After cooling to room temperature, 100 μl N-methyl-N-(trimethylsilyl)trifluoroacetamide (containing 1% TCMS, v/v) was used and incubated at 70ºC for 50 min. After centrifugation at 12000 rpm for 15 min at 4ºC, 150 μl supernatant was removed and placed in a sample bottle containing a liner tube for further analysis.
Brain Metabolite Measurement
Brain metabolites were detected using gas chromatography with time-of-flight mass spectrometry (GC-TOFMS, LECO, USA). A DB-5 MS (Agilent Technologies) fused silica capillary column (0.25 μm, 30 m × 250 μm) was employed for separation. The injector temperature was 280ºC, and the injection volume was 1 μl. The flow rate of helium carrier gas was kept at 1 ml/min. The initial column temperature was 80ºC and held for 4 min, ramped to 300ºC at a rate of 5ºC/min and held for 10 min. The ionization was carried out in electron ionization (EI) mode at 70 eV. Scan mass range (50-600 amu), scan rate 10 spectra/s, solvent delay time 4 min.
Multivariate Statistical Analysis
Multivariate statistical analysis was performed using Simca-P 14+ software, including principal component analysis (PCA) and orthogonal projections to latent structures-discriminant analysis (OPLS-DA). Cluster heatmap analysis was performed using the visual metabolomics analysis website Metaboanalyst 3.0 (http://www.metaboanalyst.ca). R code-based MetaMapp software was used for metabolic pathway analysis and the use of metabolic pathway analysis maps with CytoScape 3.4.0.
Statistical Analysis
SPSS 17.0 was used for statistical analysis. All experimental data are presented as means±SD unless otherwise noted. One-way ANOVA (one-way analysis of variance) was used to compare the quantitative data of multiple groups. Dunnett’s t test was used for two-by-two comparisons between multiple groups. Origin, GraphPad Prism and R Studio (R i386 3.3.1) were used for figure generation.
Results and Discussion
CBNPs Exposure Exerts no Obvious Changes in Brain Structure and Weight
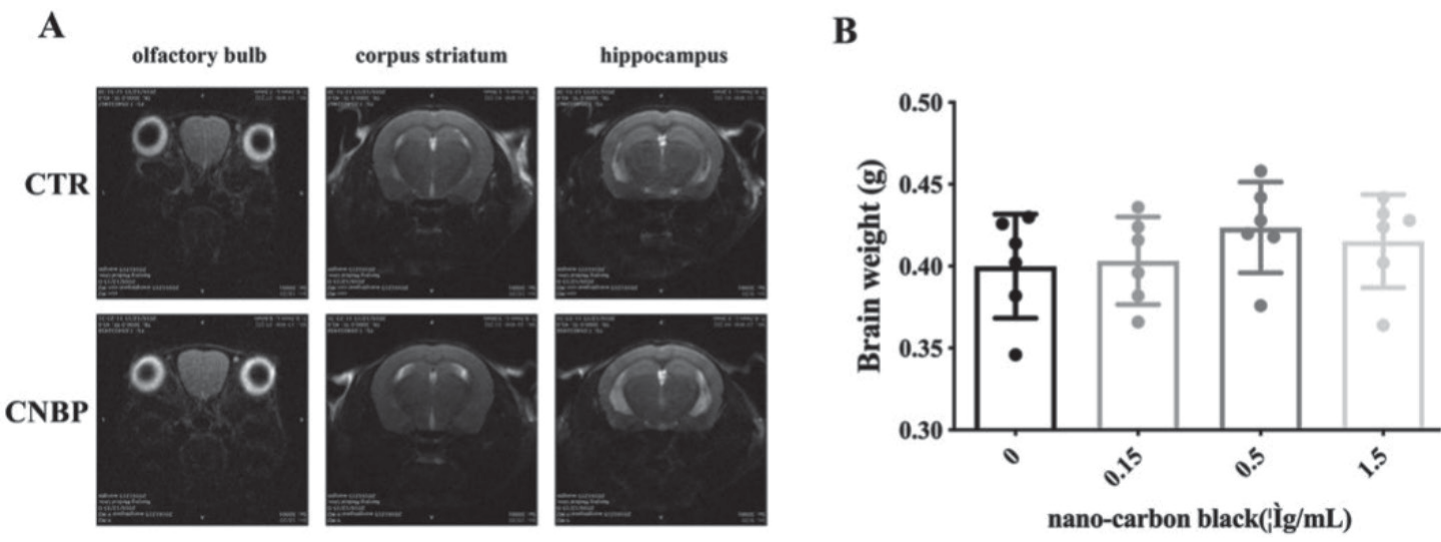
After exposed to Printex 90 for 3 months, body weight of mice haven’t been affected by treatment. and then the animal MRI assay was performed. The T2 sequences of the olfactory bulb, corpus striatum and hippocampus were not significantly affected compared with the olfactory bulb, corpus striatum and hippocampus of the control group (Fig. 1A). In addition, the whole brain was weighed by analytical balance, and no significant difference was found between the brain mass of the CBNPs treatment groups and the brain mass of the control group. (Fig. 1B).
CBNP Exposure Impairs the Ultrastructure of the Brain Region
To further examine the brain morphology after CBNPs exposure, transmission electron microscopy was used to observe the ultrastructure in several brain regions: the olfactory bulb, corpus striatum and hippocampus . After continuous CBNP exposure for three months, CBNPs were discovered to have a wide distribution throughout these brain regions. Notably, the mitochondrial cristae appeared disorganized and even disappeared in the CBNP treatment groups, documenting severe damage to mitochondrial structural integrity (Fig. 2).
Intergroup Differences in Metabolite Profiles Revealed by Principal Component Analysis
Having determined the adverse effects of CBNPs on mitochondria, which are important sites of carbohydrate and lipid metabolism, we examined metabolic homeostasis in the brain through GC/MS-based metabolite analysis.
As shown in Fig. 3, PCA score plots showed clear segregation between the four groups (R2X = 0.17, Q2 = 0.12). To further investigate the metabolic differences among these groups, the PLS-DA model was established. The scores of the CBNPs exposure groups were distinctly separated from the scores of the control group, indicating significant differences in the metabolome between the control and CBNP-exposed mice. To investigate the differentially abundant metabolites, a heatmap was generated, which clearly showed the alterations in the identified metabolites in the brain (Fig. 3E). The metabolites were screened, and the top 20 candidates were chosen with False Discovery Rate (FDR) principles. Similar to the results of PCA, the heatmap showed significant changes between the CBNPs exposure groups (0.5 mg/ml and 1.5 mg/ml) and the control group.
Fig. 2.
A) Electron microscopic observation of the olfactory bulb of mice exposed to CBNPs (scale bar = 1 μm). B) Electron microscopic observation of the olfactory striatum of mice exposed to CBNPs (scale bar = 1 μm). C) Electron microscopic observation of the olfactory hippocampus of mice exposed to CBNPs (scale bar = 1 μm).
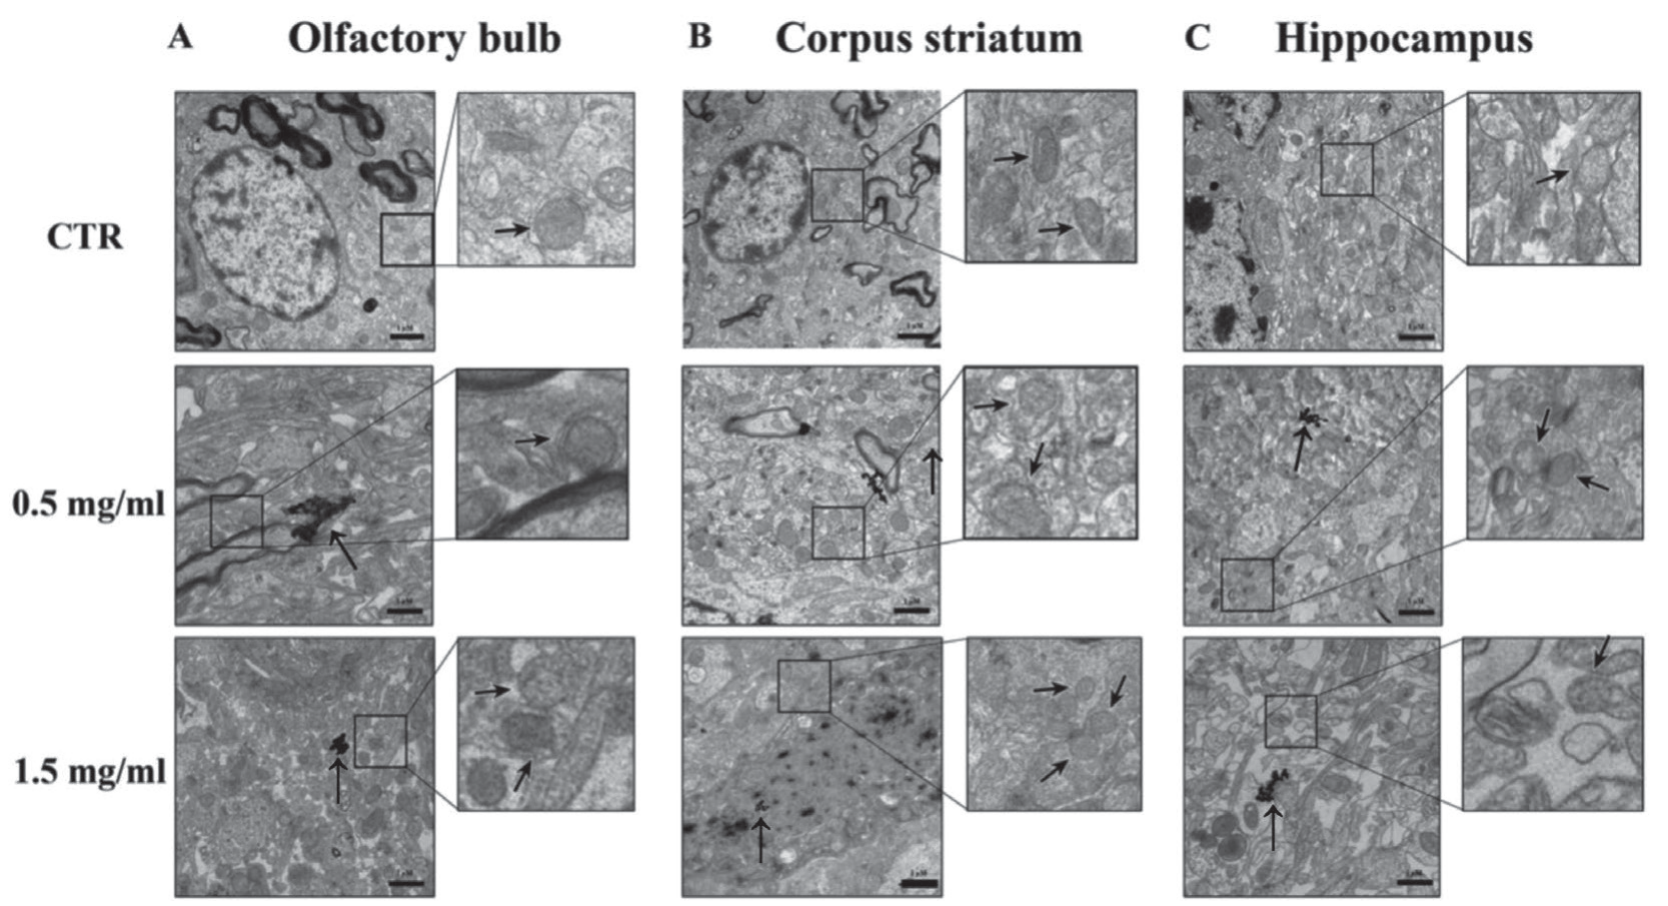
Fig. 3.
Supervised principal component analysis OPLS-DA used for multivariate statistical analysis of brain tissue metabolites in mice treated with different doses for 3 months. A) principal component analysis of brain metabolites; orthogonal projections to latent structures-discriminant analysis (OPLS-DA) for B) control and 0.15 mg/ml nanocarbon black-exposed groups C) control and 0.5 mg/ml nanocarbon black exposure group D) multivariate statistical analysis for control and 1.5 mg/ml nanocarbon black exposure group: scatter is the GC/MS metabolite assay results for each sample group (n = 6); data were log-transformed and Pareto-scaled E) Hierarchical Pearson Clustering Heatmap Analysis.
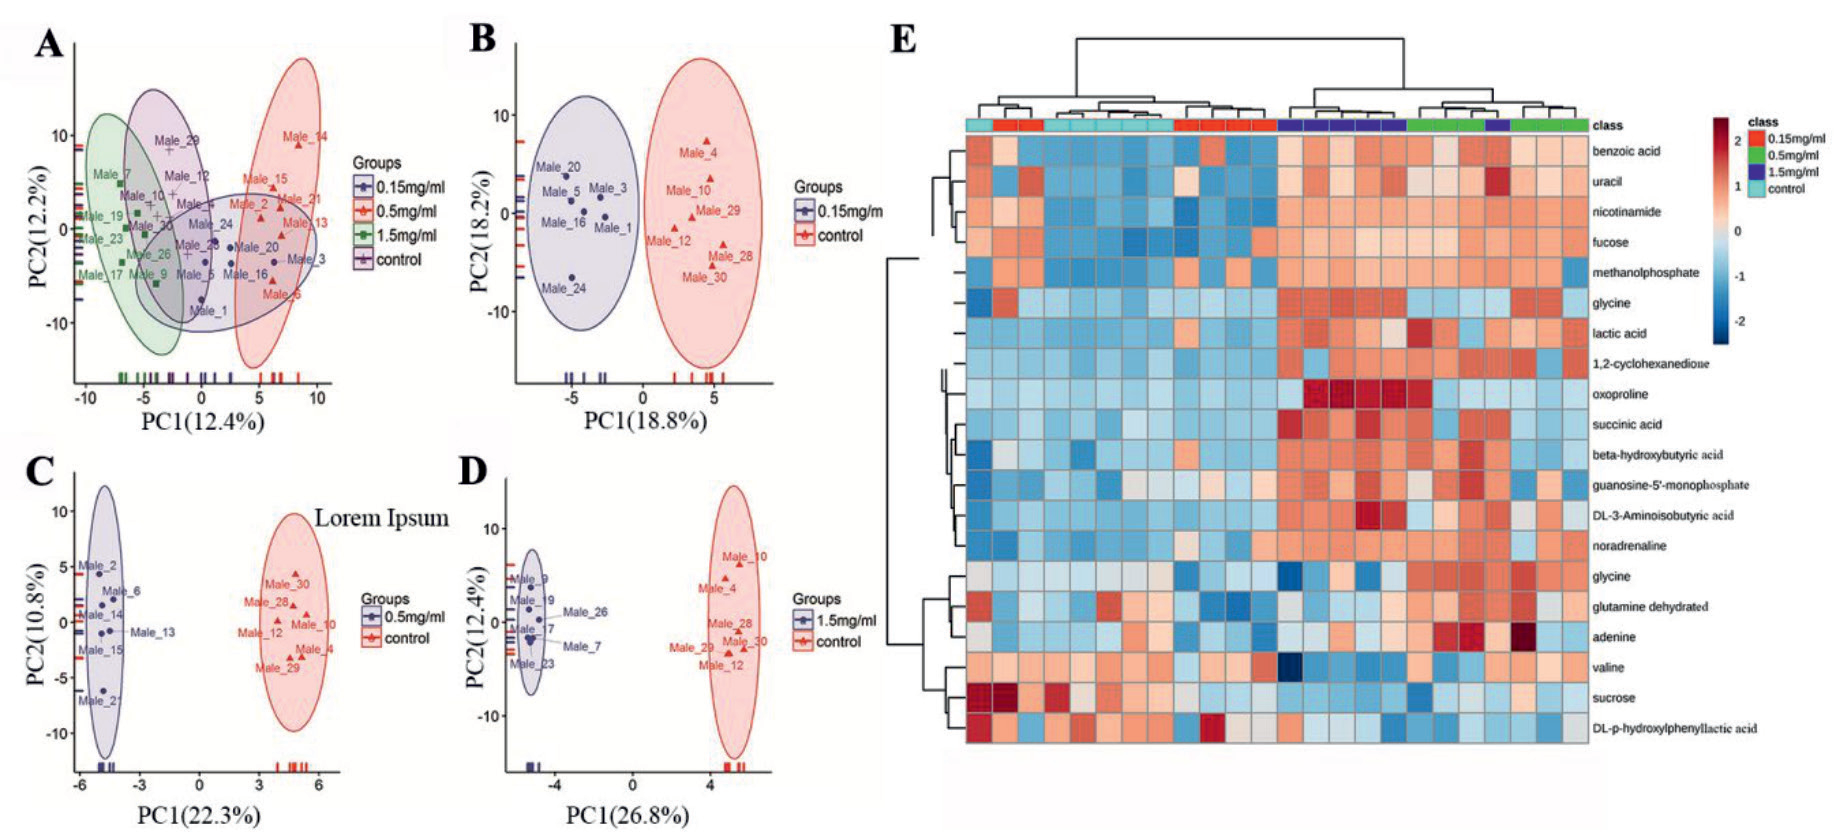
Fig. 4.
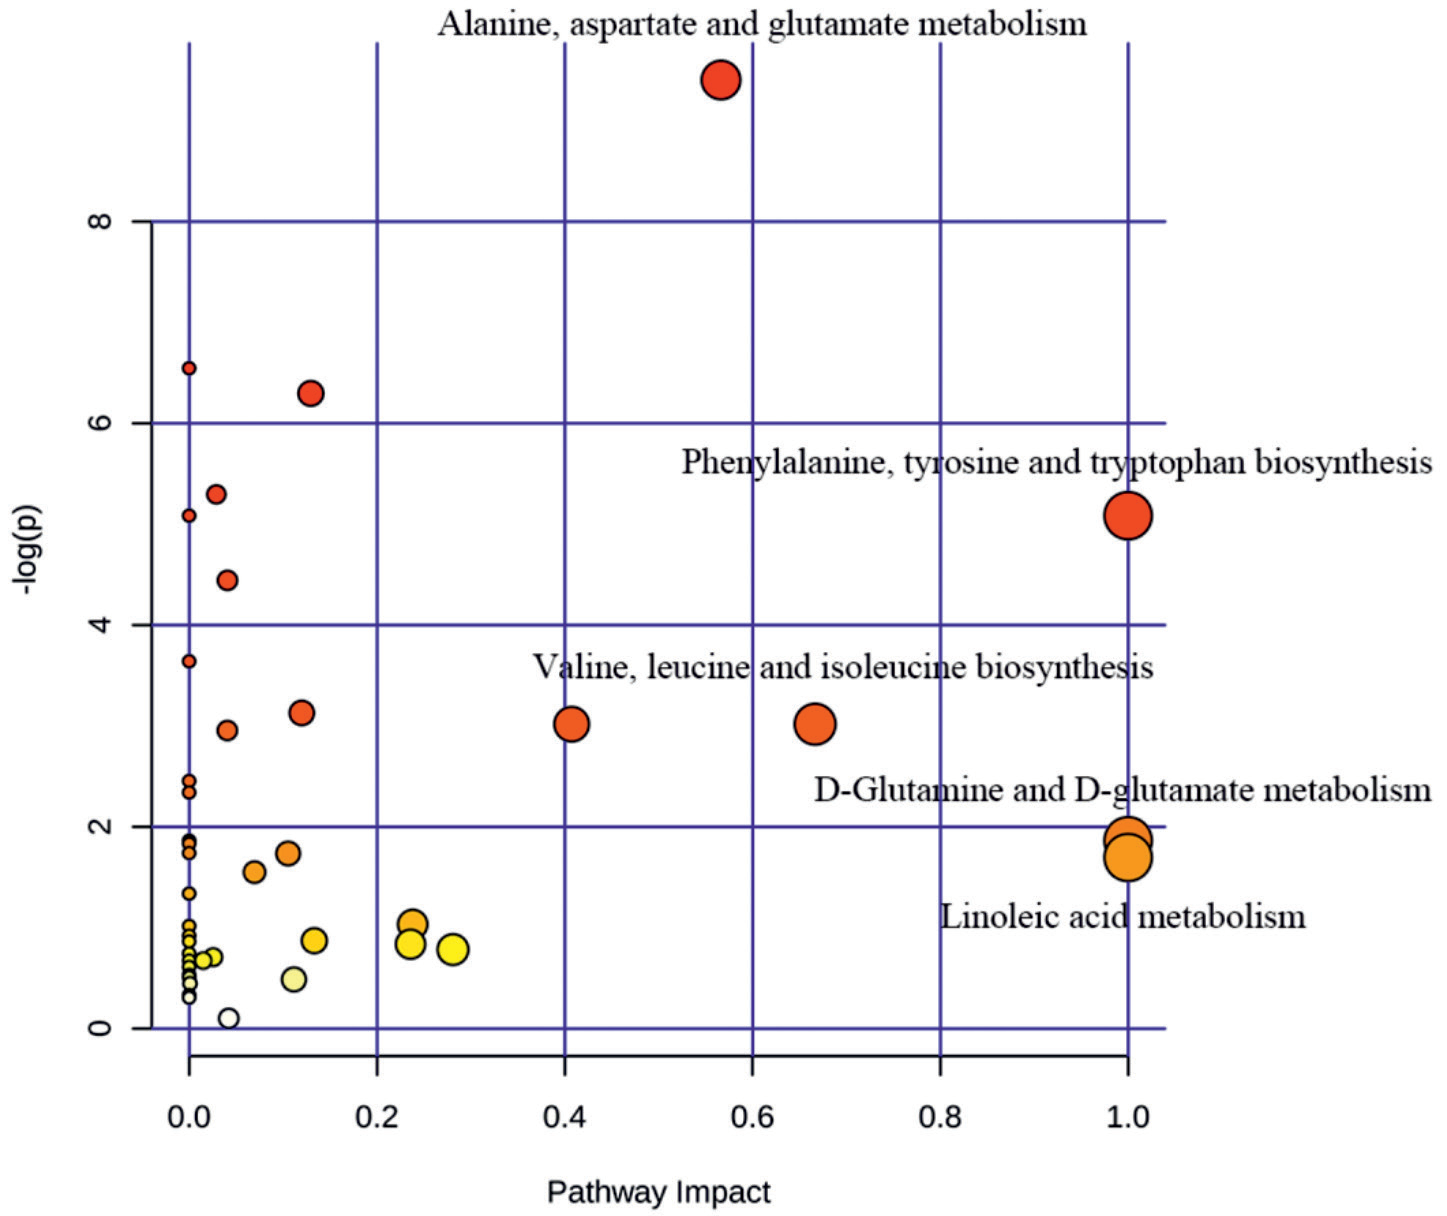
Metabolic pathway enrichment analysis, screening metabolites with Fold Change value <0.5 or >2, x-axis represents the degree of influence of the metabolic pathway, the y-axis represents the degree of enrichment of metabolic pathway, the circle size and colour shade in the graph indicate the degree of enrichment and influence of each pathway, as well as brain metabolite pathway enrichment.
Metabolism Pathway Enrichment Analysis
To further explore the metabolic effects after CBNPs exposure, metabolic pathway enrichment analysis was carried out by MetaboAnalyst 3.0. Metabolic pathways with a fold change <0.05 or >2.0 were screened out. The results showed that phenylalanine, tyrosine and tryptophan biosynthesis, D-glutamine and D-glutamate metabolism and linoleic acid metabolism were obviously affected (Fig. 4). However, MetaAnalyst 3.0 does not support metabolic pathway integration analysis, suggesting further analysis of metabolic pathways.
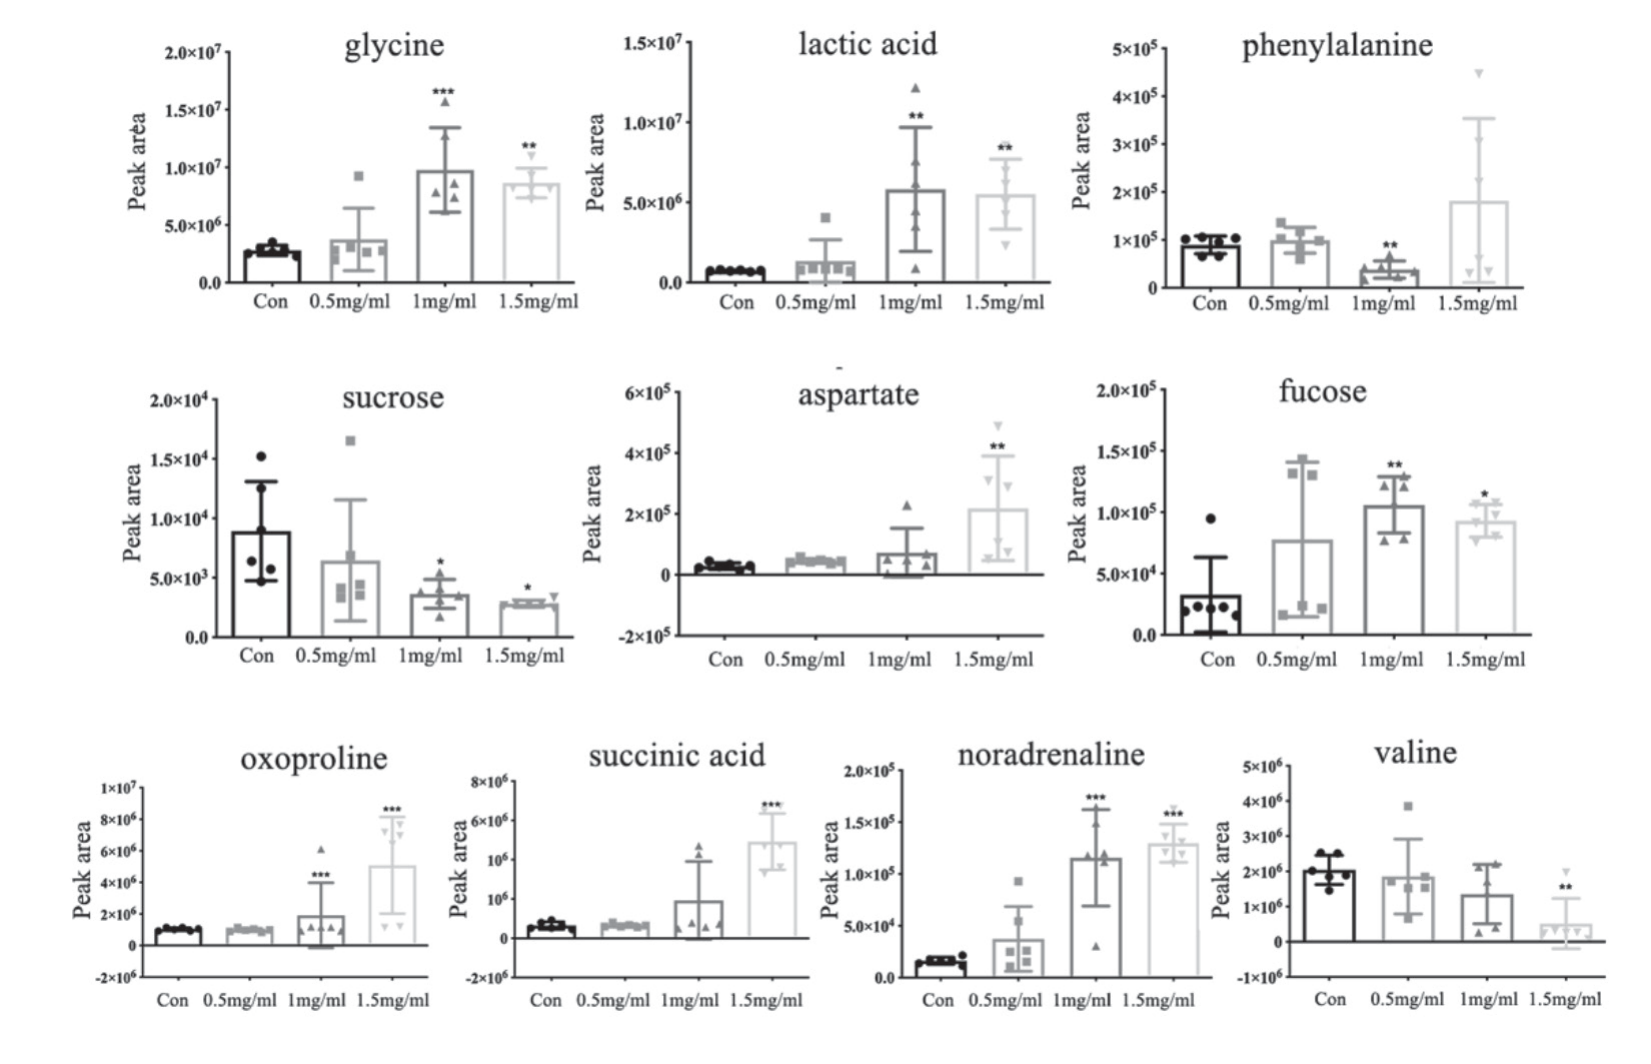
Fig. 5.
Comparison of peak areas of brain metabolites within the four groups, metabolite screening using MS DIAL software with Fiehn mass spectrometry database, parameter VIP value>1, P<0.05, database comparison similarity >700; Dunnett-t test for significance between CBNP-dosed groups and control. (*P<0.05, ** P<0.01, *** P<0.001).
CBNPs Exposure Changes Brain Metabolites
Amino acids perform critical metabolic functions and are used for the synthesis of proteins, the formation of other low-molecular-weight compounds, and energy production by intermediate metabolites fueling other biosynthetic pathways [16]. To explore the differential changes in the identified metabolites between groups, the concentrations of metabolites in each group were compared. The results showed that the glycine, lactic acid aspartate, oxoproline, succinic acid and noradrenaline levels were significantly increased upon CBNPs exposure. We have improved the description of this results. In the levels of phenylalanine were markedly decreased after CBNPs treatment in the middle exposure group (0.5 mg/ml), valine level were significantly decreased in the high exposure group (1.5 mg/ml). Meanwhile , after CNBPs exposure, the fucose of mice in middle-dose(0.5 mg/ml) and high-dose (1.5 mg/ml) groups decreased significantly (Fig. 5).
Integration Metabolic Pathway Analysis
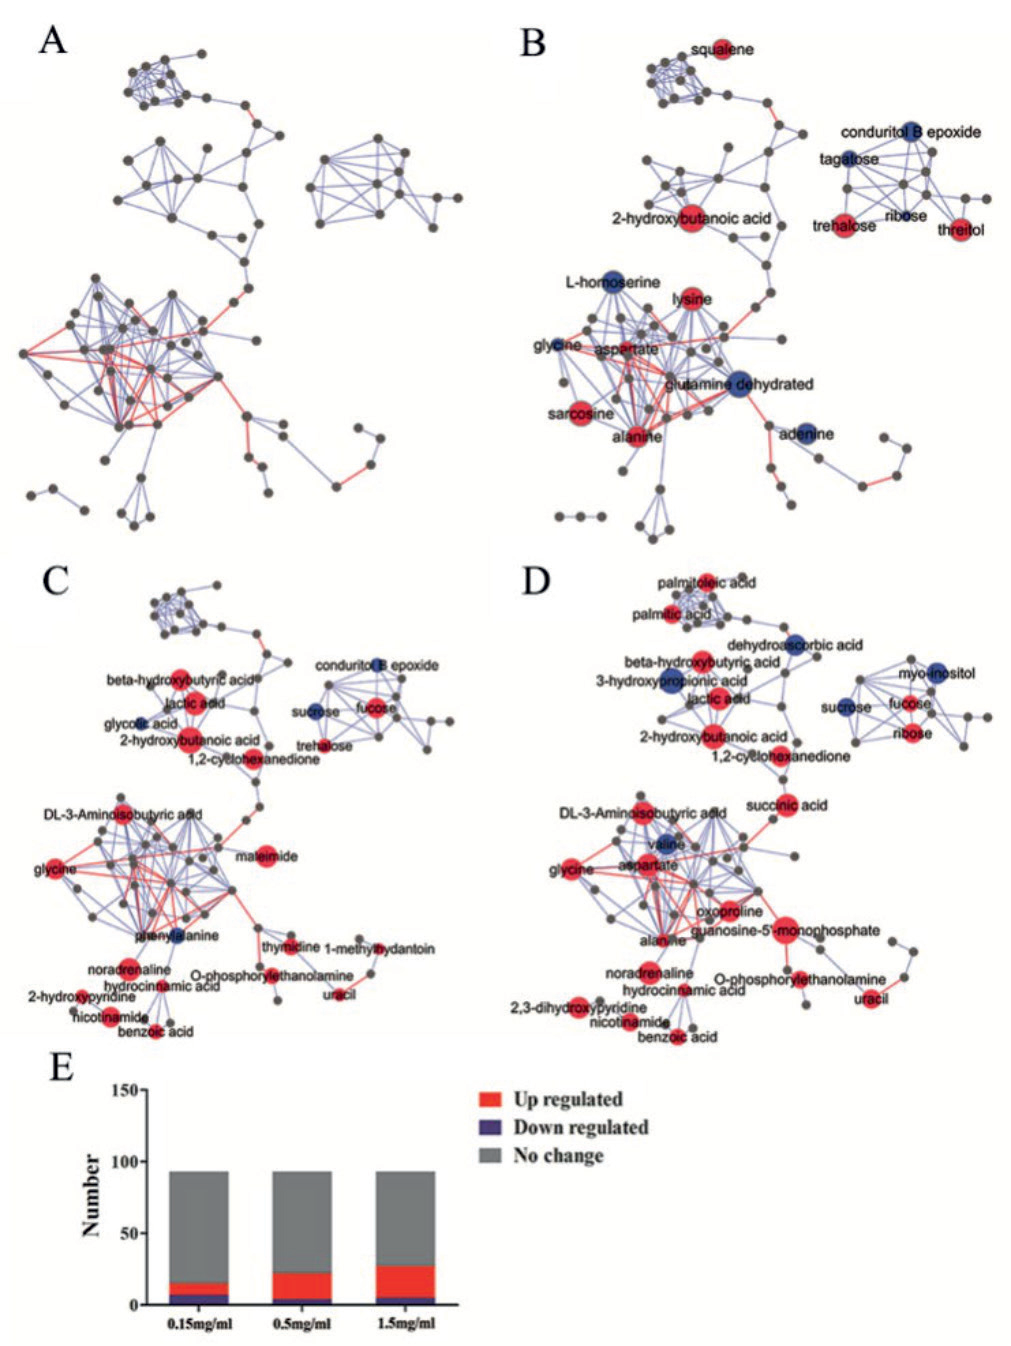
MetaMapp, a tool for integrating information from biochemical pathways and chemical and mass spectral similarity, was used [17]. The red nodes reflect the metabolites found to be upregulated, while those downregulated ones are shown in blue. Red edges denote Kyoto Encyclopedia of Genes and Genomes (KEGG) reactant pair links. Blue edges denote Tanimoto chemical similarity with T>700, clearly showing that 15 metabolites were significantly changed in the low exposure group (0.15 mg/ml) compared to the control groups, 8 metabolites showed a tendency of elevation and 7 metabolites were obviously decreased (Fig. 6B). Meanwhile, 18 metabolites were elevated in the middle exposure group (0.5 mg/ml), while 4 metabolites were decreased in the middle exposure group. (Fig. 6C). In the high exposure group (1.5 mg/ml), 29.03% (27/93) of the metabolites were significantly changed (Fig. 6D). Overall, 22 metabolites were markedly increased, while 5 metabolites were downregulated. In the CBNP-treated group, 4 pathways were enriched in the low exposure group, particularly the alanine, aspartic acid and glutamic acid metabolic pathways. Eleven metabolic pathways were significantly changed in the middle-dose exposure group, particularly phenylalanine, tyrosine and tryptophan biosynthesis. Phenylalanine metabolism, glycine, serine and threonine metabolism and niacin and niacinamide metabolism were also affected. Integrated metabolic pathway analysis also revealed that 13 metabolic pathways were significantly altered in the high exposure group, including glycine, serine and threonine metabolism; alanine, aspartate and glutamate metabolism; and valine, leucine and isoleucine biosynthesis (Fig. 6E).
As a primary component in air pollution, CBNPs have gained increasing attention due to their potential toxicity; therefore, a better understanding of the mechanism of CBNP-induced toxicity may allow for the appropriate regulation of potential health hazards. CBNPs can enter the central nervous system through blood circulation and olfactory nerves, affecting brain development and increasing neurological disease susceptibility [3]. In the present study, we investigated the neurotoxicity of CBNPs in the brains of mice exposed to the CBNP Printex90, which is often used as a model particle in toxicological research of particulate air pollution [18].
Fig. 6.
Diagram of metabolic pathways of mouse brain metabolites. Metabolomic comparison between the A) blank control group, B) 0.15 mg/ml nanocarbon black-exposed group, C) 0.5 mg/ml nanocarbon black-exposed group, and D) 1.5 mg/ml nanocarbon blackexposed group. Metabolic pathways were generated by MetaMapp and mapped by CytoScape; red are upregulated metabolites, blue are downregulated metabolites, and grey are metabolites without statistical significance, calculated based on ploidy changes in MetaMapp; red lines are metabolic relationships between metabolites that can be looked up in KEGG, blue lines are metabolites according to PubChem provided by the size of the balls in the graph indicating the magnitude of the ploidy change values. E) Statistics of metabolite changes in the different dose groups.
In a previous study, Printex90 was revealed to be distributed in the brain via system circulation [4]. To investigate whether chronic Printex90 exposure contributes to brain morphologic alteration, the MRI assay was exploited to scan the brain regions of the olfactory bulb, corpus striatum and hippocampus. However, the MRI assay revealed no significant changes in the CBNP exposure groups compared with the control group. Nonetheless, the detailed deciphering of CBNP-mediated neural damage using transmission electron microscopy revealed that the nanocarbon black particles were observed in all three brain regions of the 0.5 mg/ml and 1.5 mg/ml nanocarbon black-exposed groups accompanied by cellular substructure alterations (blurring and even disappearance of mitochondrial cristae) in the olfactory bulb, striatum, and hippocampus regions, strongly supporting the evidence that nanocarbon black directly enters the brain, resulting in the abnormal substructure of mitochondria, which may finalize neurotoxicology. Notably, once CBNPs enter the brain, they can be retained for a very long time, even for the entire lifespan [19]; thus, we suspected that CBNP-induced neurotoxicity may be in part due to the persistent accumulation of CBNPs in the brain. Mitochondria are potential target organelles for CBNP-induced toxic effects [20]. Mitochondria are both the major intracellular source of oxidative stress, and mitochondrial dysfunction induces ROS generation [21]. Excess ROS production leads to impaired cognitive function in the brain, which facilitates neurodegeneration [22]. In the present study, we found a remarkable decrease or even disappearance of mitochondrial cristae in neural cells of the mouse brain after chronic CBNP exposure, suggesting that mitochondria may be an important target for CBNP neurotoxicity; therefore, metabolic homeostasis must be explored.
As expected, the PCA and OPLS-DA plots of the 0.5 mg/ml and 1.5 mg/ml exposed groups were more clearly separated with the increased dose, and the metabolic profiles were significantly different. Meanwhile, the metabolic heatmap also verified the aforementioned results, suggesting that CBNP exposure causes metabolic disturbance in the mouse brain.
To fully ascertain the changes in the metabolites in the mouse brain, the metabolites were analysed. Lactate is one of the main cerebral metabolites, and the presence of excess lactate levels indicates activated glycolysis in an oxygen-deficient environment where mitochondrial function is disrupted [23]. In support of our results, in the present study, we found obvious impairment of mitochondrial structure accompanied by markedly increased levels of lactate after CBNP exposure. This result suggested that CBNP exposure may cause hypoxia in some regions of the brain, which exacerbates the neurotoxic effects of CBNPs. Similar to gamma-aminobutyric acid, glycine is a well-known inhibitory neurotransmitter in the CNS [24]; glycine is an integral component of glutathione, the main antioxidant molecule of the cell. Therefore, glycine is required to maintain the cellular redox balance. In mitochondria, glycine fuels haem biosynthesis and thus sustains oxidative phosphorylation [25]. In the current work, the glycine level was significantly increased after exposure to CBNPs. We hypothesize that a hypoxic state of the brain, with impaired oxidative phosphorylation, was involved.
Phenylalanine is an indispensable amino acid that cannot be synthesized endogenously in the human body and therefore needs to be obtained from the diet. Phenylalanine is necessary for protein synthesis and is converted to tyrosine in cells [10]. Tyrosine is either used for protein synthesis, oxidized, or converted to important neurotransmitters, such as epinephrine, norepinephrine and dopamine [26]. In our study, the level of phenylalanine was significantly decreased. Aromatic amino acids in the brain function as precursors for the monoamine neurotransmitters serotonin and catecholamines [27]. As a consequence, the decline in these amino acid levels influences the rates of conversion to neurotransmitter products, contributing to neurotoxicity. To strengthen this effect, our previous study and other studies suggested that dysregulated tryptophan, phenylalanine and tryosine metabolism was closely associated with neuropsychiatric symptoms, such as depression [28]. These results suggest that CBNP exposure leads to metabolic disorders of phenylalanine, tyrosine and tryptophan.
Valine, leucine and isoleucine, the three essential amino acids, constitute the group of branched-chain amino acids (BCAAs). BCAAs are taken up to the brain parenchyma, where they serve several functions, such as as fuel material in brain energy metabolism [29]. In the current study, valine levels were significantly decreased in the brains of mice exposed to CBNPs, implying impaired energy metabolism after exposure to CBNPs. In the CNS, BCAAs play key roles in neurotransmitter synthesis, and disturbance of protein synthesis is implicated in neuronal diseases. Available results have shown metabolic disorders when BCAAs are in excess or limiting [30].
The fucose levels were also significantly increased in the brains of mice exposed to CBNPs, but the sucrose levels were decreased, suggesting a glycometabolic disorder after CBNP exposure. Fucose moieties on cell-surface glycans are increasingly recognized as critical to cell-cell interactions and signalling processes [31]. Fucose also ameliorates tryptophan metabolism and behavioural abnormalities in a mouse model of chronic colitis [32], and L-fucose can inhibit macrophage M1 polarization, inactivate the NLRP3 inflammasome and reduce the release of TNFα, IL-1β and IL-6 proinflammatory cytokines [33]. In the present study, the level of fucose was significantly decreased after exposure to CBNPs, suggesting the reduced protective effects of fucose in CBNP-induced neuropathnic damage.
Taken together, the current study directly proved that CBNP exposure contributes to the disturbance of metabolic homeostasis, characterized by the dysregulation of amino acid metabolism and glucose metabolism, which may provide novel clues for neuropathic damage after CBNP exposure.
Conclusions
In this study, a metabolomic approach was exploited to assess the potential toxicity of CBNPs in the mouse brain. The different metabolites induced by CBNPs were screened and indicated as potential biomarkers for CBNP exposure. Meanwhile, several metabolic pathways, such as amino acid and glucose metabolism, were involved in CBNP exposure, which may provide beneficial clues to unravel the toxic mechanism in CBNP-induced neural damage.

