Introduction
Chromium chemicals are used as raw materials in different industries, e.g. metallurgy, printing and dyeing, leather making, and other industries [1], which cause Cr to release into the environment. Relatively high concentrations of Cr have been reported in different environmental media due to Cr emissions from these potential sources [2]. Chromium cannot be degraded and usually has two oxidation forms, Cr(III) and Cr(VI) [3], with the later being an extreme toxicant threatening human health [4, 5]. Cr(VI), an oxyanion, has much faster transport dynamics due to it negative charging [6], and is highly susceptible to transport in soil-ground water systems [7].
Interaction between Cr(VI) anion and soil components has been extensively reported, for example, the formation of Cr(VI)–HAs micelles via supramolecular chemical processes [8]. Although limited studies have involved the dynamic process of co-transport of Cr(VI) and soil components, they are still helpful for evaluating Cr(VI) behaviors. For example, it has been reported that the potential for competition between PFOS and Cr(VI) was a function of the geochemical composition of the porous media (i.e., organic carbon and metal oxides clay minerals) in the co-transport of PFOS and Cr(VI) [9].
Although soil inorganic colloids don’t have as many rich functional groups as organic colloids, they still have very active properties and affect the transfer and transport of heavy metals in soil profiles and soil-groundwater systems [10]. The co-transport of metal cations and soil clay mineral colloids were extensively investigated. For example, it was found that kaolinite colloids promoted Cd(II) transport under low IS conditions compared to single transport, but inhibit Cd(II) transport at high IS [11], which might result from the presence of mineral colloids. Limited reports on Cr(VI) anion also showed the inhibited or facilitated transport of Cr(VI) at different concentrations of bentonite colloidal particles [12, 13].
Natural soil environments are heterogeneous and may have laminar structures and coarse and fine-grained channels [14]. Therefore, aside from the solution conditions and colloid properties, the heterogeneity of the medium affects contaminant and colloid co-transport. Previous reports show that structural heterogeneity facilitated transport in kaolinite colloids, and colloids broke through earlier in strongly heterogeneous columns [15]. Mass exchange at the particle interface was observed in systems with coarse and fine particle channels [16]. Heterogeneous structures can be simulated in the lab via columns filled with different-sized particles in a left-right arrangement, which have been used to study the transport and retention of particles [17]. However, colloids and Cr(VI) co-transport in heterogeneous media in the simulated column remain limited, and further investigation should be carried out systematically.
In this study, heterogeneous sand columns in a left-right arrangement were built as porous media. Breakthrough curves (BTCs) of the co-transport of Cr(VI) with bentonite colloids, a typical inorganic mineral, were obtained by column experiments at different conditions of flow rate, pH, ionic strength (IS), humic acid concentration (HA), and colloid concentration. Co-transport of Cr(VI) with other mineral colloids was also carried out for comparison. Single Cr(VI) transport was performed as the control. The aim of this work was to assess the effect of bentonite colloids on the transport of Cr(VI) in heterogeneous media under different conditions. It may provide some useful information for predicting the behaviors of Cr(VI) in soil profiles and a better understanding of these processes in soil-groundwater systems, helping the control of Cr(VI) contamination in the soil-groundwater environment.
Material and Methods
Preparation of Colloids
Bentonite colloid (Bc): The bentonite colloidal suspension was prepared from bentonite (A.R., 80- mesh screen sieved) through ultrasonic dispersion at 240W (F-040P, Fuyang Acoustic Technology Co., Ltd., Shenzhen, China) for 2 h [18]. Kaolinite and montmorillonite colloid (Kln and Mnt): Kaolinite/ montmorillonite (A.R.) was ball milled by a wet milling method at a sample-to-pure water ratio of 1:1 (g/mL) for 12 h using a planetary ball mill instrument (XGB04, Boyuntong Instrument Co., Ltd., Nanjing, China). After the samples were lyophilized, they were ultrasonically dispersed for 2 h (240 W), and then the as-prepared samples were left for 1 h, standing still [15, 18, 19]. The stable colloidal suspension of Bc, Kln, and Mnt was obtained by siphoning. All raw materials above were purchased from Aladdin Reagent Co., Ltd. Shanghai, PR. China. Soil inorganic colloids (Sc) were also separated from an uncontaminated neutral soil (0~20 cm; 114.52° E, 37.89° N, China) in an abandoned chromate chemical site. Soil pH was 7.67±0.04 (soil: water = 1g : 10ml for 30min). Content of organic matter (OM) was 0.60±0.05%.Sc was obtained using an H2O2 oxidation - siphoning method of Xu et al [20] with some modifications. The uncontaminated soil sample was fully mixed with pure water (soil: water = 1g : 15ml) and then oxidized by 6% H2O2 to remove the organic matter. The Sc colloid suspension was then obtained by siphoning. The average hydrodynamic particle sizes of each colloid were 5540 nm (Bc), 269 nm (Kln), 506 nm (Mnt), and 332 nm (Sc), respectively, determined by using a dynamic light scattering instrument (BI-Zeta PALS, Nano Brook, USA).
Column Experiments
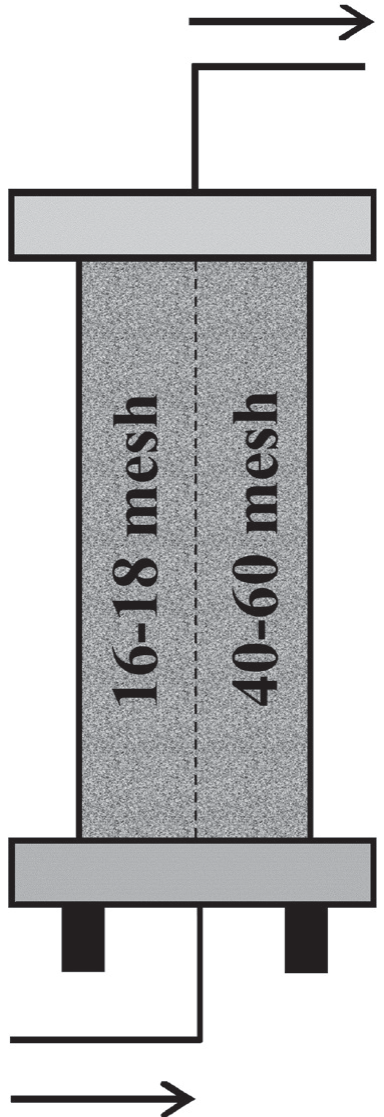
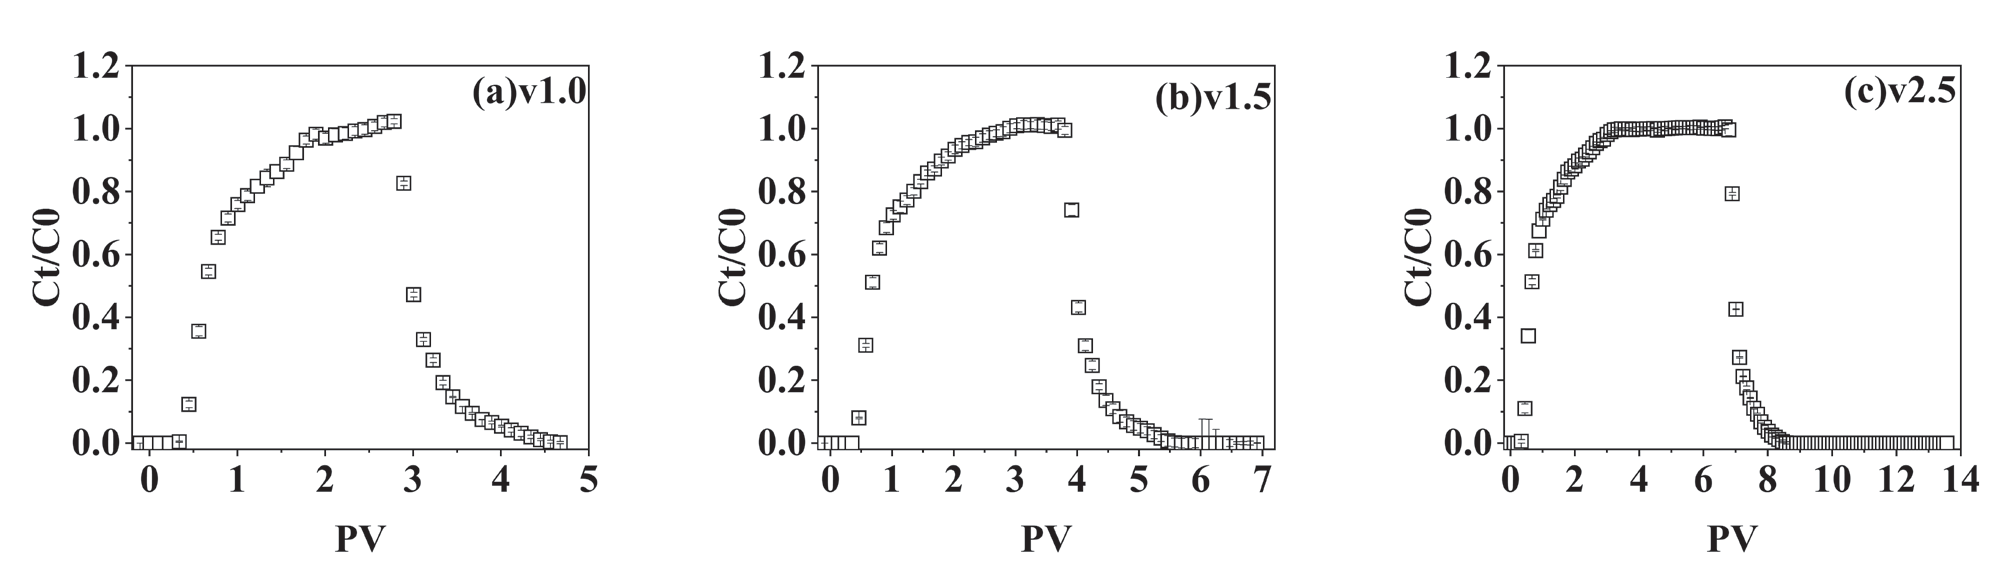
Column preparation. 1.00-1.18mm (16-18 mesh) and 0.250-0.425mm (40-60 mesh) quartz sand (Lanzhirun Water Purification Material Co., Ltd, Zhengzhou, China) were washed using diluted nitric acid. Then they were washed with pure water until neutral. The PVC column was packed with 50% (v) coarse-grained (16~18 mesh) and 50% (v) medium-grained (40~60 mesh) quartz sands, with the interface of the two kinds of sand parallel to the flow direction. The experimental column setup was shown in Fig. 1. The average porosity was 0.45. The height of the column was 12.5 cm and the inner diameter was 2.5 cm. 100-mesh nylon sieve cloth was placed at both the inlet and outlet of the column to distribute the flow and prevent the possible loss of sand. The column experiments were run in an upward mode. In all experiments, liquid velocity was regulated with a peristaltic pump (G100-1J, Langer Pump Co., Ltd., Baoding, China), and effluent was collected with an automatic fraction collector (BS-100A, Huxi Analytical Instrument Factory Co., Ltd., Shanghai, China). BTCs of the tracer of NO3- were shown in Fig. 2, in which the peak Ct/C0 of NO3- reached 1.0 and the mass recovery was greater than 99%. The chemicals used in transport were analytically pure and purchased from Nanjing Reagent Co., Nanjing, China.
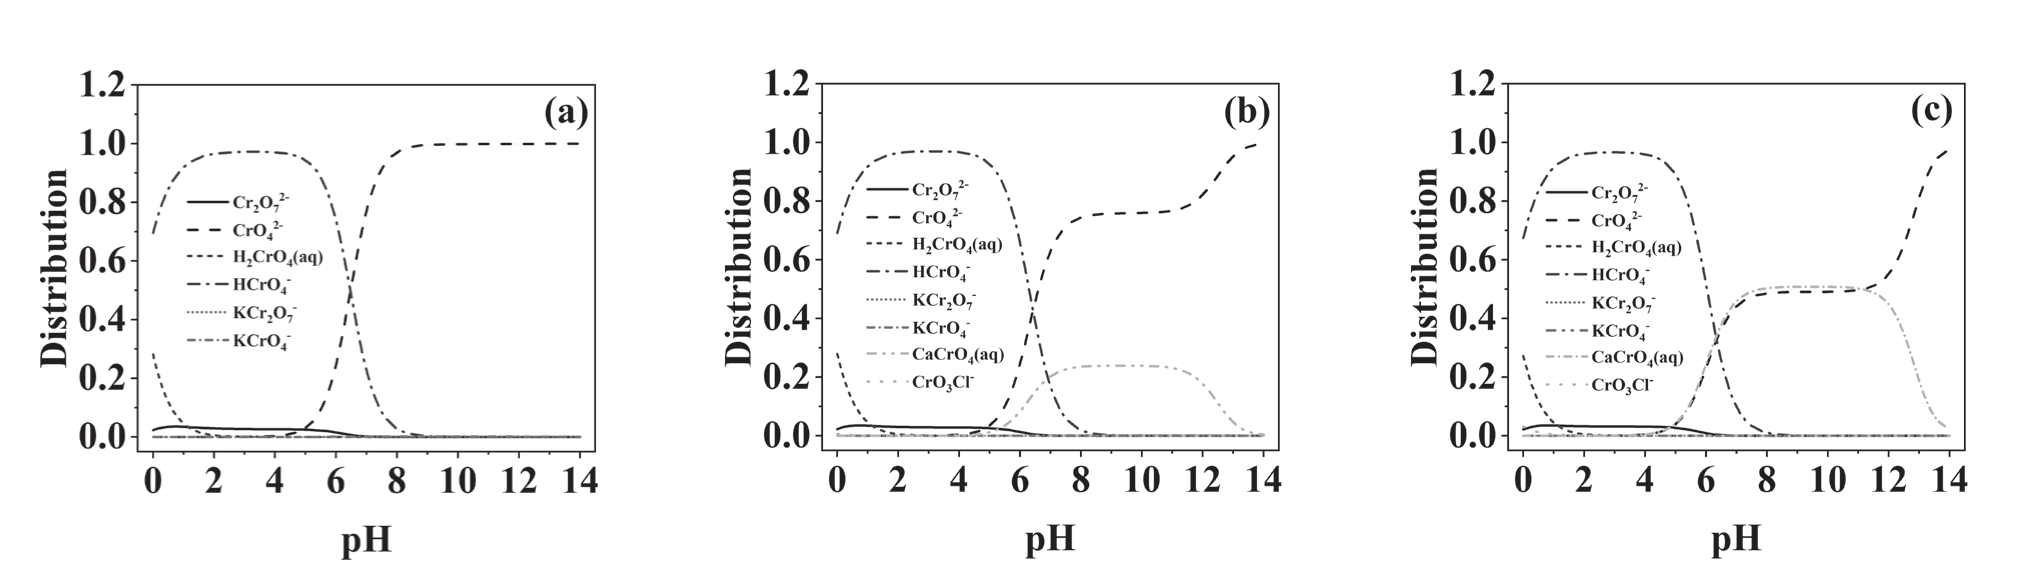
Transport experiments. The sand column was injected successively with 10 PV of background solution (for washing and stabilization) and then 3.8 PV of colloid-Cr(VI) solution, 3.8 PV of background solution, and 2.2 PV of pure water. 20 mg·L-1 Cr(VI) (prepared with K2Cr2O7 (A.R.)) was employed in all experiments. According to the stoichiometric balance calculation by using visual MINTEQ 3.1, Cr(VI) mainly existed in the form of HCrO4- and CrO42- at the experimental solution chemical conditions, whether there was an additional electrolyte of CaCl2 or not (Fig. 3). Effluent samples were collected in equal volumes of 12 mL. 4 mL of those was passed through 0.1 μm filter membranes to determine the concentration of dissolved Cr(VI) [21], and another 4 mL was digested by aqua regia to determine the total Cr(VI) concentration by using an ICP-OES instrument (PerkinElmer Optima 5300 DV, USA). The concentration of colloidal Cr(VI) was obtained by calculating the difference between total Cr(VI) and dissolved Cr(VI). The remaining samples were analyzed for the concentration of colloids in the samples by a UV-Vis spectrophotometer [15, 22-24]. Two replicates of each column were performed. The experimental breakthrough curves were fitted with the two-region model. Experimental conditions were set as flow rate (1.0, 1.5, 2.5 ml·min-1), pH (3.0 and 7.0), IS (0 and 5.0 mmol L-1CaCl2), HA (0 and 5.0 mmol·L-1), and Bc concentration (50, 100, 200 mg L-1). Bc was positively charged at pH3 and negatively charged at other pH conditions, as reported in our previous work [13]. Other colloid was used with a concentration of 100 mg L-1. During the transport process, the relative concentration (Ct/C0) of the colloids in the influent was greater than 0.94 (average 0.97-1.00), indicating the suspension was stable during the experiment.
Results and Discussion
Single Transport of Cr(VI) at Different Conditions
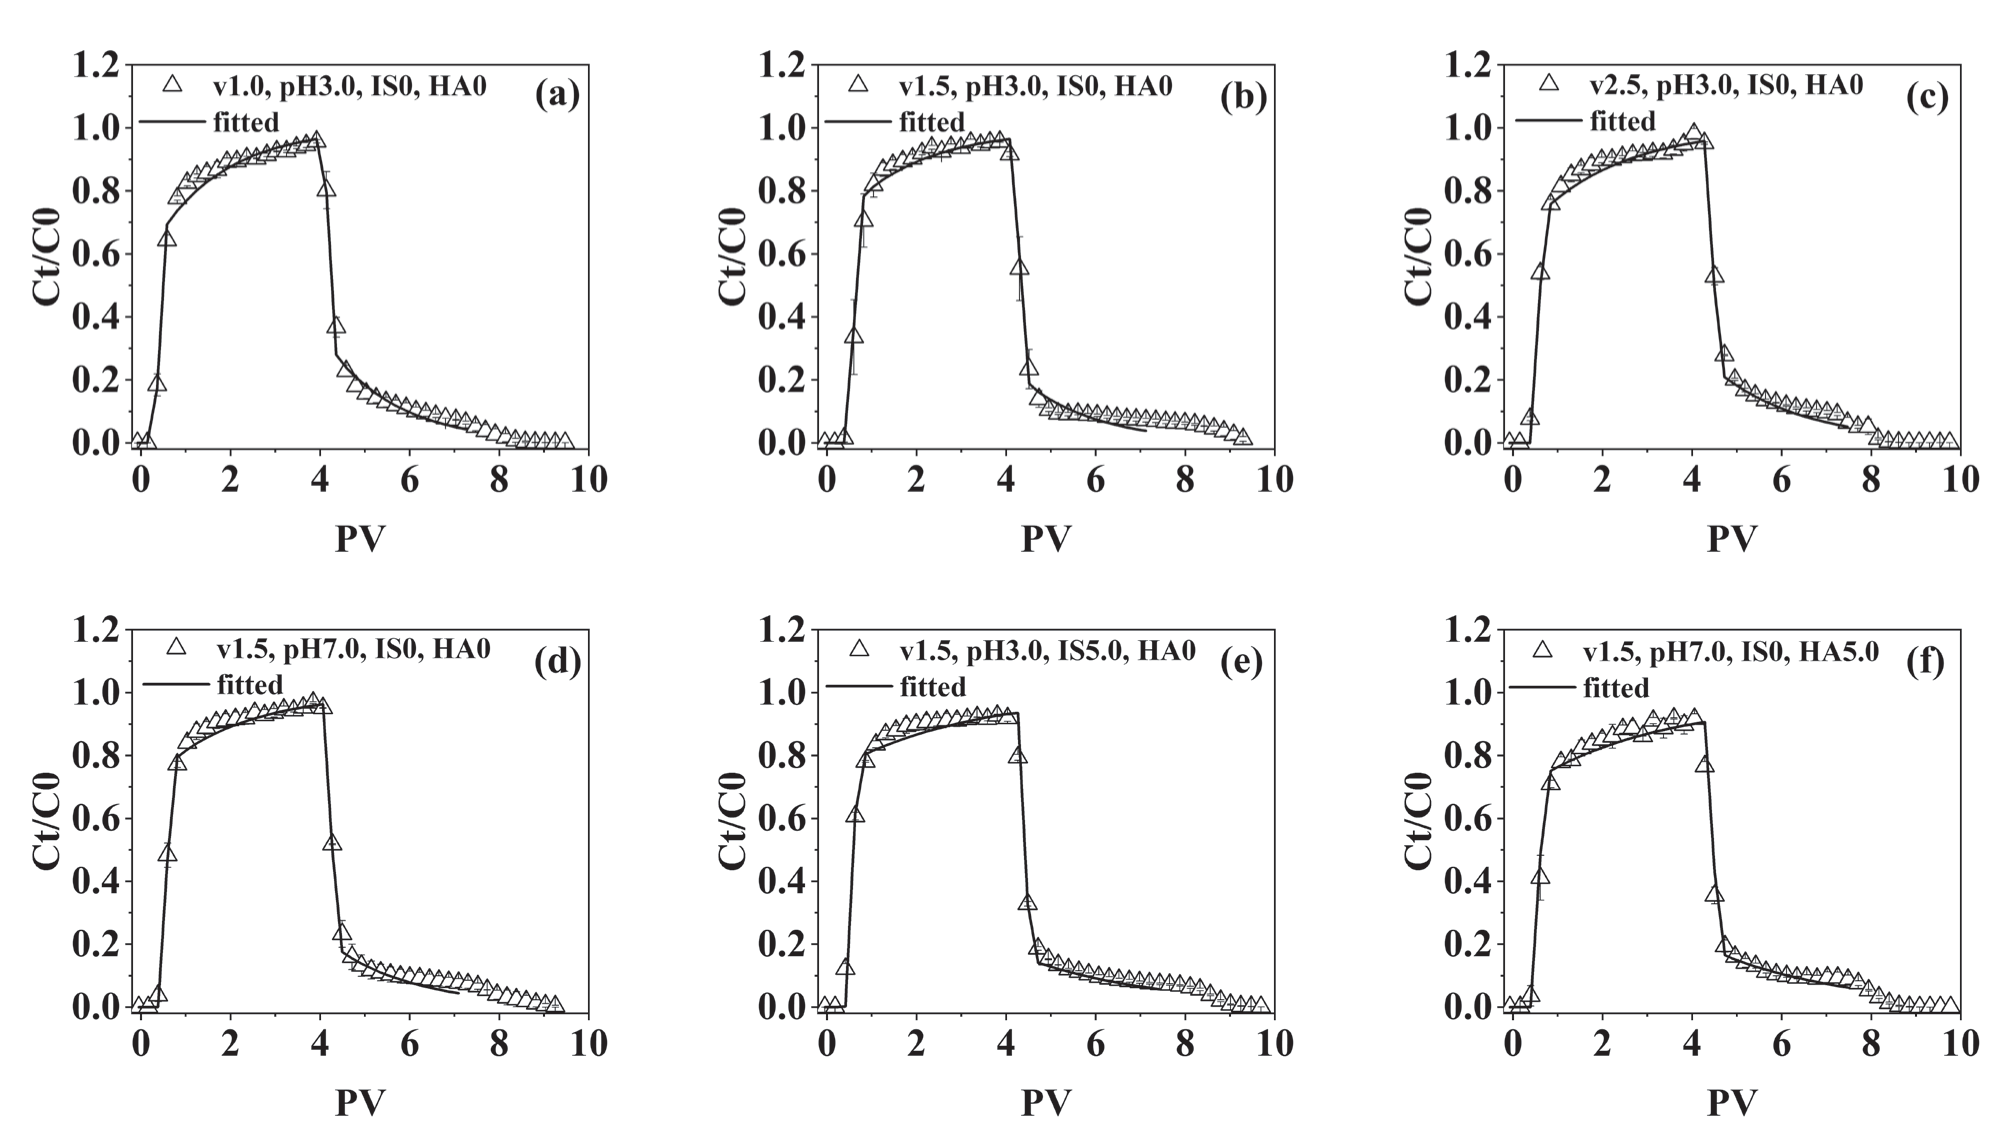
Fig. 4 shows the effect of different conditions on the transport of Cr(VI) in porous sand columns. The breakthrough curves of Cr(VI) were asymmetrical and had a clear trailing. It is probably caused by the preferential flow arising due to the heterogeneity of the heterogeneous columns [14]. As the flow rate increased from 1.0 ml·min-1 to 2.5 ml·min-1, (Fig. 4a, b, and c), the breakthrough time of Cr(VI) advanced from about 12 min to 4.8 min after beginning. The breakthrough of Cr(VI) occurred earlier. Other experimental conditions did not affect the transport velocity of Cr(VI). The change of flow rate, pH (Fig. 4b and d), and IS (Fig. 4b and e), and presence of HA (Fig. 4d and f) had little effect on the transport flux of Cr(VI). The breakthrough peaks (Ct/C0) were ~0.95. This may be due to mass transfer between two flow zones. Cr(VI) of the coarse-particle channel migrated into the medium-particle channel, then remained in the medium-particle region for a longer time [25, 26]. Mass recoveries of Cr(VI) were all nearly 1.0, indicating that very little Cr(VI) was retained in sand columns. Cr(VI) mainly existed in the form of HCrO4- and CrO4- at the experimental solution chemical conditions, (Fig. 3). Therefore, the electrostatic repulsion between Cr(VI) and quartz sand with a negative charge on the surface was dominant, or the repulsive force was far greater than the adsorption force of Cr(VI) on the medium, favoring the transport of Cr(VI) rather than its retention.
Effects of Flow Rate on Co-Transport of Cr(VI)
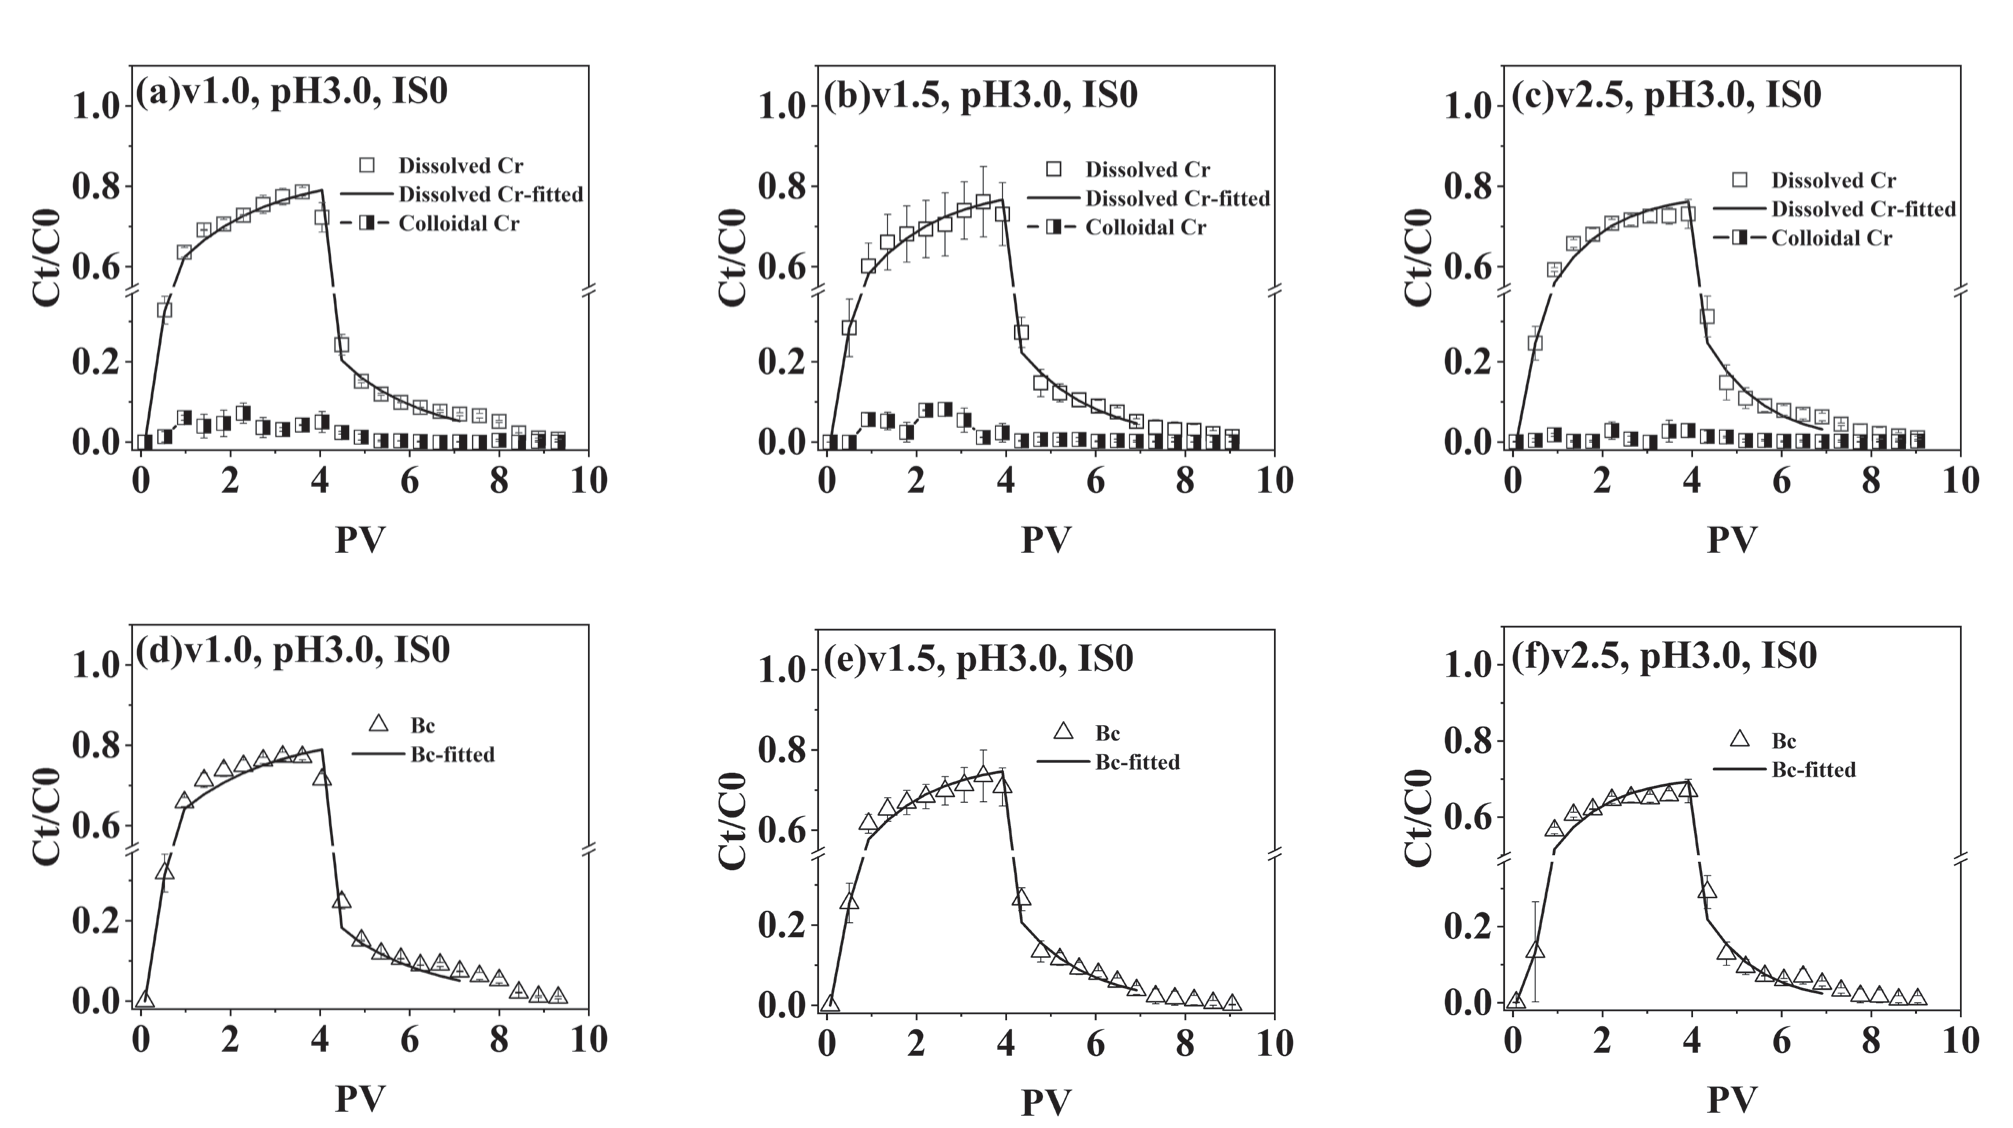
Similar to the single transport (Fig. 4a, b, and c), the breakthrough occurred all at about 0.5PV at different flow rates, corresponding to about 12 min (1.0 ml·min-1), 8 min (1.5 ml·min-1) and 4.8 min (2.5 ml·min-1) after injection (Fig. 5). The breakthrough occurred much earlier than 1PV, which was mainly attributed to the heterogeneous arrangement of the sand column. The increase in flow rate from 1.0 ml·min-1 to 2.5 ml·min-1 reduced the peak Ct/C0 of dissolved Cr(VI) in the effluent of the Bc-Cr(VI) system by 0.05, and reduced the mass recovery by ~5%. The mass recovery of colloidal Cr(VI) decreased from 4.97% to 0.27%. Although the breakthrough time advanced, the transport flux of Cr(VI) was inhibited by increasing flow rate. It may be due to the increased water agitation by accelerated flow rate, which facilitated the separation of small-size bentonite colloids from Bc [27]. Moreover, the adsorption of Cr(VI) was supposed to be stronger by smaller colloids. According to the size exclusion effect [28], the small-size bentonite colloids carrying Cr(VI) circulated in the pores of quartz sand and interacted with sand particles. This would facilitate Cr(VI)-Bc deposition. Colloidal-bound Cr(VI) in the effluent was also reduced. But this effect may depend on the property of the column media. For example, Ghiasi et al. [12] found increased transport of Cr(VI) with increasing flow rate in the presence of bentonite colloids via column experiments with sand of three sizes. Furthermore, Cr(VI) transported almost simultaneously with Bc. Compared with the single transport of Cr(VI), the presence of Bc obviously enhanced the deposition of Cr(VI). The transport of Cr(VI) in the media was always dominated by the dissolved Cr(VI).
Effects of pH, IS or HA on Co-Transport of Cr(VI)
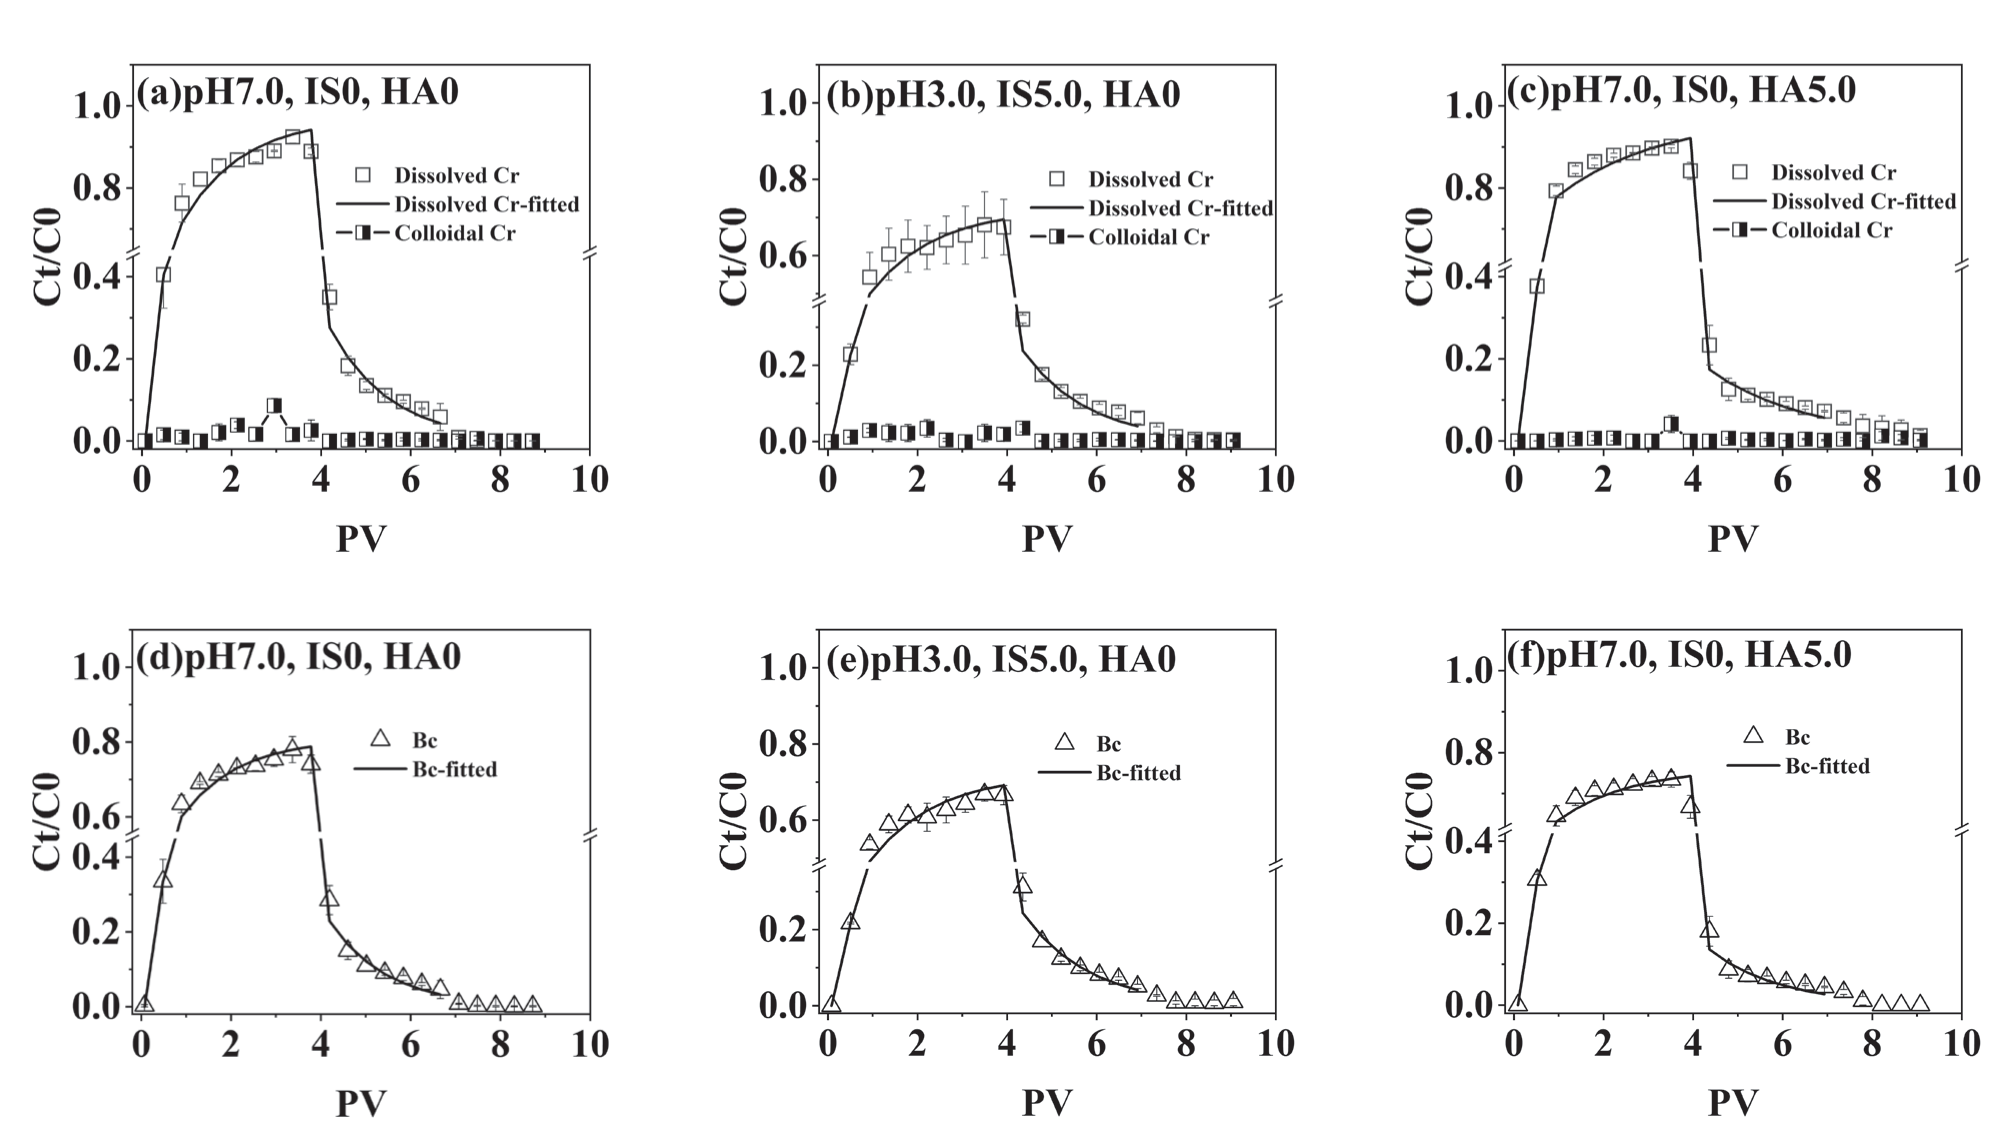
Cr(VI) started to break through all columns at about 0.5PV (the 8th min) at different pHs. As with Bc transport, an acidic environment inhibited the transport of dissolved Cr(VI) (Fig. 5b, e, and Fig. 6a, d). Although in the single transport pH almost had little effect (Fig. 4b, d), the shift towards alkalinity increased the maximum Ct/C0 of dissolved Cr(VI) in the Bc-Cr(VI) system from 0.76 to 0.92 and the mass recovery from 80.4% to 97.8% in co-transport. It may be because the colloidal particles tended to have more negative surface charges with the increase of pH from 3.0 to 7.0. Thus the electrostatic repulsion among Cr(VI), Bc, and the quartz sand became dominant. It favored the transport of dissolved Cr(VI) and Bc in co-transport. Therefore, if the opposite process occurred and pH decreased from pH 7.0 to pH 3.0, they tended to accumulate and settle on the sand surface as the surface charge of Bc became less negative or even positive. A similar result reported by Ma et al. [29] was that pH elevation promoted the transport of As(V) and colloids. The increasing alkalinity also decreased colloidal Cr(VI) in the effluent by 2.93%, which may be a result of the obvious increase of dissolved Cr(VI).
The changes in IS did not affect the breakthrough time of Cr(VI). Cr(VI) moved simultaneously with Bc (Fig. 5b, e, and Fig. 6b, e). When IS increased to 5 mmol·L-1, the maximum Ct/C0 of dissolved Cr(VI) in the Bc-Cr(VI) system decreased by 0.08. The amount of colloidal Cr(VI) in the effluent of the Bc-Cr(VI) system decreased by 2.43%. Therefore, the transport of dissolved Cr(VI) and colloidal Cr(VI) in media was inhibited by the increasing IS levels. The BTCs of Bc also showed that the transport of Bc was obviously inhibited by high IS, which might be due to the compressed colloidal bilayer with elevated IS [30]. Thus, the stability and mobility of Bc/Cr(VI) in solution were decreased, and the hindrance of sand pores on them was enhanced. Therefore, pH and IS change didn’t affect the single transport of Cr(VI) but affected Bc-Cr(VI) co-transport obviously.
Bc transport decreased obviously after the addition of HA (Fig. 6d, f). However, HA didn’t affect dissolved Cr(VI) transport in both single transport (Fig. 4d, f) and co-transport (Fig. 6a, c). This may be due to the relatively higher pH (7.0), which was employed in the experiment to ensure the dissolution of HA in the influent. The pH value didn’t favor the adsorption of Cr(VI). Reduction of Cr(VI) may also be limited at the conditions of transport (i.e. pH, HA concentration, and contact time), which may require much lower pH, a much higher concentration of HA, and a much longer contact time. It has been reported that when the pH value of the solution increased from 2 to 7, the apparent reduction rate coefficient decreased by three orders of magnitude [31]; the adsorption of Cr(VI) decreased from about 90% to about 10% [32].
Effects of Bc Concentration and Other Colloids on Transport of Cr(VI)
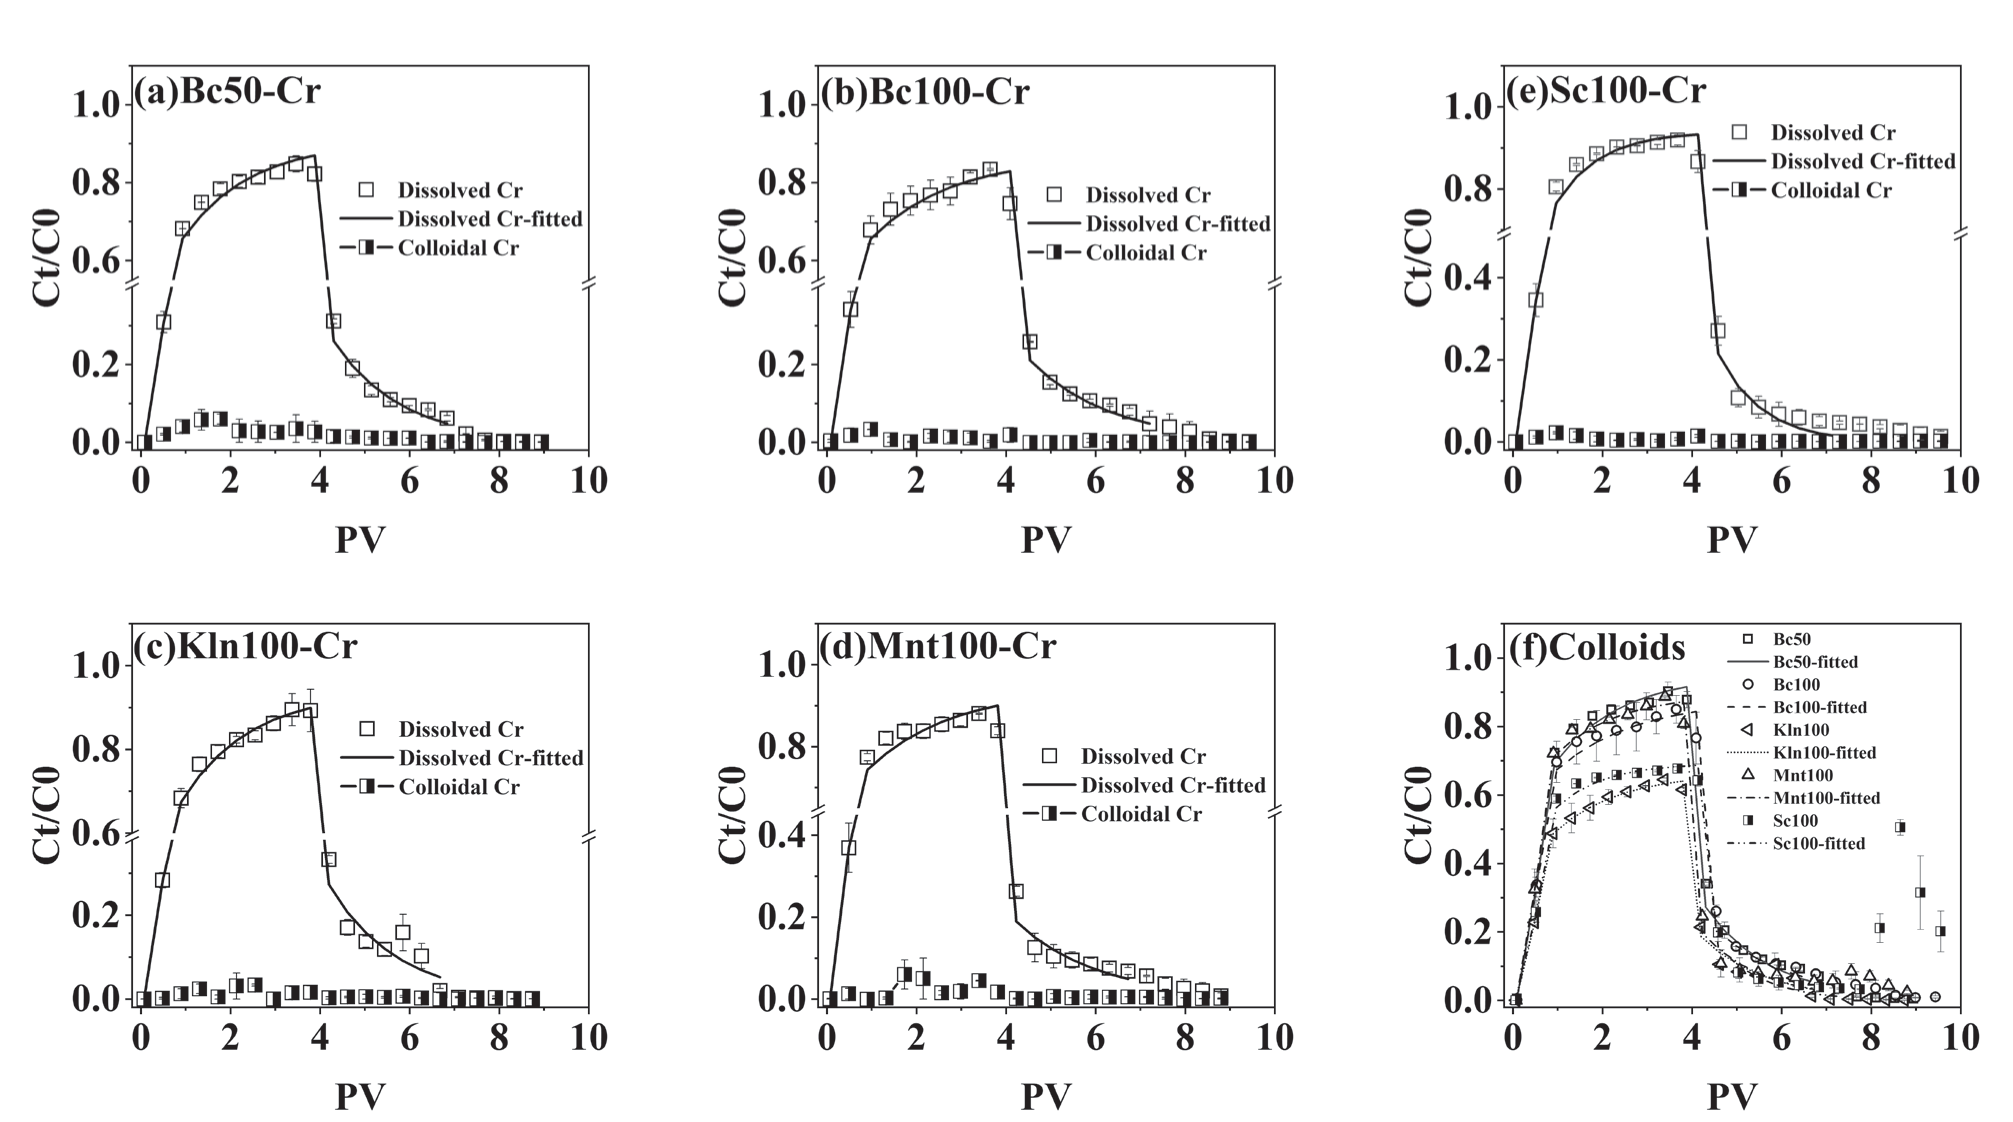
The breakthrough time of Cr(VI) was not affected by various colloid concentrations (Fig. 5b and Fig. 7a, b). When the concentrations of Bc in the influent increased from 50 mg·L-1 to 200 mg·L-1, the mass recovery of dissolved Cr(VI) in the effluent decreased by nearly 10% (Fig. 5b and Fig. 7a), suggesting that the increasing Bc concentration inhibited the transport of dissolved Cr(VI). The mass recovery of the colloidal Cr(VI) was ~4.43%. It is supposed that the stability of the system was weakened when Bc concentration increased, which was more likely to cause Bc and Cr(VI) sedimentation. Although Ct of Bc increased in the effluent, Ct/C0 decreased due to much larger C0 in the influent with higher colloid concentration. The higher the colloid concentration in the influent, the higher the effective collision efficiency between colloids and media. Therefore, more colloidal particles were likely to be adsorbed and deposited on the surface of the sand media [33]. Small colloids could also block pores due to multi-particle bridging [34], hindering subsequent colloidal transport. Co-transport with different colloids showed the same breakthrough time for Cr(VI) (Fig. 7c, d, e). Kln and Mnt hindered the transport of dissolved Cr(VI) slightly. The mass recovery of dissolved Cr(VI) was 92.8% (Kln) and 95.4% (Mnt) respectively, which was higher than that in 100 mg·L-1 Bc treatment (less than 90%). Sc almost had little effect on the transport of dissolved Cr(VI). Therefore, the decrease of dissolved Cr(VI) in the effluent in Bc treatment was the most significant, and the application of bentonite colloids may alleviate the transport risk of Cr(VI) to ground water.
Table 1.
Model fitting parameters of dissolved Cr in Cr(VI) single transport and Cr(VI)-colloid co-transport with two-region model (TRM) by using STANMOD 2.0.*
Model Fitting of the Co-Transport
The model fitting parameters using TRM are listed in Table 1. TRM describes the BTCs of Cr(VI) and colloids well (R2>0.95). Retardation factor (Rd) varied with hydrodynamic and hydrochemical conditions. Its trends were generally consistent with the experimental results. Desorption force existed in the co-transport of Cr(VI) and colloids (Rd <1), especially in the Sc-Cr(VI) system, leading to the re-release of Sc-Cr(VI) in the rinsing of pure water later in the transport experiment (Fig. 7f). The first order retention coefficients α was related to the adsorption and desorption of particles on the sand surface [35]. The values of α were very small (<0.025), with no obvious variation. The first order retention coefficients of colloids and Cr(VI) in the heterogeneous sand medium were small, indicating low adsorption rates of colloids and Cr(VI) in the sand column. However, the variation of Kd did not always exactly match the trend of the observed results. Under some conditions, negative adsorption occurred according to Kd value (<0), probably due to the reduction in flow cross-sectional area caused by the existence of immobile water zones. Adsorption itself could not well explain the cotransport of Cr(VI) and colloids. In addition to adsorption, there might be other mechanisms to control their transport, such as strain effect [36-38].
Conclusions
Cr(VI)-colloid co-transport in heterogeneous sand column impacted by flow rate, pH, IS, HA, Bc concentration, and other colloids was investigated. Similar to single transport of Cr(VI), breakthrough occurred at about 0.5PV injection of Cr(VI)-colloid in co-transport, which was mainly attributed to the heterogeneous arrangement of the sand column. The increasing flow rate advanced the breakthrough time of Cr(VI)-colloid, while pH, IS, HA, and Bc concentration almost didn’t affect the breakthrough time of Cr(VI)-colloid. During the co-transport of Bc-Cr(VI), the transport capacity of dissolved Cr(VI) was positively related to pH and negatively related to flow rate, IS, and Bc concentration. Compared with Cr(VI) single transport, the presence of Bc inhibited Cr(VI) transport capacity under all selected conditions in this study. Kln and Mnt slightly inhibited Cr(VI) transport, while Sc almost had no effect on Cr(VI) transport under acid conditions. There were three destinations of Cr(VI): (a) flowing out of the sand column with the water as dissolved Cr(VI), (b) flowing out of the column with colloids as colloidal Cr(VI), and (c) remaining in the sand column with colloids. The first destination of dissolved Cr(VI) was the most dominant. Besides adsorption, there might be other mechanisms for the interaction between media and colloid-Cr(VI). Application of mineral colloids such as bentonite colloids may alleviate the transport risk of Cr(VI) to ground water.