

Introduction
Soil aggregate influences soil quality directly or indirectly by mediating physicochemical properties and biochemical processes [1, 2], which also affects the direction and intensity of soil organic carbon (SOC) transformation [3, 4] because of the protection of soil aggregate by organic matter [5]. Additionally, abundant organic matter is beneficial for aggregate formation [6]. In total, the size and composition of soil aggregate directly affect the soil structure and SOC content [7, 8], and well-aggregated soil could increase SOC by long-term C sequestration in soil [9].
Soil aggregate is a combination of organic matter and mineral particles, which is divided by their diameter into macro-aggregate (>0.25 mm) and micro-aggregates (<0.25 mm) according to their average diameter [8, 10, 11], and the percentage of macro-aggregate can be considered a promising indicator of soil structure [8, 10, 12]. The distribution of SOC also varies within different aggregate sizes [12]. Cao et al. [13] suggested that SOC sequestration in soil aggregate contributed to the formation of large particles, whereas Wang et al. [14] found that the changes in SOC stocks were primarily reflected in the < 0.25 mm fraction, which was an important indicator of SOC dynamics. Liu et al. [15] suggested that SOC accumulation of fresh organic matter generally occurred in macro-aggregate, while degraded organic matter was sequestered in micro-aggregate after degradation by microorganisms. Therefore, to improve soil structure and soil quality, it is essential to investigate the soil aggregate and aggregate-associated organic carbon dynamics.
With the rapid development of urbanization and industrialization, the land use structure is constantly changing. Different land use practices lead to differences in soil properties due to differences in vegetation types, management practices, and planting years [16, 17]. Moreover, soil aggregate stability also changes with different cropping years [13]. For example, Ma et al. [18] found that the contents of soil aggregate and organic carbon in natural grassland were significantly higher than those in planted woodland and cropland on the Loess Plateau. Liu et al. [15] reported that soil aggregate stability was higher in paddy fields and woodlands, and soil organic matter was better maintained. In addition, Duan et al. [19] concluded that soil aggregate and SOC physical fractions were affected by altering the bacterial and fungal community composition in C cycling following long-term fertilization. In total, land use type and related management measures are the most important factors affecting soil aggregate and aggregate-associated SOC [20].
Meta-analysis is an effective method for synthetically analyzing the results of independent studies based on data from published journals [21]. Previous meta-analyses have revealed the effects of no‐tillage [22], atmospheric nitrogen deposition [8], and biochar application [10] on soil aggregate and carbon fixation efficiency. Clearly, a quantitative overview and understanding of soil aggregate and aggregate-associated SOC to land use change is still lacking to date.
Here, we conducted an overall meta-analysis based on published articles to assess the response of soil macroaggregate and aggregate-associated SOC to different land use changes and related limiting factors. Our aims were to determine 1) the response of soil macro-aggregate content to different land use types and conversions, 2) the key factor affecting soil macro-aggregate and aggregate-associated SOC, and 3) the relationship of soil macroaggregate and aggregate-associated SOC under different land use changes. We hypothesized that soil aggregate and SOC were intensively influenced by different land use types and conversions and that the associated SOC was positively related to the soil macro-aggregate content.
Table 1.
Location, climatic conditions, and soil properties among all study sites
Material and Methods
Data Collection
Articles that reported aggregate composition and stability of different land use and conversion patterns were incorporated into comprehensive document retrieval by searching the ‘Web of Science’ and ‘China National Knowledge Infrastructure’. A combination of keywords (‘land use’ and ‘soil aggregate’) was used to refine the search of qualified studies published prior to January 2022. The studies need to meet the following criteria: 1) Primary land use and land use change on primary land were clearly described, 2) Studies needed to report the content of macro-aggregate (R > 0.25 mm) or could be calculated by data, which could be divided into mechanical-stable macro-aggregate (MSA0.25) or water-stable macro-aggregate (WSA0.25) by different sieving methods, 3) To test the dynamics of soil aggregate stability along a chronosequence of land use conversion, soil samples were collected from different years and had at least two pairs of data, or the studies were carried out in situ observation using the ‘space for time’ approach, 4) The means, standard deviations (SD)/errors (SE), and sample sizes (n) could be extracted directly from tables, graphs, or contexts; SD was calculated as SD = SE ×
Land use types were grouped as wasteland (Wes.), forest (For.), grassland (Gra.), farmland (Far., such as maize, corn, and rice), vegetable (Veg.), and garden (Gar.), which were classified as ecological land (For. and Gra.), agricultural land (Far., Veg. and Gar.), and wasteland (Was.). A summary of abbreviations for different land uses is shown in Table 2. According to different primary and changed land use types, six types of land use change were defined: returning forest to agricultural land (Agr.-For.), returning farmland to grassland (Agr.-Gra.), agricultural land changed from primary ecological land (Eco.-Agr.), primary wasteland was converted to ecological land (Wes.-Eco.), primary wasteland was converted to agricultural land (Wes.-Agr.), changed agricultural land among farmland, vegetable, and garden (Cha. Agr.). Moreover, soil depth was grouped into upper (0–20 cm), middle (20–40 cm), and bottom layers (>40 cm). When data was reported over multiple years, we differentiated the treatment effects in terms of different times as short-term (observations in the first year), medium-term, and long-term (observations in the last year).
Meta-Analysis
To evaluate the responses of MSA0.25, WSA0.25, and SOC to land use conversion, the effect sizes were estimated by the natural log-transformed response ratio (lnR) using the mean value of the treatment compared to that in the control groups:
lnR = ln (xt/xc) where xt and xc are the values of the means in the treatment and control groups, respectively.
We calculated the variance (v) as follows:
where nt and nc are the sample sizes and st and sc represent the standard deviations of the treatment and control groups, respectively.
The percentage change (%) in the response of soil aggregate to soil use conversion was calculated by:
Percentage change (%) = (exp(lnR)-1) ×100%
The meta-analysis was analyzed by MetaWin 2.1. The mean response ratio (RR++) of individual paired observations between the control and treatment groups was calculated using the categorical mixed-effect model. The effect sizes and 95% bootstrapped confidence interval (CI) were calculated simultaneously, and treatment effects were considered insignificant when the 95% CI overlapped with zero. To analyze the differences between subgrouping categories, intergroup heterogeneity (Qb) was calculated for all data.
Statistical Analysis
A one-way ANOVA was performed to test the differences in all target variables between the treatment and control groups (Table S1). Random forest was used to examine the correlations of lnR of MSA0.25, WSA0.25, and SOC, with the potential driving factors (soil properties) by the ‘RandomForest’ package in R version 4.0.2 (R Core Team, 2020). The relationship between macro-aggregate and aggregate-associated SOC was analyzed using linear regression analysis. All statistical analyses were carried out using SPSS 22 (SPSS Inc., Chicago, USA).
Results and Discussion
Overall Impact
The frequency distribution of overall effect sizes across all studies tended to have a normal distribution (Fig. 1a, b, c), and significant positive linear relationships between treatment and control were observed for MSA0.25, WSA0.25, and SOC, with a strength of R2 = 0.55, 0.67, 0.47, respectively (Fig. 1d, e, f). When averaged across all studies, land-use changes strongly increased MSA0.25, WSA0.25, and SOC by 8.4%, 7.6%, and 18.0% across 124, 204, and 174 comparisons, respectively (Fig. 1a, b, c). In addition, between-group variability tests among observations suggested that soil aggregate and SOC responses to land-use changes depended on soil depth, land-use type, and land-use conversion (Table 3).
Table 2.
Summary of abbreviations of different land uses
Fig. 1.
Frequency distribution of response ratio (lnR), the relationship between individual observations in treatment against those in control, overall effect (c) for soil aggregate. The mean, SD and n indicate the mean value, standard deviation and number in the figure; the dotted line represents the theoretical 1:1 line, whereas the solid line represents the linear regression for all individual observations in the figure.
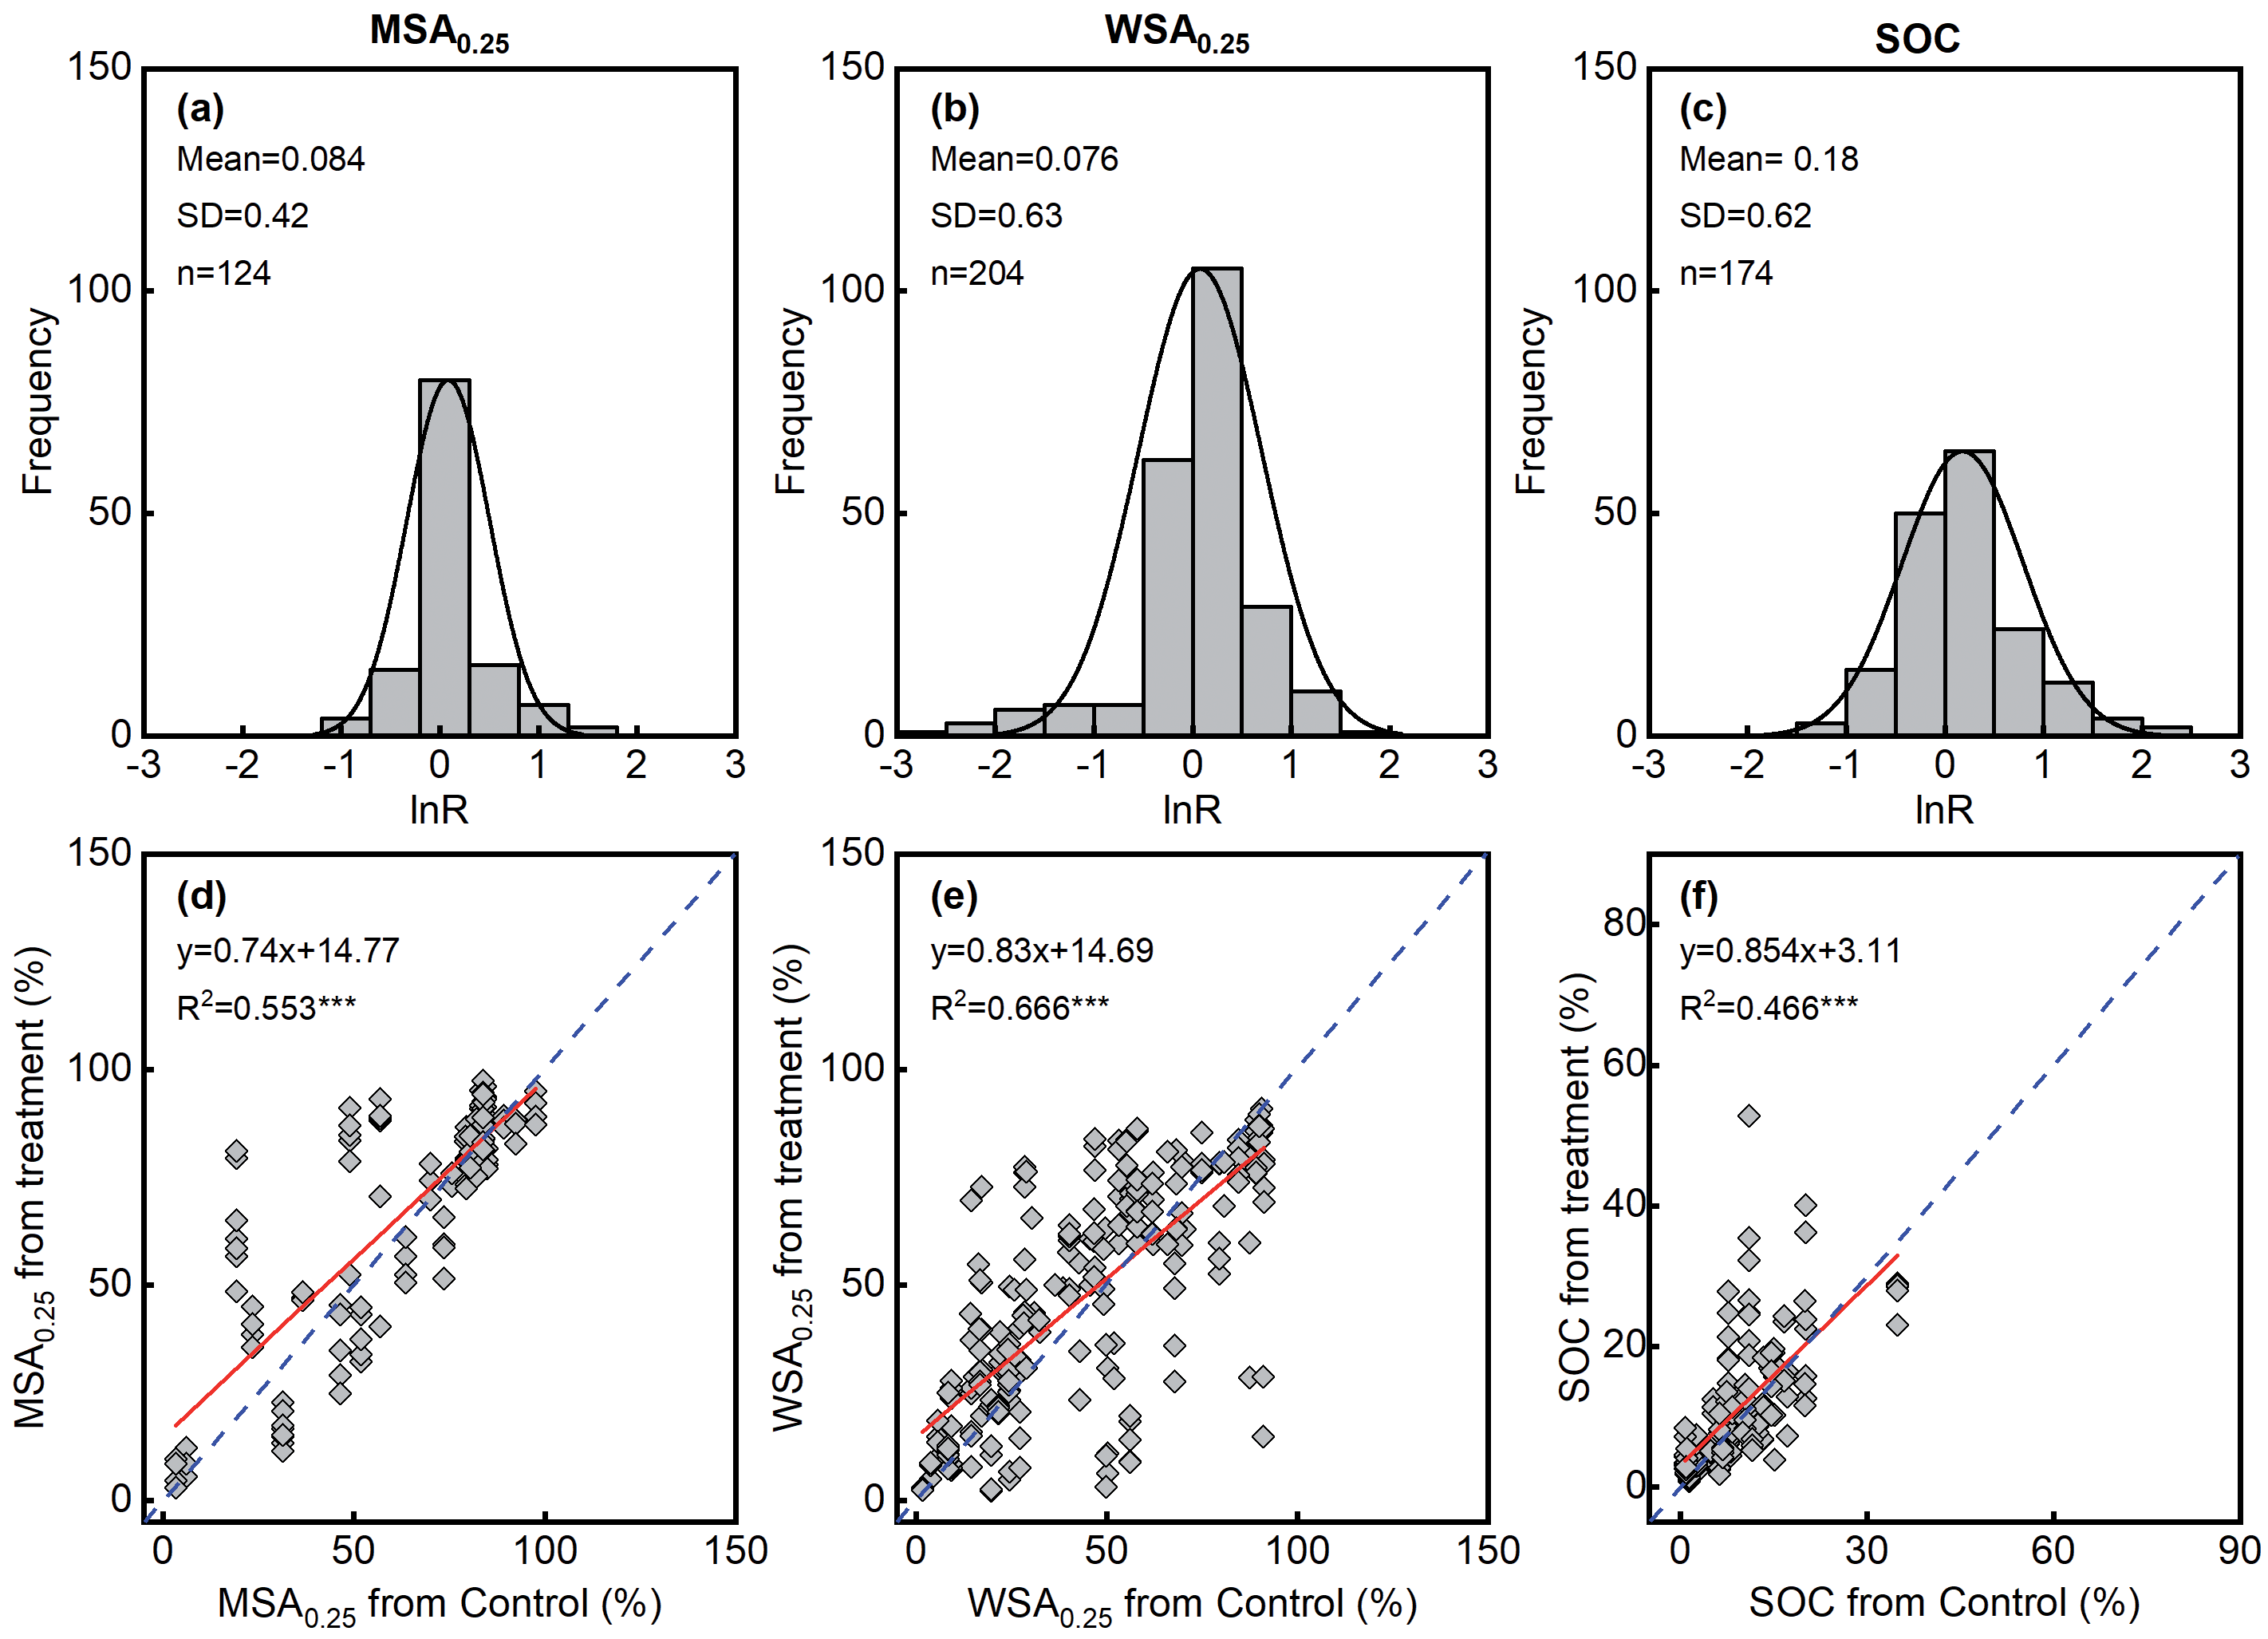
Table 3.
Between-group variability tests (Qb) among observations (n) suggesting their potential as predictive variables influencing the responses of MSA0.25, WSA0.25 and SOC.
Impacts of Land-Use Change on Soil Aggregate
As shown in Fig. 2, the effect of land use on MSA0.25 and WSA0.25 was obvious in the upper layer, but not in the middle layer and bottom layer. Compared to the primary land-use type, land-use changes increased by 12.5% in MSA0.25 and 9.8% in WSA0.25 within a depth of 0–20 cm and were slightly reduced in the middle level by 1.4% and 3.7%, respectively.
The different land use types and conversions were significantly correlated with the response ratios of the soil macro-aggregate content across all the studies. For mechanical-stable macro-aggregate (MSA0.25), MSA0.25 increased by 46.9% and 7.3% in grassland and farmland, primary wasteland was converted to agricultural land, and returning farmland to grassland increased MSA0.25 by 47.1% and 16.0% (Fig. 2a), while it decreased by 11.1% and 11.7% in forest and vegetable, respectively. For the water-stable macro-aggregate (WSA0.25), the response ratios for vegetable field, forest land, and grassland were generally positive, with increased ratios of 81.0%, 63.8%, and 37.9%, respectively, while the WSA0.25 decreased by 19.7% and 10.6% in farmland and garden. Moreover, returning farmland to forest or grassland and primary wasteland converted to ecological land increased WSA0.25 by 58.1%, 40.2%, and 31.5%, respectively, while it decreased by 31.5% for cultivation. There was no significant influence on primary wasteland converted to agricultural land and changed agricultural land (Fig. 2a, Fig. 3).
Fig. 2.
Changes in soil macro-aggregate under land use change as affected by soil depth, land use type, land use conversion, and time interval. The numbers on the right represent the sample size. MSA0.25, mechanically stable macro-aggregate; WSA0.25, water-stable macroaggregate; For., forest; Gra., grassland; Far., farmland; Veg., vegetable; Gar., garden; Agr., agricultural land; Wes., westland; Eco., ecological land. The same below.
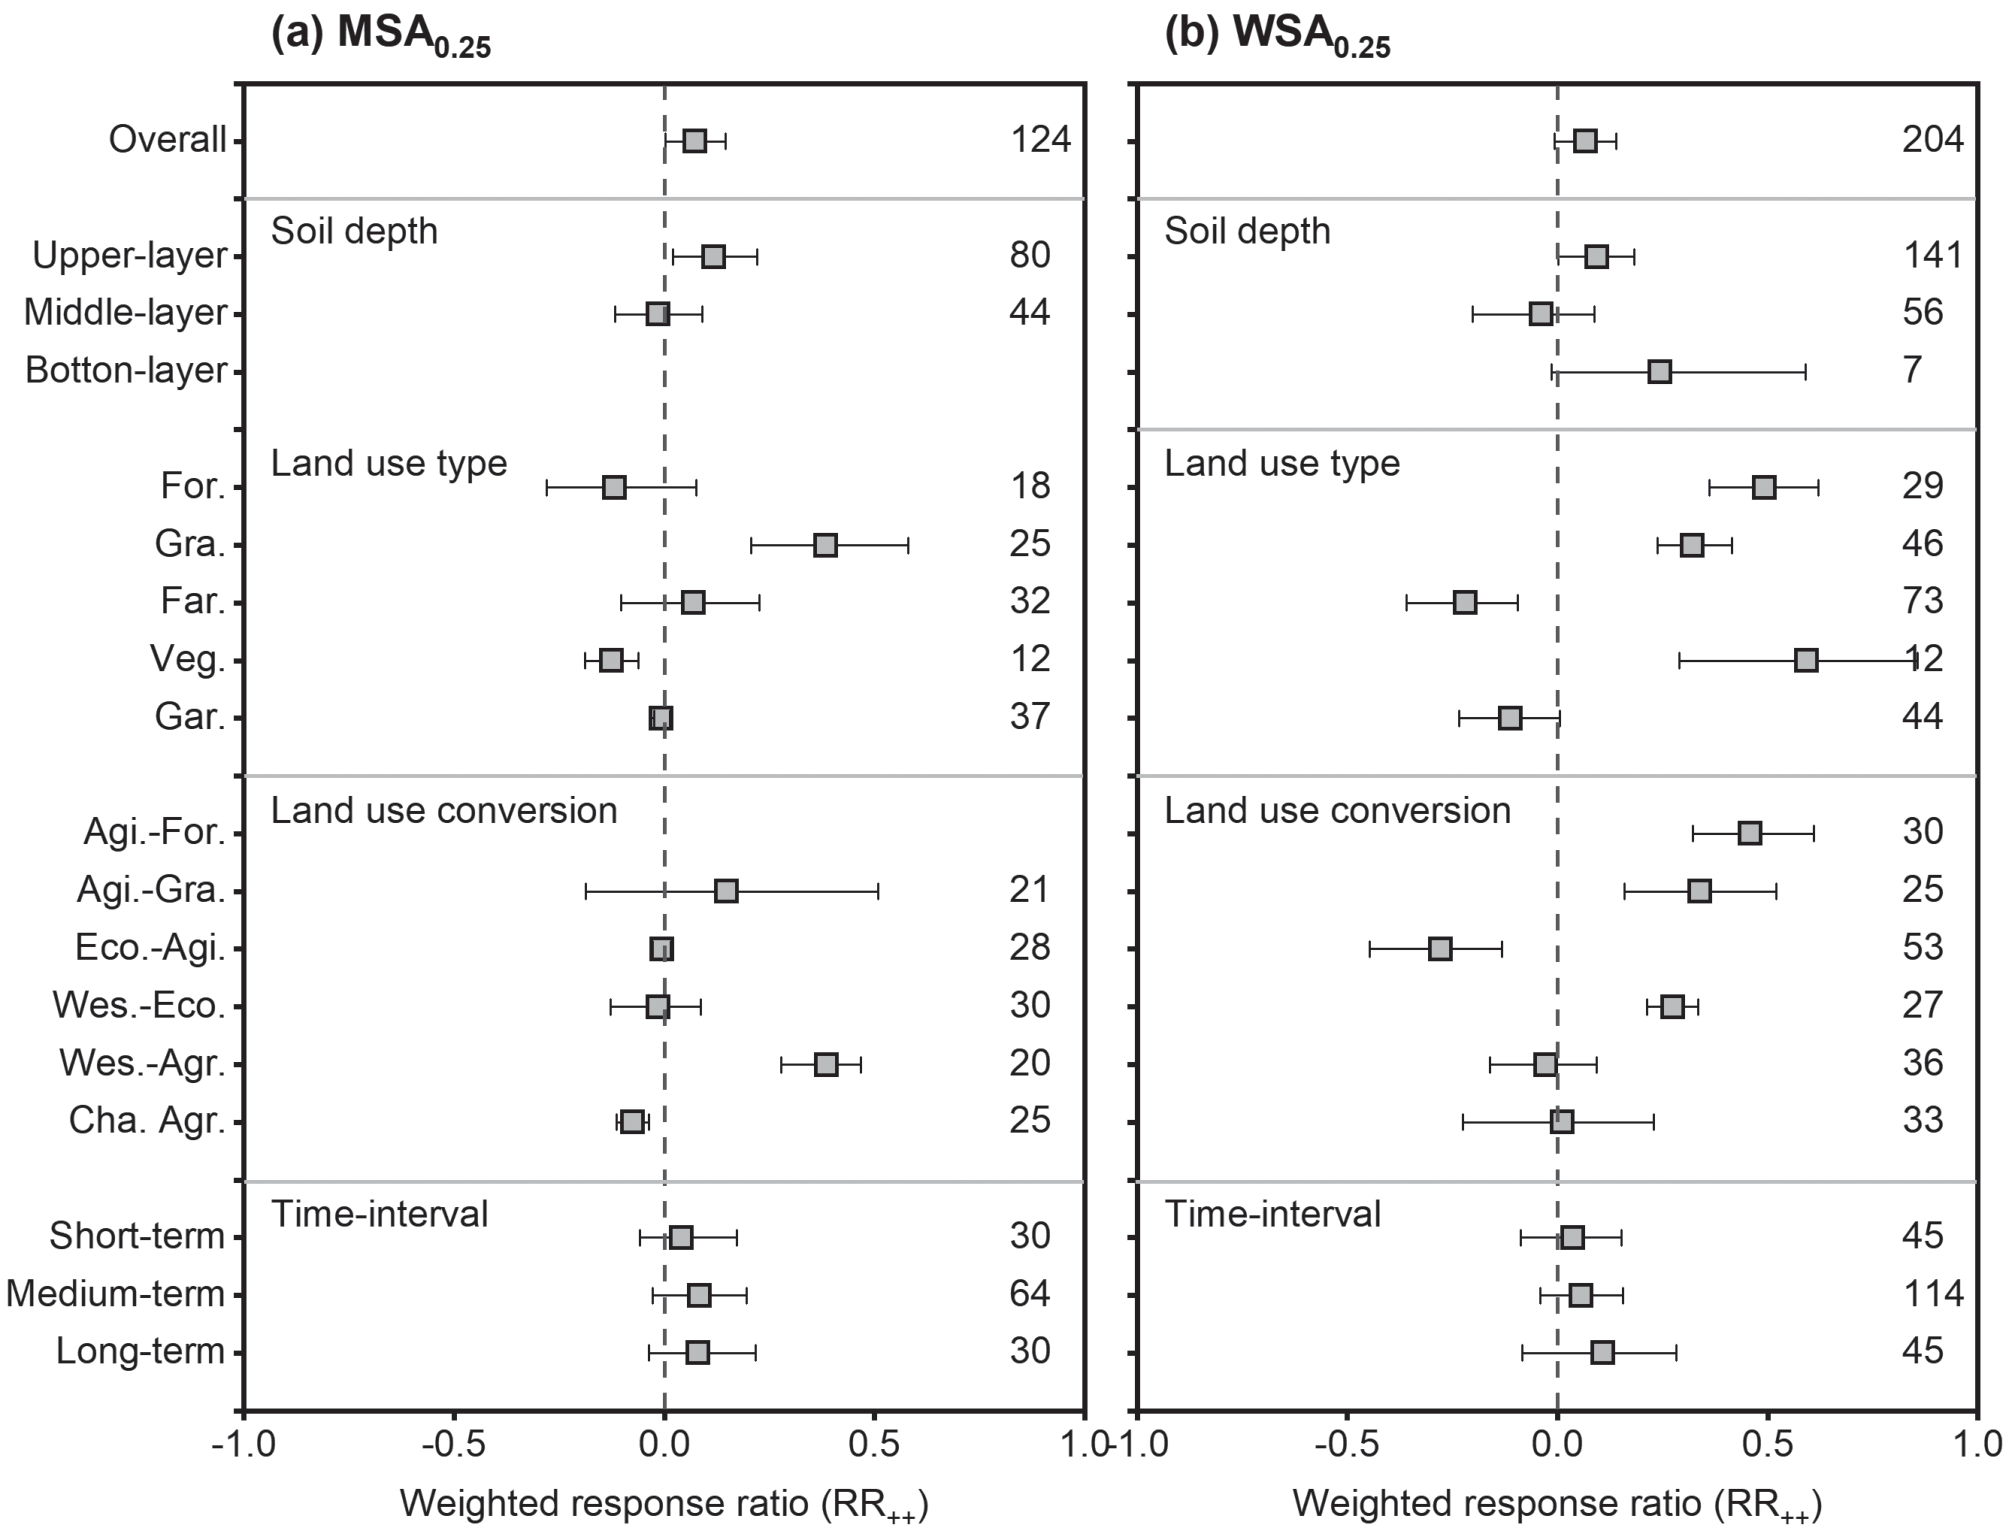
Additionally, the period of time following land conversion could influence the soil macro-aggregate content (Fig. 2). According to our meta-analysis, which significantly increased by 4.1%, 8.7%, and 8.4% in the early, medium, and long duration of experiments for MSA0.25, and 3.7%, 5.8%, and 11.4% for WSA0.25.
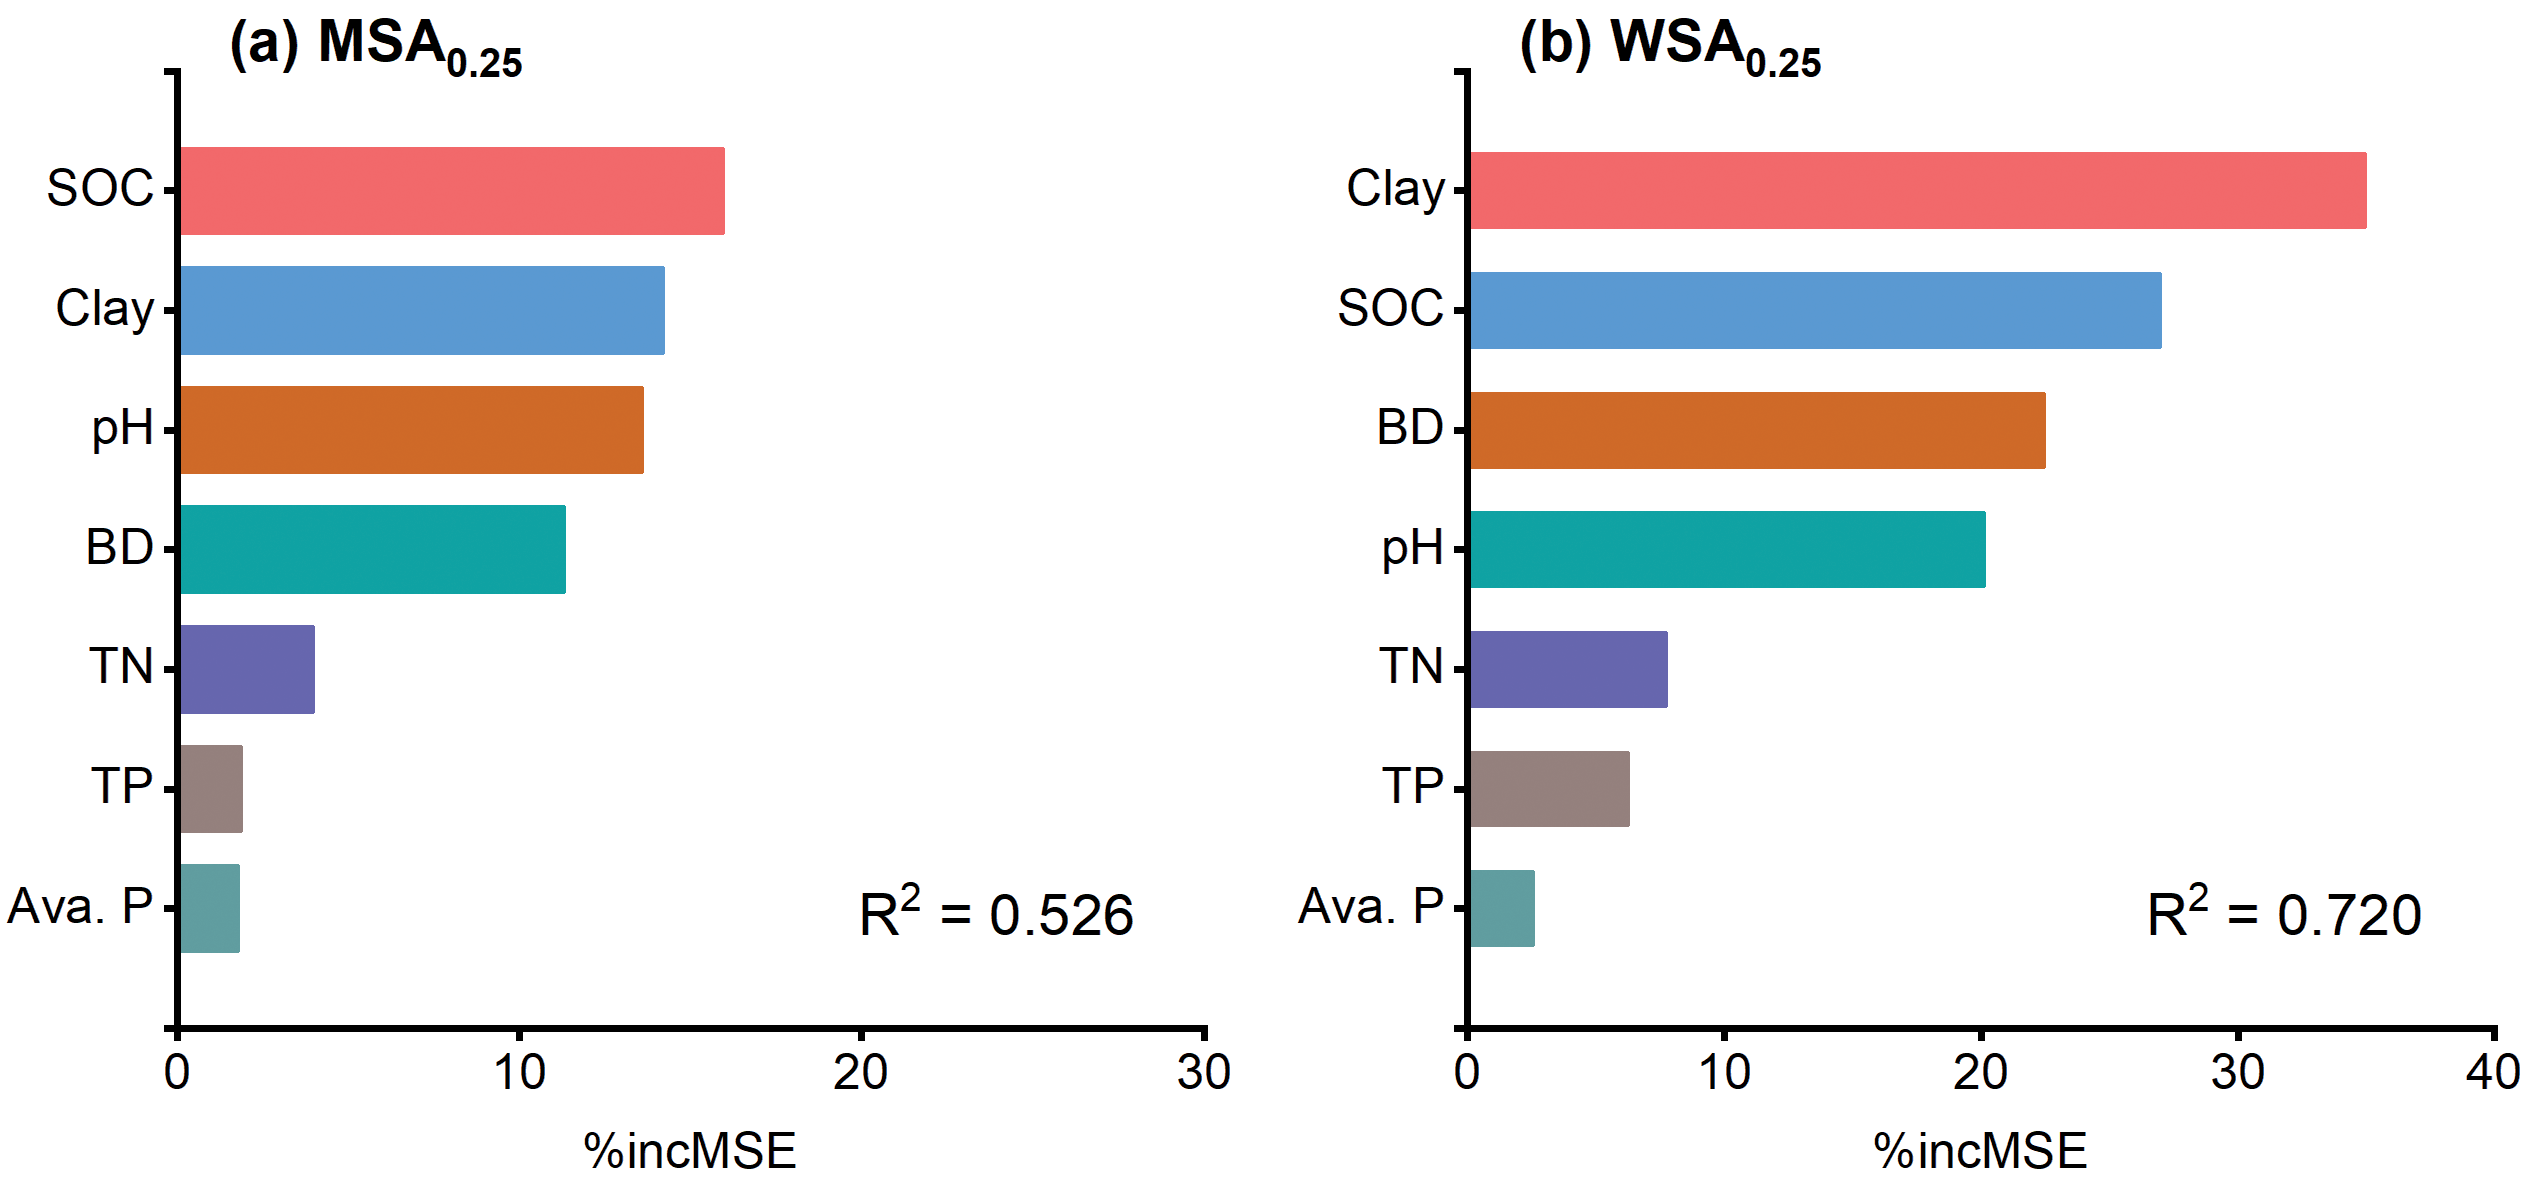
The relative importance of soil properties that influence soil aggregate structure was determined by a random forest model (Fig. 4). The relative importance of soil properties in the MSA0.25 model (R2 = 0.526, p < 0.001) was as follows: SOC > clay > pH > BD (Fig. 3a). Similarly, WSA0.25 was greatly affected by soil properties (R2 = 0.720, p < 0.001), and the relative importance was as follows: clay > SOC > BD >pH (Fig. 4).
Impacts of Land-Use Change on Soil Organic Carbon
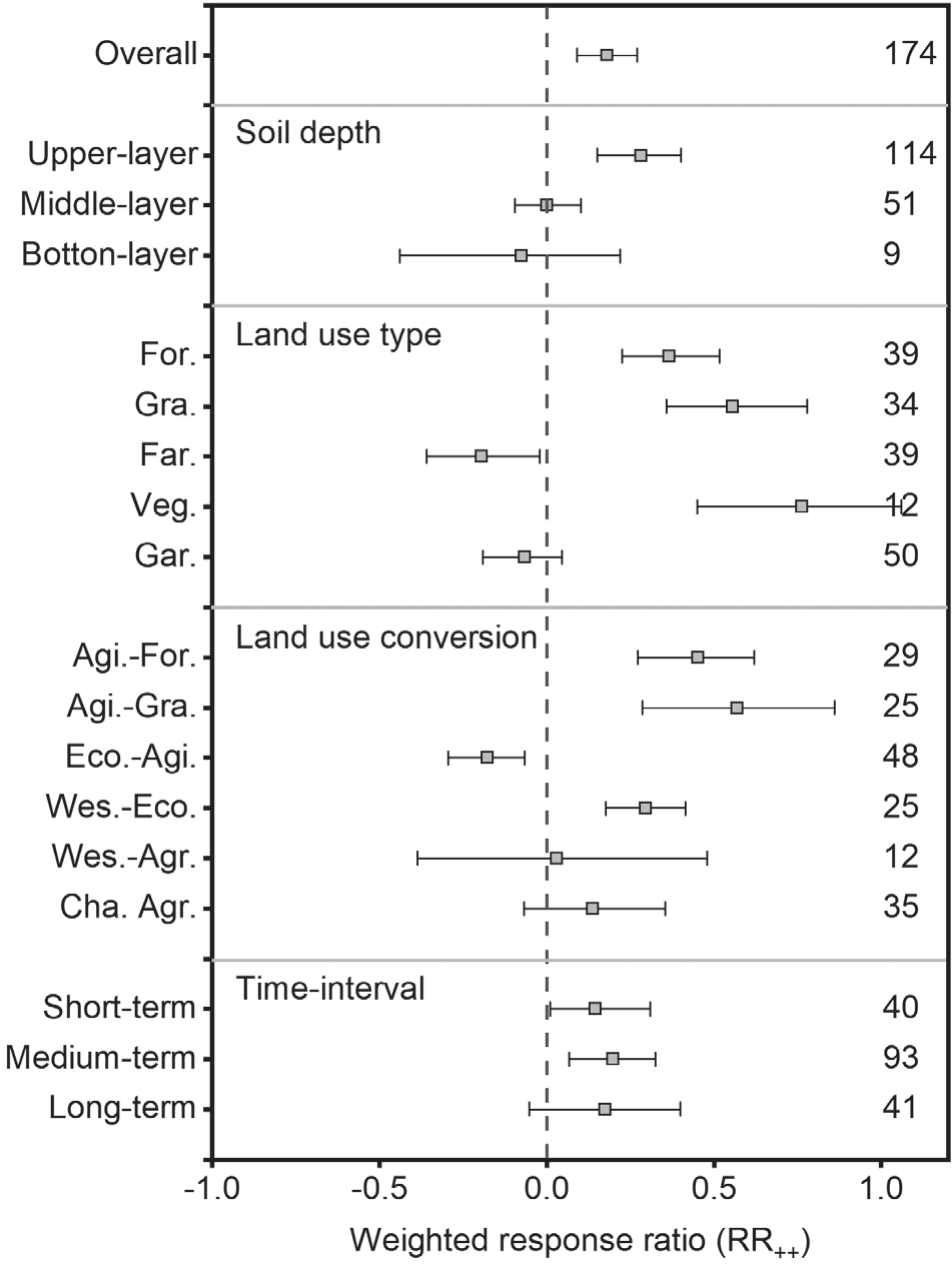
The response of SOC content to land use changes depended on soil depth (Fig. 5). The SOC content in the upper layer increased by 32.5%, while there was no significant influence at other soil levels. The response of SOC content to land use changes was altered by different land use types and conversions. Primary land use converted to vegetable field, grassland, and forest land increased the SOC content by 114.6%, 74.4%, and 44.1%, respectively, while it decreased by 17.7% and 6.4% in farmland and garden, respectively. Changing land use from agricultural land to ecological land increased SOC, returning farmland to forest, and returning farmland to grassland, increased SOC by 57.1% and 76.8%, respectively; and changing agricultural land from primary ecological land decreased SOC by 16.2%.
Fig. 3.
A complete conceptual diagram illustrating the response of soil macro-aggregate (a, b) and SOC (c) to different soil use conversions. Eco., ecological land; Agr., agricultural land; Was., wasteland. dotted line indicate change among different agricultural lands. The red arrow and blue arrow indicate positive and negative effects, respectively.
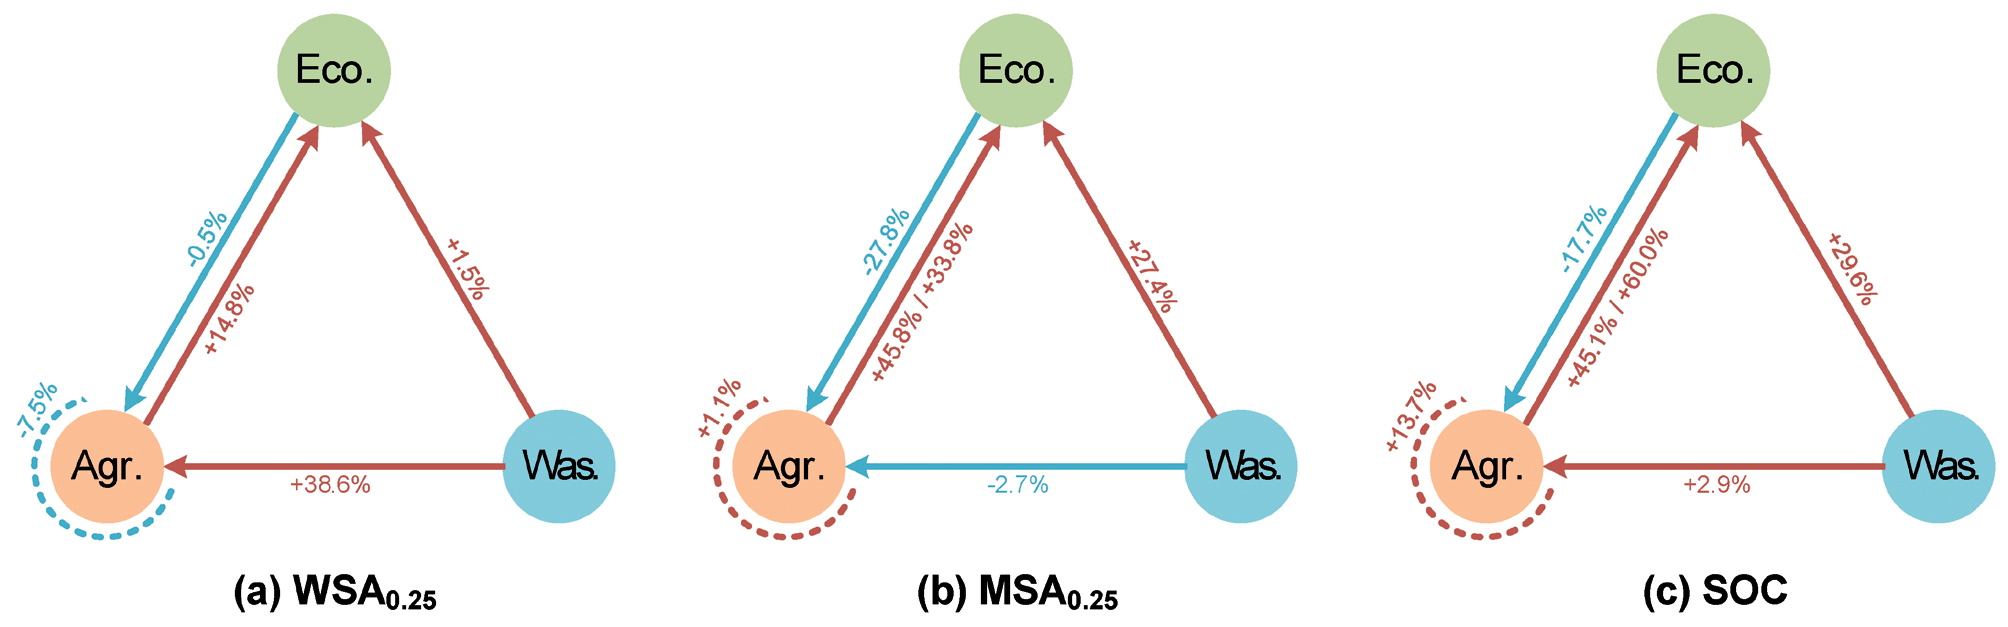
Fig. 4.
Random Forest modeling analysis for the relationships between effect sizes of soil macro-aggregate and main soil properties across all studies. BD, bulk density; SOC, soil organic carbon; TN, total nitrogen; TP, total phosphorus; Ava. P, available phosphorus.
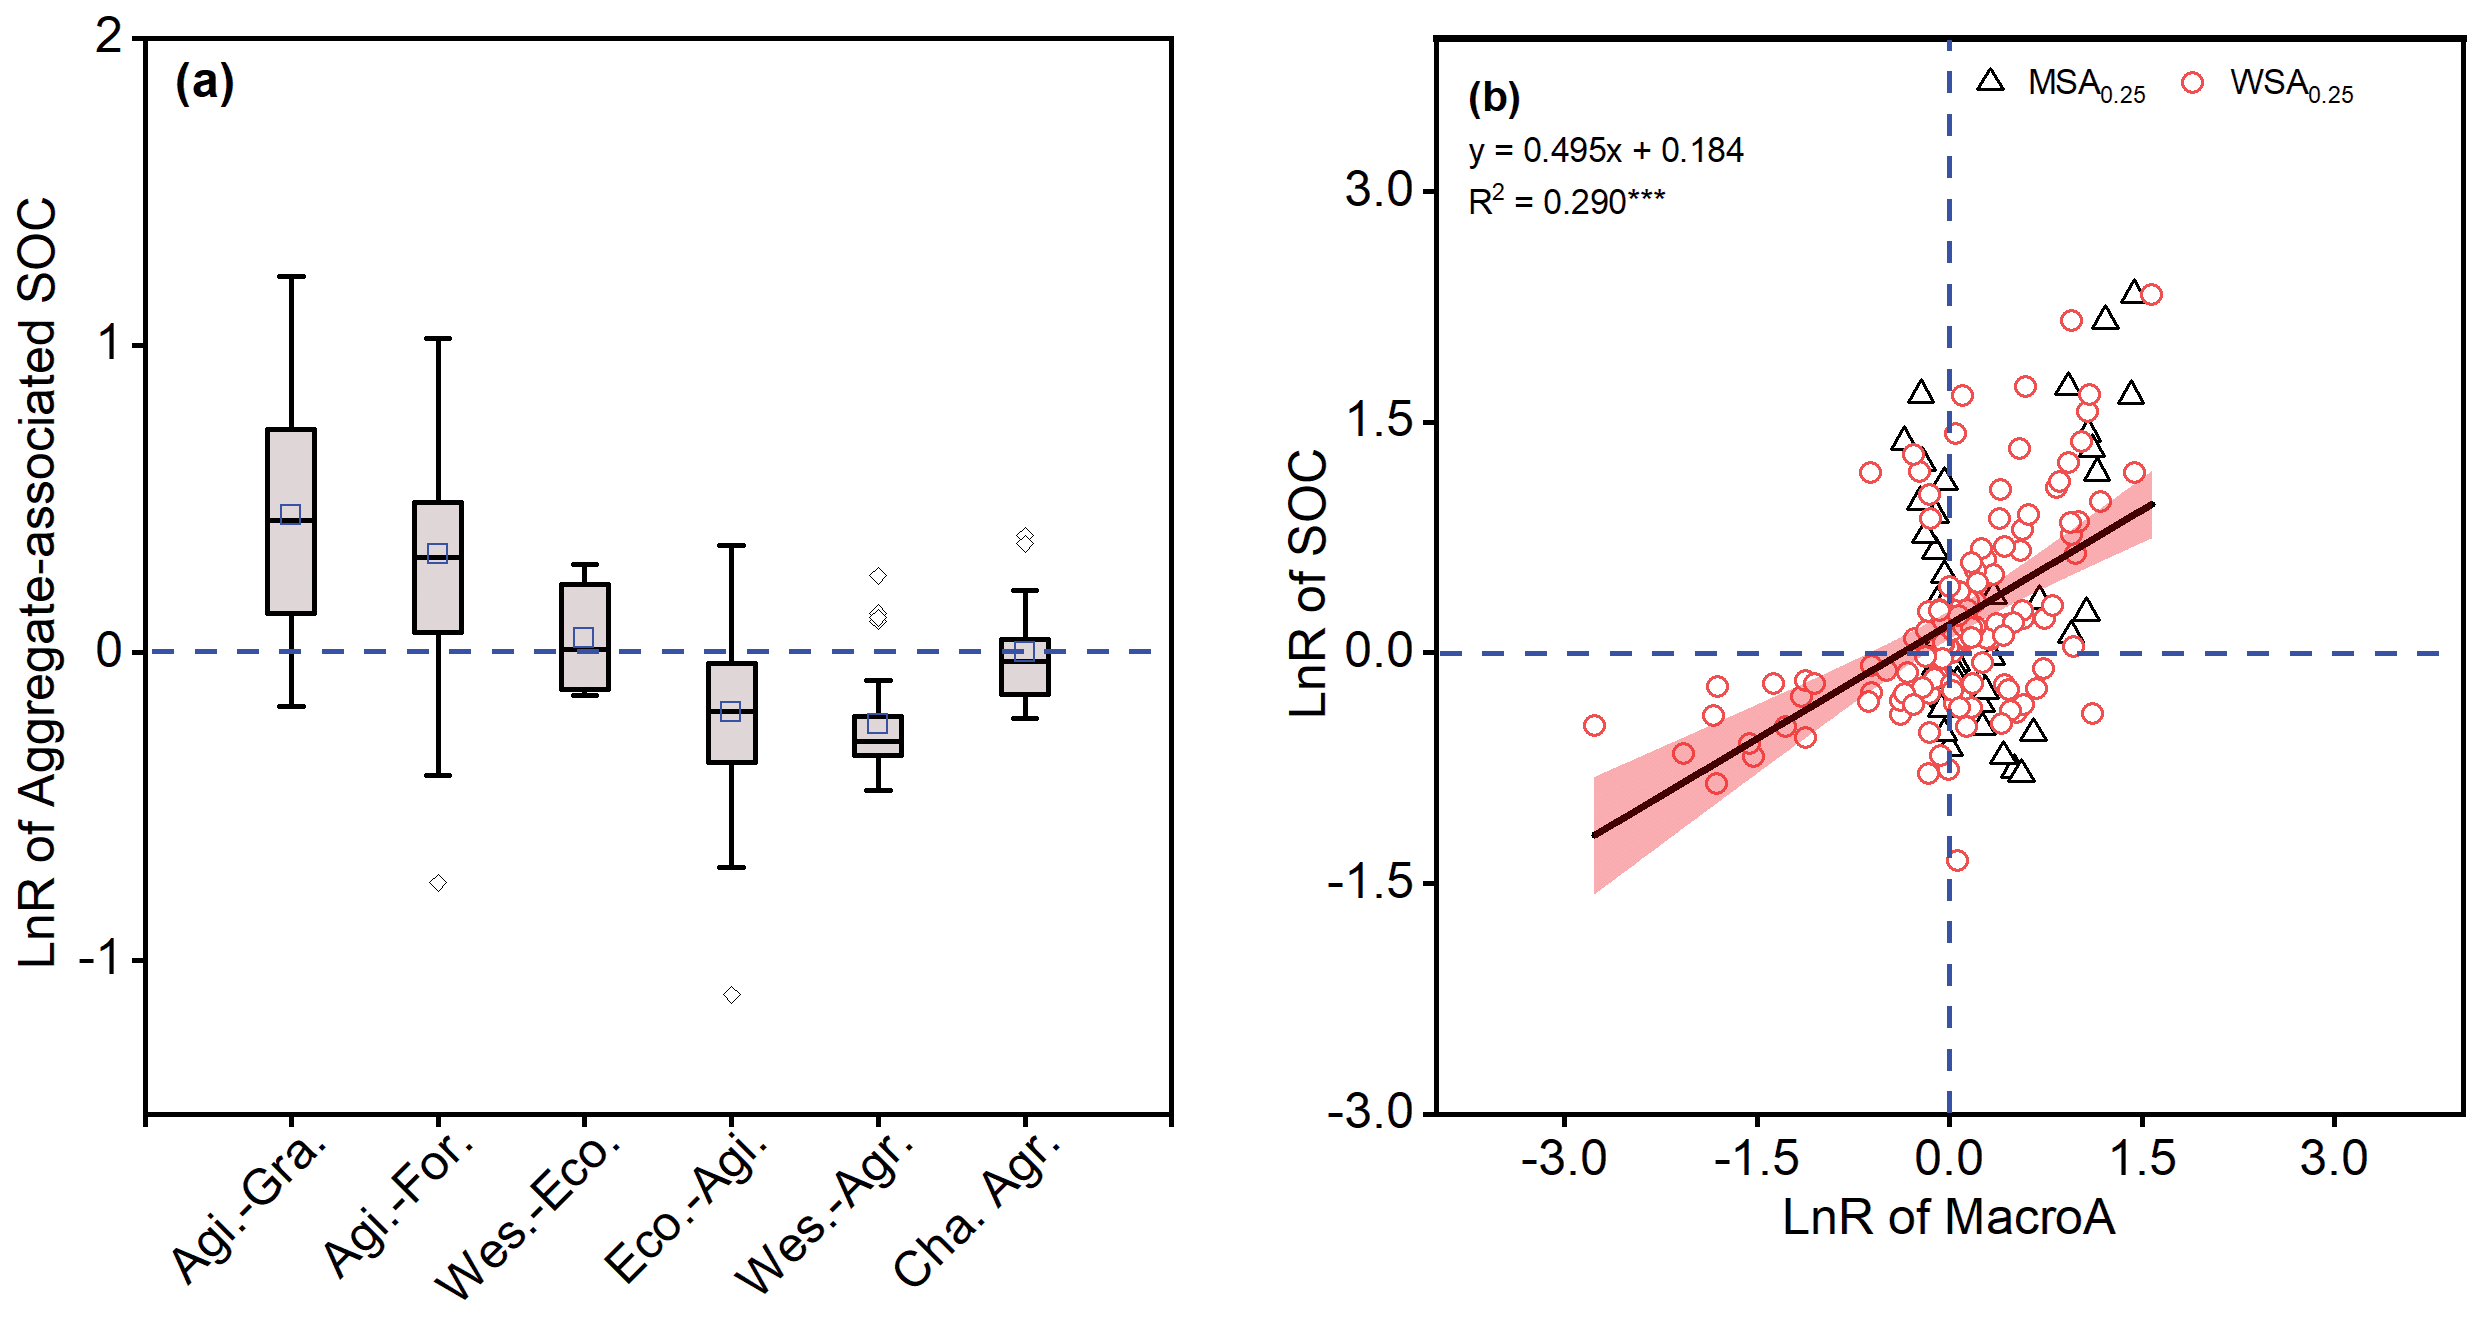
Aggregate-associated SOC increased when primary agricultural land was converted to forest and grassland (Fig. 6a). By fitting the linear regression relationships between SOC and MSA0.25 and WSA0.25, a clear positive correlation was found between the LnR of SOC and WSA0.25 (Fig. 6b).
The Response of Soil Aggregate Stability to Soil Use Change
By comparing the land use change effect on aggregate stability by the wet and dry sieve methods, our study indicated that the response of soil macro-aggregate (MSA0.25 and WSA0.25) contents to different land use types and conversions was not consistent (Fig. 2). A previous literature review found that the increase in aggregate stability by the wet sieve method (18.2%) was significantly different from that by the dry sieve method (4.05%) with biochar addition [10] (Islam et al., 2021). This was due to the difference between the dry and wet sieving methods of sieving soil aggregate. Considering the influence of the natural environment on the structural stability of the soil, the wet sieving method better reflects the effect of different land use practices on the variation in soil macro-aggregate content [10]. WSA0.25 is the optimal indicator of soil structural stability, and improving the quantity and quality of water-stable aggregates can help improve the stability of soil structure [23].
Different land use practices produce different soil microhabitat environments, which obviously affect the productivity of aboveground plants and the physical properties of the soil, thus changing the composition structure of soil aggregates [24]. In our study, the water-stable macroaggregate content increased to different extents after the transformation of farmland into vegetable land, forestland, and grassland, with increases of 80.9%, 79.0%, and 63.8%, respectively (Fig. 2). The reduced input of exogenous organic matter was not conducive to the accumulation of soil organic matter and nutrients, and tillage measures in farmland could destroy aggregate, leading to an accelerated rate of decomposition of organic matter mineralization. In contrast, the content of water-stable large aggregate and the stability of soil structure increased after the transformation of farmland soils into other land-use types [4]. Additionally, soil infiltration can be improved by implementing reduced/ no-tillage practices, which contribute to reducing soil disturbance and promoting soil structure stability [25], and changes in critical soil microbial species also affect soil aggregate stability following afforestation [2]. The ecological restoration has demonstrated a positive influence on soil biodiversity and vegetation productivity. Moreover, it can enhance the accumulation of organic matter in the soil [26]. Following vegetation restoration, notable improvements were observed in soil aggregate stability, soil organic carbon (SOC), and other related properties [27]. Furthermore, the more developed plant roots of forest and grassland were beneficial for improving soil structural stability by reshaping the surrounding soil compared to rice, wheat, and vegetables [28].
Fig. 5.
Changes in soil organic carbon under land use change as affected by soil depth, land use type, land use conversion, and time interval. The numbers on the right represent the sample size.
Texture, clay, cation content, aluminum and iron oxides, and soil organic matter were the major soil properties influencing aggregate stability [29]. In light of this, numerous investigations have been dedicated to exploring the interplay between aggregate stability and clay [30] as well as soil organic carbon (SOC) [31] with respect to these factors. Changes in aggregate content were closely related to soil properties in our meta-analysis. It was clear that soil water-stable macro-aggregate content responded most strongly to soil clay particles and SOC (Fig. 4), which was consistent with the findings of Rivera and Bonilla [32]. Aggregate stability exhibited a significantly positive relationship with organic matter and clay contents. The aggregation of soil with a high clay content exhibits significantly greater levels compared to that with a high sand content [33]. Soil with a higher clay content decomposes plant residues more slowly and is more protective against soil microbial attack [22], and clay soils are more chemoprotective than sandy and loamy soils against active organic carbon fractions due to their higher exchange capacity [34]. Ren et al. [35] reported that a higher clay content limits the enhancement of aggregate content in clayey soils by weakening the growth and activity of soil microbes and the process of soil macro-aggregate.
In addition, land use patterns dominate trends in soil structure mainly by changing the composition distribution of different particle sizes of aggregates in soil and interfering with organic carbon storage and loss processes [36]. The increase in water stability of soil aggregate was related to the accumulation of soil organic matter [37], and Zaher et al. [38] reported that organic matter from aboveground biomass and litter played a significant part in improving soil aggregate, and 80% of the variation in water-stable aggregate content could be explained by SOC. Abiven et al. [29] found that the activity of organic matter decomposition was directly related to soil structural stability; the labile organic compounds had a fast and strong effect on aggregate stability, while the recalcitrant component exhibited no effect. Therefore, the transformation process of cropland, wasteland, and forestland changes the composition of the aggregates and thus has different effects on the stability of soil aggregates.
Moreover, although there were no significant differences in the responses of soil aggregate to land use change in different time intervals (Table 3), we observed that both MSA0.25 and WSA0.25 in the medium term and long term were higher than those in the short term (Fig. 2). Our meta-analysis showed that soil aggregate was significantly increased across the early, medium, and long term experiments. The longer-lasting effect on soil aggregate induced by land use change depended on different land use conversions, and land use conversion from cropland to forest could increase the macroaggregates along with different conversion times [39]; however, the stability of soil aggregates decreases as the level of stand degradation increases [38].
Effect of Land Use Conversion on SOC
Soil organic carbon content shows significant spatial variability because of differences in plant carbon inputs and soil carbon decomposition, which are affected by different land use types [40, 41]. In our study, the SOC content increased by 74.4% and 44.1% in forest and grassland, respectively, compared to other land use types (Fig. 5). Due to less man-made interference and richer species diversity in vegetation restoration, ecological land exhibited lower carbon loss and higher detritus inputs [42]. The presence of litter enhances the cumulative macroaggregate yield of the soil, resulting in increased organic matter (OM) content and reduced susceptibility to erosion. This is achieved by promoting the formation of larger pores, which facilitate improved water penetration and aeration [33]. Ecological land derived from agricultural land increases SOC sequestration by promoting litter and root inputs and biological crusts [42]. Therefore, forest and grassland would increase the SOC accumulation rate compared to agricultural land.
In contrast, the SOC content in upland and orchard decreased by 17.7% and 6.4%, respectively, after primary land-use change, and agricultural land changed from primary ecological land decreased SOC by 17.7% and 20.7%, respectively (Fig. 5a). This could contribute to the organic matter degradation rate resulting from tillage and the removal of crop straw during harvest [43]. In recent decades, the increasing conversion of grassland to farmland has resulted in a significant depletion of soil nutrients [44]. Furthermore, such conversion has numerous adverse impacts on terrestrial ecosystems, including the loss of carbon, nitrogen, and phosphorus [44, 45]. In line with our research, the conversion of grassland to cropland resulted in the loss of soil organic carbon by accelerating soil erosion [46]. The conversion of natural forest to other types increased the proportion of unstable carbon fractions, resulting in easy degradation by soil microbes [38]. However, woodland and grassland facilitate SOC protection by reducing artificial disturbances and restoring ecology [47].
Different size fractions of aggregate are associated with different SOC contents [48]. In our study, the aggregate-associated SOC contents increased with increasing size, and associated SOC increased in the sequence of Agr.-Gra. and Agr.-For. by 56.2% and 27.7%, respectively (Fig. 6a), and the partial correlation analysis showed that the change in SOC was positively correlated with WSA0.25, whereas MSA0.25 was not (Fig. 6b), which all suggested that water-stable aggregate was the main contributor to increasing soil organic carbon. It has been reported that the aggregate sieving method could affect the quantification of SOC content in aggregates, and the results of dry sieving are not always repeatable [49]. In line with Zhou et al. [50], who reported that small macroaggregates had larger SOC contents and higher soil aggregate stability within five different cropping systems. Mustafa et al. [9] also reported that the SOC content in macro-aggregate (> 250 μm) was higher than that in other particle sizes, irrespective of the applied treatment. Higher The higher SOC content in macro-aggregate could be attributed to cementation induced by plant roots, fungal hyphae, and organic matter decomposition products, which promoted the aggregation of micro-aggregate into macro-aggregate, thereby protecting organic carbon by avoiding degradation [51]. In conclusion, the integrated consideration of soil aggregates and organic carbon content could comprehensively reflect the response of soil aggregate stability and carbon sequestration to land use change.
In accordance with our meta-analysis, no obvious discrepancy in macro-aggregate and SOC contents was observed between the short-term and multiyear results (Fig. 5). In general, the increase in SOC storage over time was more dependent on the content of macro-aggregate [3]. Cao et al. [13] found that the carbon sequestration potential of aggregates improved with increasing planting years, owing to the long-term inputs of litter and organic fertilizers during orchard management. Li et al. [39] also revealed that land use conversion from cropland to forest could increase the macro-aggregate along with different conversion times, while SOC accumulation rates decreased with tea plantation [14].
Conclusions
This meta-analysis showed that the feedback of soil aggregate and SOC content to land use change was inconsistent. Land use change altered soil macroaggregate and SOC in the upper-soil layer, and soil water-stable macro-aggregate was more sensitive to land use conversion. The response ratios of the soil macroaggregate were significantly related to different land use types and conversions; primary agricultural land and wasteland converted to ecological land increased soil aggregate and SOC, while agricultural land changed from primary ecological land decreased soil aggregate and SOC. The variations in the responses of soil aggregate and SOC to land use change were mainly affected by the contents of clay, SOC, BD, and pH, and aggregate-associated SOC was positively correlated with water-stable aggregate. Our findings elucidated the interactive relationships between land use change and soil aggregate/ aggregate-associated SOC. Appropriate management practices should be implemented to reduce soil losses and increase soil carbon sequestration, especially for ecological land changed into agricultural land.

