

Introduction
Since the advent of the industrial age, human society has seen an increase in carbon dioxide emissions, resulting in elevated atmospheric carbon dioxide concentrations. This has led to a slowdown in heat dissipation within the atmosphere, causing global temperatures to growth. The greenhouse effect has induced a series of severe ecological and environmental issues worldwide, including rising global sea levels, exacerbated land salinization, and seawater intrusion [1]. Carbon dioxide concentrations reach their peak during a certain period, known as “carbon peak.” When the amount of carbon dioxide generated by human activities balances with the amount absorbed, it is referred to as “carbon neutrality” [2]. By 2020, countries such as the United Kingdom, the United States, Japan, South Korea, and others had achieved carbon neutrality, with China pledging to reach carbon neutrality by 2030 [3]. Currently, Suriname and Bhutan declared in 2014 and 2018, respectively, that they have achieved carbon neutrality. Suriname boasts a forest coverage rate of 90%, while Bhutan’s forest coverage stands at 60% [4], indicating their substantial carbon sequestration capabilities [5]. China, with its vast land covering 9.6 million square kilometers [6], exhibits significant regional variations in carbon sequestration capacity. Particularly in arid regions in the northwest [7-9], low vegetation coverage and low NPP pose challenges. Monitoring changes in NPP levels in these arid regions and analyzing the factors influencing these changes are of paramount importance for enhancing carbon sequestration capabilities in arid regions[10]. This is crucial for safeguarding and achieving China’s “dual carbon” plan [11].
Vegetation NPP represents the organic matter produced by photosynthesis in plants minus the portion consumed by autotrophic respiration. To a certain extent, it reflects a plant’s capacity to convert and sequester carbon through the utilization of light energy [12, 13]. Accurately estimating NPP is important when calculating the carbon storage in a study area. Numerous scholars have used various methods to estimate NPP in a study area. The primary approaches include field measurements [14] and model-based estimations [15]. Field measurements provide more accurate results, but are complex and impractical for estimating NPP over large areas [16]. Among the model-based methods, the CASA (Carnegie-Ames-Stanford Approach) model is gaining popularity due to its minimal input parameters (photosynthetically active radiation absorbed by vegetation and light use efficiency), effectively reducing errors associated with excessive input parameters [17]. It is increasingly employed by researchers to estimate NPP and has been well validated; Li Huaihai [18], for example, utilized the CASA model to estimate Grassland NPP in the Shiyang River Basin and improved the CASA model by incorporating a Grassland classification system based on bioclimatic indicators, addressing the issue of NPP estimation being disconnected from Grassland types. Similarly, Liu Liang [19] used multi-year NDVI and meteorological data as a basis, employing an enhanced approach with the CASA model to estimate vegetation NPP in the Ili River Basin and conducted a detailed spatiotemporal analysis of NPP distribution patterns.
The study area falls within a typical arid region, and in recent years, many scholars have researched the relationship between vegetation Net Primary Productivity (NPP) and climate factors in the Xinjiang region. This research is essential for better monitoring the health of the vegetation ecosystems within administrative boundaries. For instance, Zhang Renping [20] monitored the relationship between NPP in the Changji Prefecture Grassland and climate factors and found that precipitation is a critical influencing factor for Grassland. However, in high-altitude areas, warming is beneficial for Grassland expansion. Chang Xue’er [21] took a perspective on land use changes in the Kashgar River Basin of Xinjiang and analyzed the relative contributions of land use to vegetation NPP. The study revealed that the shift in the center of gravity of cultivated land, forestland, and high-coverage land coincided with the change in the center of gravity of vegetation NPP. In this study, we approach the issue from two angles, examining the impact of natural condition changes and land policy changes on vegetation NPP in the Kashi region, which is divided by administrative boundaries, from 2001 to 2020. This approach helps avoid errors resulting from analyzing changes in vegetation NPP based on a single condition. The goal is to accurately assess the driving factors affecting vegetation NPP in the Kashi region, providing a theoretical and practical basis for arid regions, represented by Kashi, to achieve their carbon peak target by 2030 [22].
Materials and Methods
Study Site
Kashi Prefecture (located between 71°39’ to 79°52’ E longitude and 35°28’ to 40°16’ N latitude) is situated in the southwestern part of Xinjiang, a region in northwestern China. To the east of Kashi Prefecture lies the Taklamakan Desert, and it shares its northeastern border with the Aksu and Kizilsu Kyrgyz Autonomous Prefecture. To the west, it shares borders with Tajikistan, Afghanistan, and Pakistan. In the south, the towering Pamir Plateau and Karakoram Mountains dominate the landscape. The total area of the entire region is 110,300 square kilometers (calculated based on land use area in this study). It measures approximately 750 kilometers from east to west and 535 kilometers from north to south. In terms of administrative divisions, Kashi Prefecture consists of one county-level city, ten counties, and one autonomous county. The climate in Kashi Prefecture falls under the category of a typical temperate desert climate [23], characterized by long sunshine hours, high evapotranspiration, and arid conditions. The region experiences two distinct seasons throughout the year, with cold winters and warm summers [24].
Data Collection
This study employs the CASA model to estimate vegetation Net Primary Productivity (NPP), which requires the use of various remote sensing satellite data. The Normalized Difference Vegetation Index (NDVI) data is sourced from the dataset provided by NASA (National Aeronautics and Space Administration), with a temporal resolution of 16 days and a spatial resolution of 500 meters. Other optical data is extracted from remote sensing satellite datasets such as MOD09A1 and MOD17A3. For the analysis of land use, data is sourced from the Landsat series of remote sensing satellite data provided by the United States Geological Survey (USGS). These data have a temporal resolution of 16 days and a spatial resolution of 30 meters. In the assessment of the impact of climate change on NPP, annual average temperature and precipitation data for the Kashi region are collected from ten meteorological stations. This meteorological data is obtained from the National Meteorological Information Center website. Specific data sources are detailed in Table 1.
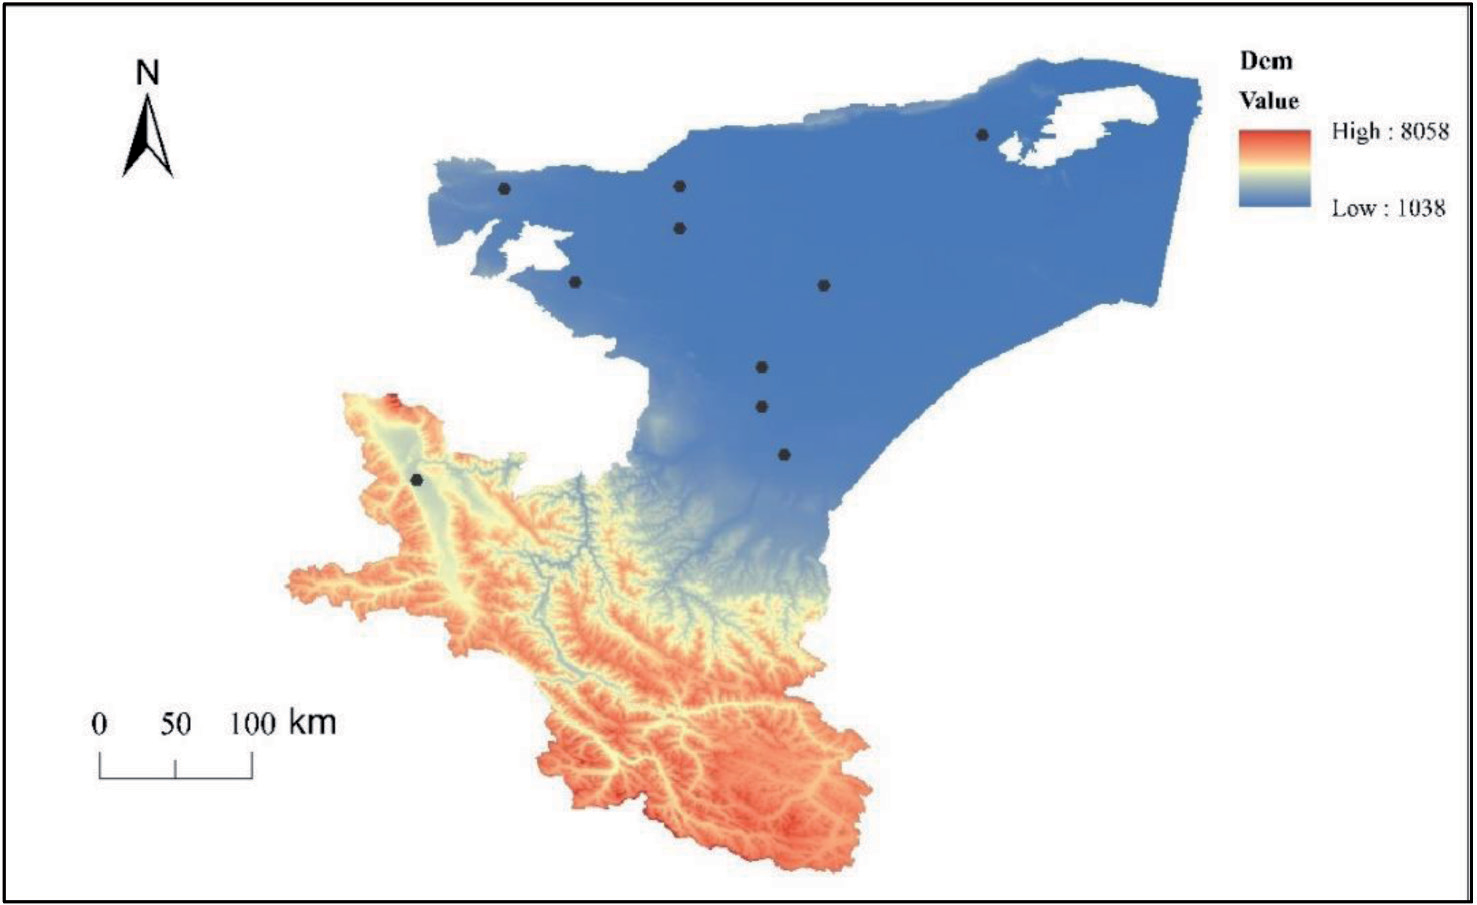
Table 1.
Using data and sources
Estimating Vegetation NPP Using the CASA Model
This study employs an improved CASA model, as proposed by Zhu Wenquan and others [25], and incorporates parameters such as NDVI index, land use change, temperature, precipitation, and other variables. The CASA model primarily focuses on two key variables: Absorbed Photosynthetic Active Radiation (APAR) and the light energy conversion efficiency (ε) [26]. The calculation formula is as follows:
In the equation, APAR (λ, m) represents the photosynthetically active radiation received by the λ pixel in month m, measured in MJ/m2, and ε (λ, m) represents the efficiency with which the λ pixel converts solar energy into carbon, measured in g C/MJ.
Trends in NPP Change and Significance Testing
This study employs the Theil-Sen Median trend analysis method to calculate the vegetation NPP trends in the Kashi region from 2001 to 2020. Additionally, the significance of these trends in vegetation change over the last 20 years in the Kashi region is tested using the Mann-Kendall method [27]. The Sen trend calculation formula is as follows:
In the equation, Xi and Xj represent the average values of vegetation NPP in the Kashi region in the i and j years, while M represents the trend in vegetation NPP over the study time series. When M is greater than 0, it indicates an increasing trend in vegetation NPP over the study period, whereas when M is less than 0, it signifies a decreasing trend in vegetation NPP over the study period.
The Mann-Kendall (M-K) significance test method is characterized by its effectiveness in reducing noise interference in time series analysis and is commonly used for testing the significance of long-term trend changes [28]. The calculation formula is as follows:
In the equation, S is the statistical parameter, Xi and Xj are time variables following a random distribution, with no fixed upward or downward trends. In formula (5), the calculation formula for the statistical parameter Z is as follows:
S follows a normal distribution, and Var(S) represents the variance. The formula for calculating the variance is as follows:
Correlation Analysis
The Pearson correlation analysis method is employed, which involves finding the correlation between two variables when one is known [29]. In this study, 20 years of annual meteorological data (temperature and precipitation) from ten meteorological stations in the study area were used. These data were subjected to inverse distance weighting interpolation using ArcGIS software, followed by pixel-wise correlation analysis with vegetation NPP. The calculation formula is as follows:
Here, Xi represents the mean vegetation NPP in the i year, X represents the mean vegetation NPP over the past 20 years, Yi represents the mean climate factors (temperature and precipitation) in the i year, and Y represents the mean climate factors over the past 20 years. The value of R falls within the range [-1, 1], and represents the correlation coefficient between X and Y. Based on the criteria for correlation established by Chen Chunbo and other researchers [30], the criteria for correlation in this study are shown in Table 2.
Profit and Loss Analysis
In order to calculate the changes in vegetation NPP caused by changes in different land types, this study, by using Arcgis software, matrixed the four land use types in Kashi region in 2001, 2010, 2015, and 2020, and calculated the mutual transformations of different land use types in Kashi region from 2001 to 2020, so as to quantitatively analyze the land use changes caused by the gain and loss of vegetation NPP [31]. The land use type matrix is calculated as.
In the formula
In the equation denotes the gain or loss in NPP of vegetation in Kashi from conversion of land use type x to land use type y in a given period, and denotes the value of NPP for land use type x and land use type y, respectively, and denotes the area of land use type x that is converted to land use type y.
Results
Spatial and Temporal Characteristics of Vegetation NPP
Analyzing the evolution characteristics of vegetation NPP in the study area from 2001 to 2020 (Figure 2), it is observed that vegetation NPP has exhibited a slow declining trend over the past 20 years, with a decline rate of -0.0069. Specifically, during the period from 2001 to 2015, vegetation NPP showed an increasing trend, with a growth rate of 0.303 (calculated as the difference between the mean NPP values in 2015 and 2001 divided by the NPP value in 2001). However, from 2016 to 2020, it exhibited a faster declining trend with a rate of -0.202. Examining the year-over-year changes in vegetation NPP from 2001 to 2020 (calculated as the difference between the NPP value of the current year and the previous year, divided by the NPP value of the previous year), it can be observed that over the past 20 years, NPP experienced rapid positive growth in 3 years (specifically, in 2004, 2013, and 2015), reaching its peak at 5.385 gC/m2 in 2013. On the other hand, there were 3 years with rapid negative growth (in 2006, 2015, and 2020), with the lowest value recorded in 2016 at 3.886 gC/m2.Analyzing NPP heterogeneity (calculated as the ratio between the annual mean NPP and the 20-year mean NPP), it is evident that the years with significant positive increase were 2004, 2007, 2010, 2013, 2015, and 2017. The year 2013 exhibited the highest heterogeneity with a growth rate of 0.159. Conversely, the years with significant negative growth were 2006, 2008, 2012, 2014, 2016, and 2019, with the strongest negative heterogeneity observed in 2016 with a growth rate of -0.166.
Table 2.
Criteria for correlation assessment
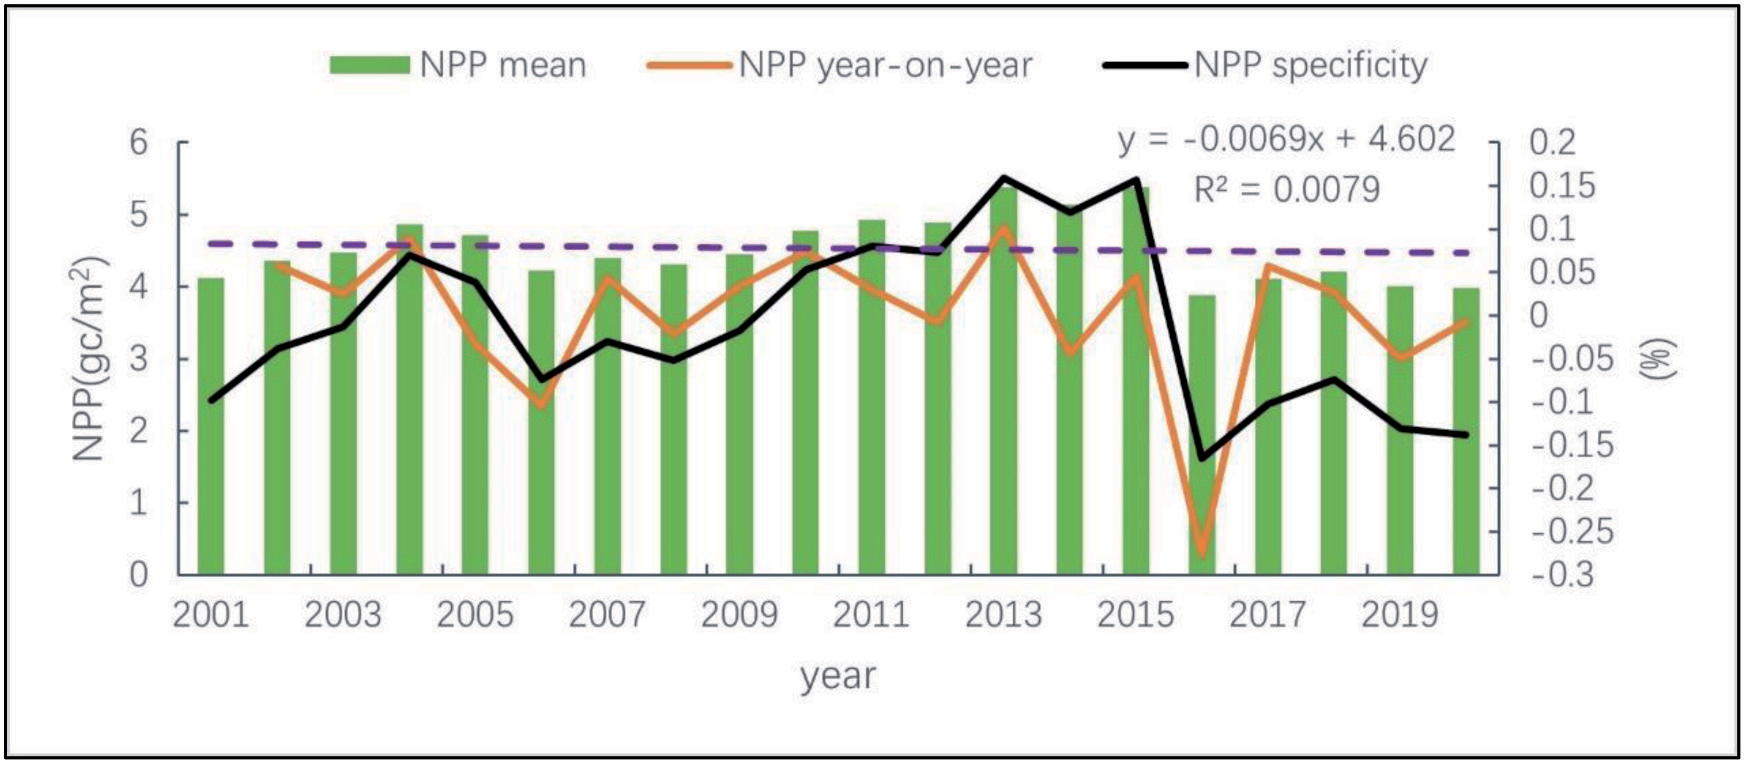
Fig. 3.
The distribution of vegetation NPP in the Kashi region for the years 2001, 2010, and 2020, along with the 20-year average.
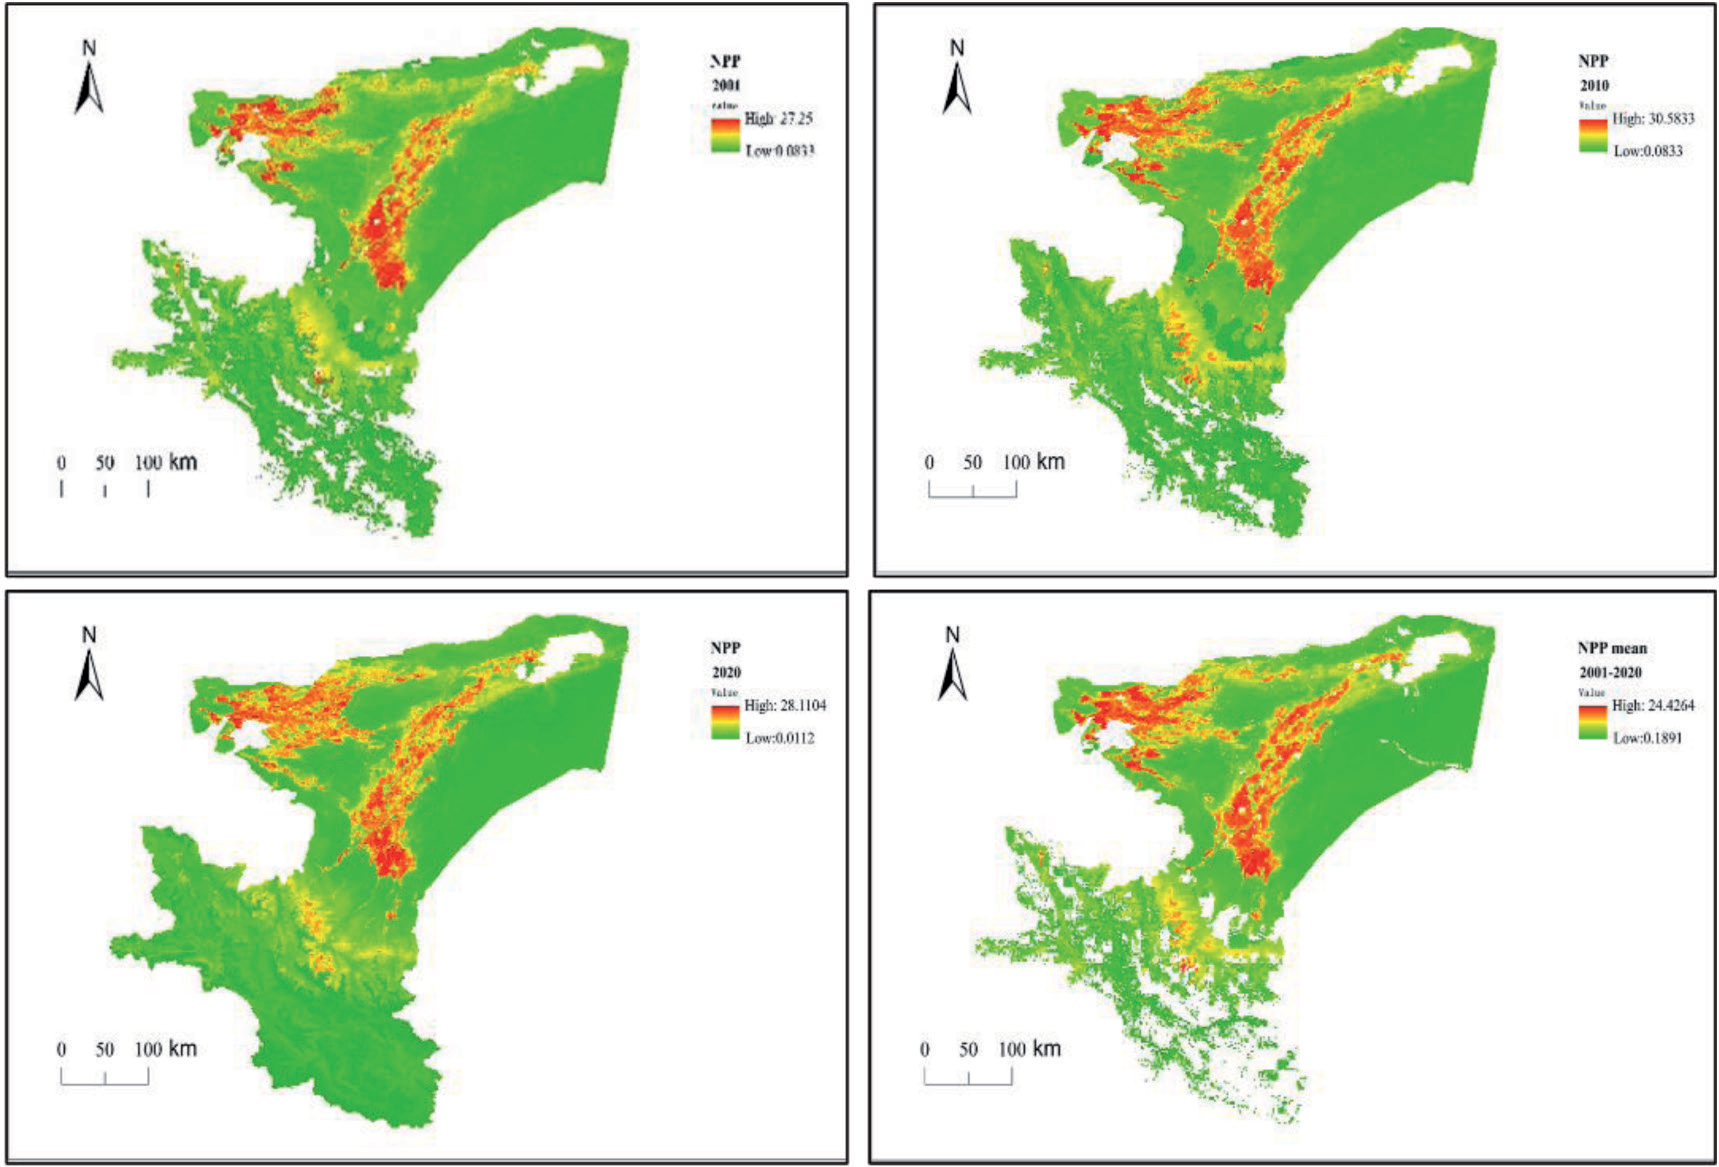
In this study, we selected the spatial distribution of NPP in the Kashi region for the years 2001, 2010, and 2020 (Figure 3). By comparing the NPP distribution maps over the past 20 years, we can observe that NPP has undergone a process of initially increasing and subsequently decreasing. High NPP values are predominantly concentrated in the towns along the rivers in the central-western part of the study area and in a strip along the southwestern Pamir Plateau. Low NPP values are primarily found in the eastern Taklamakan Desert and the southern Pamir Plateau of the Kashi region. The towns in the study area are typical desert oasis cities [32]. Towns located in the Yarkand River and Kashgar River basins have abundant water resources, resulting in a predominance of forest and Farmland vegetation types and consequently higher NPP levels [33]. In contrast, the low NPP areas are characterized by land types such as deserts, desolate regions, and snowy mountains [34].
Kashi Region Vegetation NPP Evolution Trend and Significance Testing
This study uses the Sen method to analyze the trend and significance of the 20-year average vegetation NPP in the Kashi region. According to Shi Zhiyu et al. [35], the Sen+MK method is employed for significance analysis in the study area. The criteria for the significance test in the study area are shown in Table 3.
From 2001 to 2020, the area with a significant increase in Net Primary Productivity (NPP) in the study region accounted for 18% of the total area. This increase was mainly distributed in the central region of Kashi, on both sides of the Yarkant River basin, and in the urban areas with high population density near the western Kashgar River basin. There was also a trend of expansion. In the southwest of the study area, Tashkurgan Tajik Autonomous County (Taj County) belongs to the Pamir Plateau, with an average annual temperature of only 4 °C, and the vegetation NPP also showed a significant increasing trend. The area with a significant decrease in NPP in the study region accounted for 16.8% of the total area and was primarily located in the desert areas between the eastern Taklamakan Desert, the Yarkant River basin, and the Kashgar River basin. The land types in this region were characterized by deserts and Gobi. Overall, in the past 20 years, the areas showing a decreasing trend in vegetation NPP in the study region accounted for 73% of the total area, while the areas showing an increasing trend accounted for 37% of the total area. Therefore, the study region as whole exhibited a decreasing trend in vegetation NPP, consistent with the continuous 20-year evolution of vegetation NPP characteristics. In addition, significant tests on NPP revealed that water resources promote an increase in vegetation NPP, and recent human activities such as land reclamation and irrigation also have a promoting effect on vegetation NPP [30, 36].
Vegetation NPP Response to Climate Factors
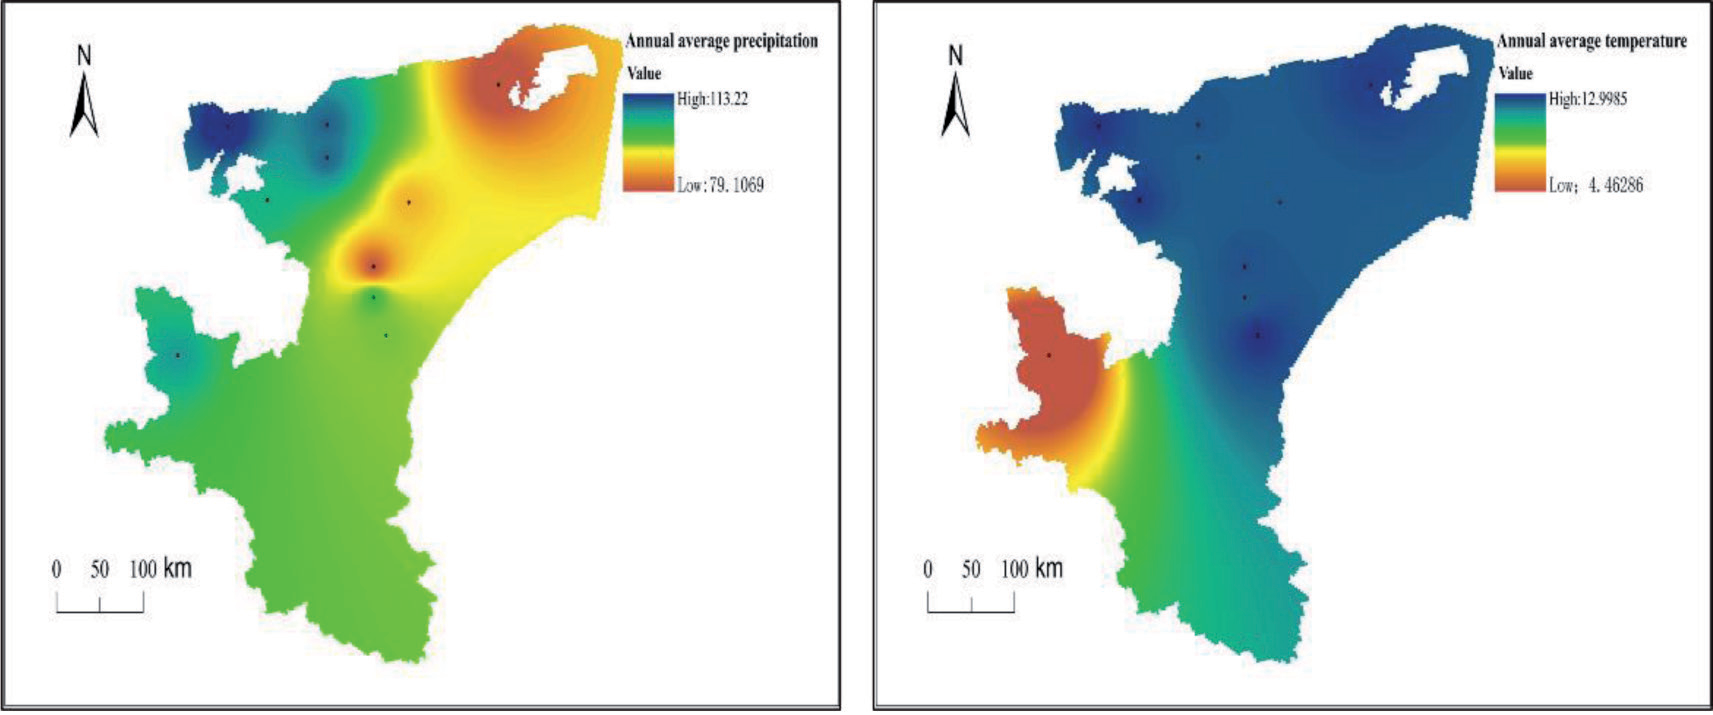
From the distribution of the 20-year average precipitation in the study area (Figure 5), it can be observed that the annual average precipitation for the entire region is 79.25 mm. In the western towns of the study area, including Kashi City, Shufu County, Shule County, and Tashkurgan County, the annual average precipitation is relatively abundant, reaching 112 mm. In the northeastern towns of the study area, precipitation is scarce, especially in counties like Maigaiti County, Kashi city, Yecheng County, located on the edge of the Taklamakan Desert, where the annual average precipitation is as low as 57.3 mm. There is a significant difference in temperature and precipitation, with the Pamir Plateau, Tashkurgan County, and the Karakoram Mountains having an annual average temperature of only 4.5 °C, while other towns and eastern desert regions have an annual average temperature of 11.2 °C.
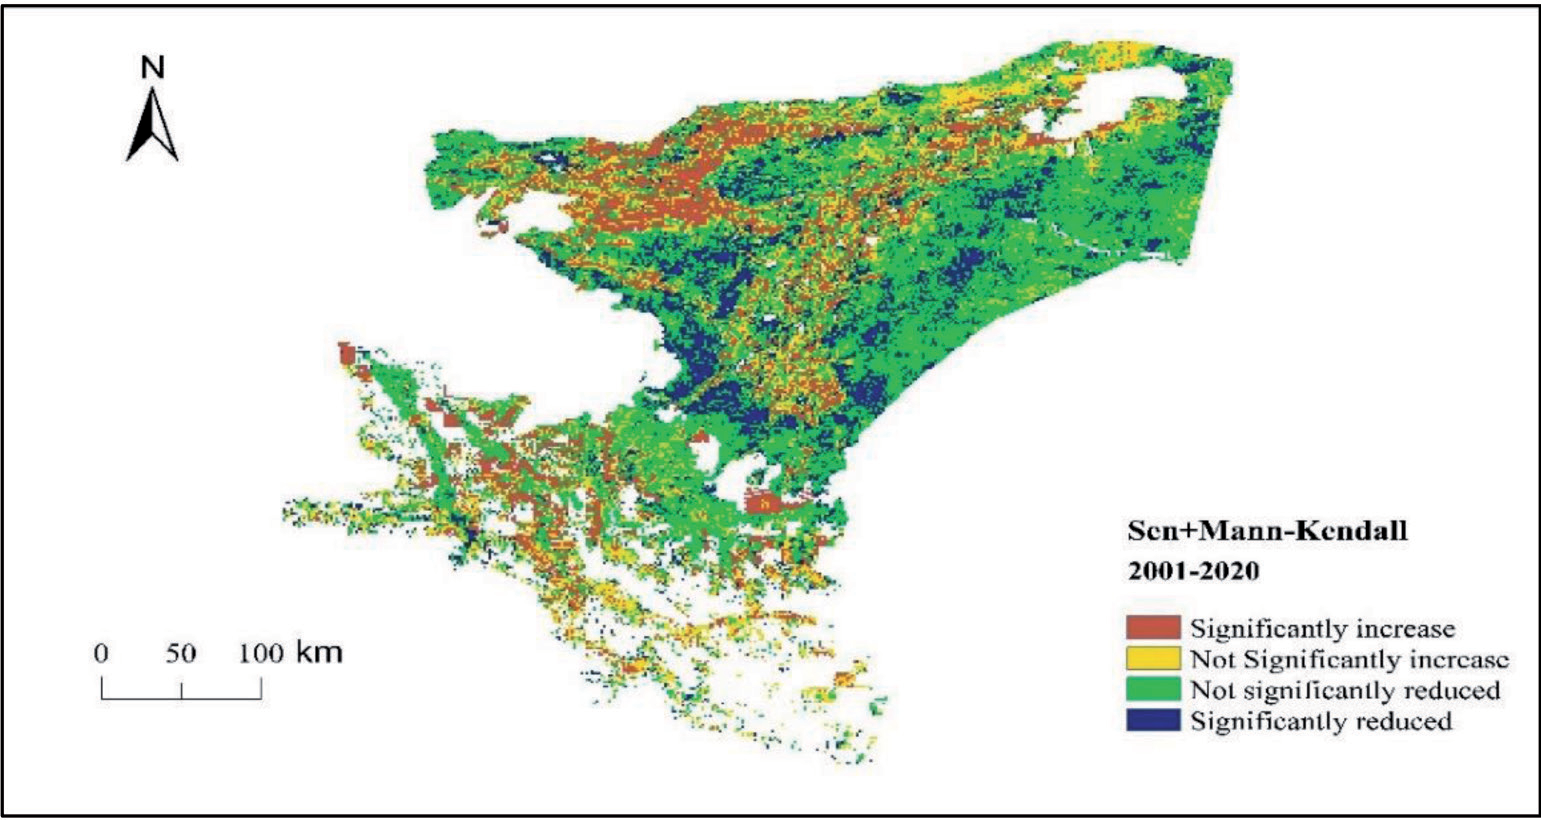
Table 3.
Criteria for Significance Testing of Vegetation NPP
| Test type | Criterion | Area Percentage (%) |
|---|---|---|
| Significant Increase | S>0, Z>1.96 | 18 |
| No Significant Increase | S≥0, Z>1.96 | 18.9 |
| No Significant Decrease | S≤0, Z<1.96 | 46.2 |
| Significant Decrease | S<0, Z<1.96 | 16.8 |
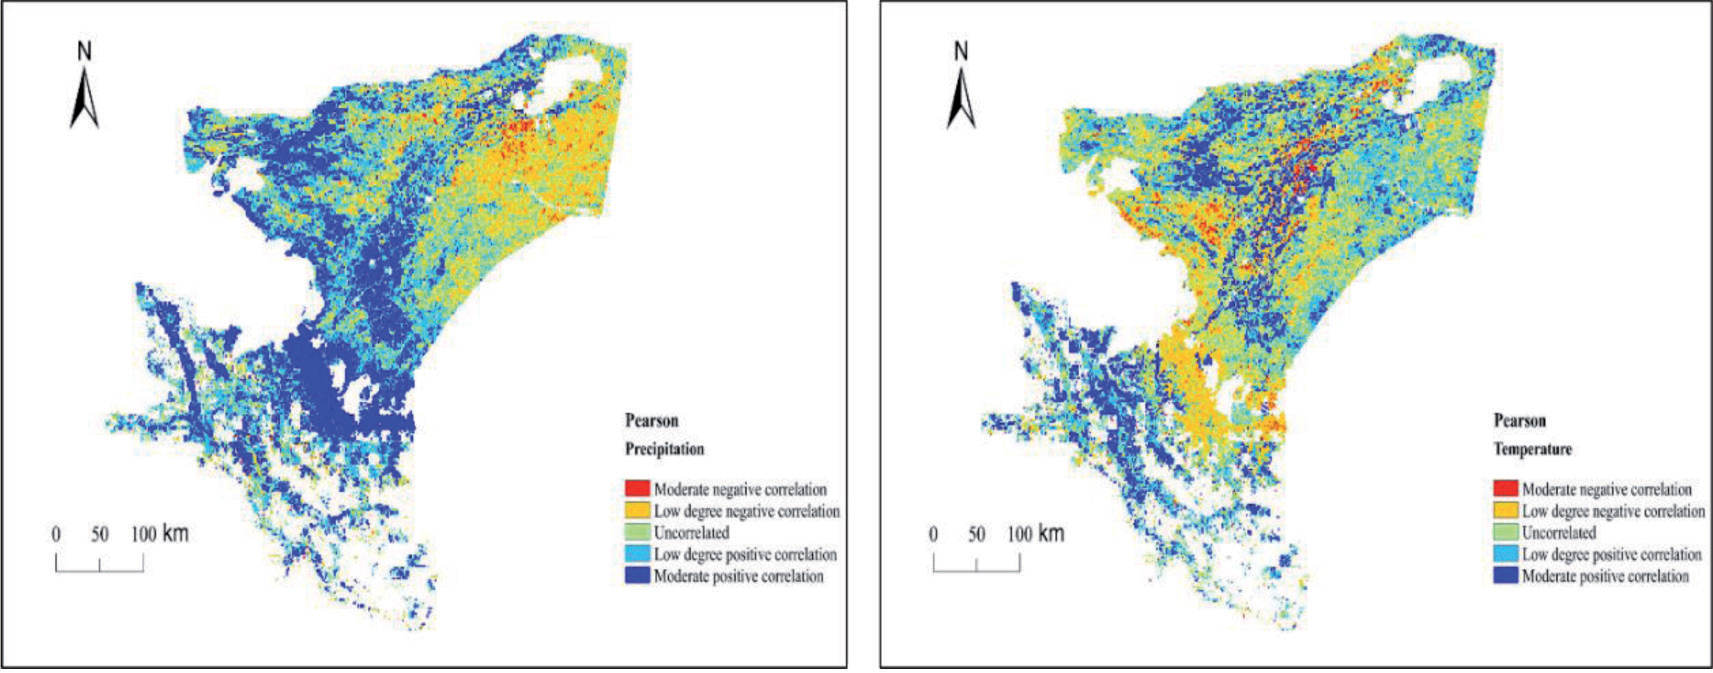
This study employed the Pearson correlation analysis method to examine the temperature and precipitation data in the study area in relation to vegetation Net Primary Productivity (NPP) (Figure 6). The correlation coefficients between NPP and precipitation fluctuated within the range of [-0.7955, 0.8496]. Approximately 19.6% of the study area exhibited a negative correlation between NPP and precipitation, primarily located in the desert regions of the northeastern Taklamakan Desert between the Yarkant River and the Kashgar River. Conversely, approximately 54.7% of the total area showed a positive correlation between NPP and precipitation, concentrated in the towns along the Yarkant River and the Kashgar River. The correlation coefficients between NPP and temperature fluctuated within the range of [-0.7623, 0.8751]. About 27.4% of the total area exhibited a negative correlation between NPP and temperature, primarily found in the eastern Taklamakan Desert region and the western towns of the study area, including Kashi City, Shule County, and Shufu County. Conversely, approximately 40.9% of the total area showed a positive correlation between NPP and temperature, concentrated in the towns along the Yarkant River and the Kashgar River. A significant portion of the Pamir Plateau exhibited a positive correlation with temperature, possibly due to the temperature increase leading to snow and ice melting, increased soil moisture content, and favorable conditions for soil and vegetation conservation [37, 38].
Vegetation NPP Response to Other Factors
The response of vegetation Net Primary Productivity to the external environment is influenced not only by temperature and precipitation but also by external factors such as topography, population and so on . The Kashi region exhibits a topography with a general trend of higher elevations in the south and lower elevations in the north. In the southern part of the study area lies the Pamir Plateau, with mountainous elevations ranging between 5000-8000 meters and year-round snow cover, resulting in extremely low NPP values that can be neglected. The mountainous basins between 3000-5000 meters above sea level predominantly feature alpine meadow vegetation (Figure 7). Examination results using Sen+MK indicate the relationship between vegetation NPP and elevation as follows: (1) In the majority of the areas north of the Pamir Plateau in the study region, with elevations around 1000 meters, vegetation NPP is primarily influenced by water resources. Over the past two decades, significant increases in vegetation NPP are observed in the oasis cities on both sides of the Kashgar River basin and the Yarkant River basin. (2) In the southern plateau region of the study area, situated between 3000-5000 meters in elevation, there is a noticeable upward trend in vegetation NPP over the past two decades, attributed to the dual influence of rising temperatures and increased precipitation. The primary factors contributing to this trend are the annual increase in temperature, melting of snow-capped mountains in the plateau region, and irrigation facilitating suitable conditions for vegetation growth.
The average distribution of population density In the study area from 2001 to 2020 is illustrated in Figure 7. The population in the study area is primarily concentrated in oasis cities on both sides of the Yarkant River basin and the Kashgar River basin. In the population density correlation distribution map with vegetation NPP, the black areas represent uninhabited regions such as snow-capped mountains, deserts, and the Gobi Desert specifically, where human activities are scarce. In the regions with visible population density, the areas exhibiting a positive correlation between population density and vegetation NPP constitute 63.01% of the total, while regions showing a negative correlation account for 14.97%. Areas where there is no correlation between population density and vegetation NPP make up 22.02% of the total. The regions in the study area where vegetation NPP is positively correlated with population density surpass those with a negative correlation (63.01% > 14.97%). In recent years, human activities in the study area, such as land cultivation, desert afforestation, and drainage irrigation, have exerted a positive driving force on vegetation NPP.
Analysis of Changes in Land-Use Structure
This study utilized land use data to visually depict changes in land use within the Kashi region from 2001 to 2020. Land use data for four time periods, specifically 2001, 2010, 2015, and 2020, were downloaded from the United States Geological Survey website at a resolution of 30 meters. The Kashi region, which is divided based on administrative boundaries, had a total land area of 162,000 square kilometers as of the latest data in 2022 [39]. However, this study, calculated the land area for the Kashi region using land use pixels, resulting in a slightly different figure of 110,323 square kilometers, accounting for the observed discrepancy. Taking into consideration the actual land use within the Kashi region, this study categorized the land into six main types: Farmland, forest land, Grassland, water bodies, urban areas, and unused land. The unused land category primarily consists of desert and waste land [40]. Based on the analysis of land use changes in the Kashi region (Table 4, Figure 8), the land use changes in the Kashi region from 2001 to 2020 can be summarized as follows.
(1) Expansion of Farmland: The Farmland area increased by 2865.58 square kilometers, marking a growth of 2.60%. Notably, Farmland expansion was particularly pronounced along the edges of desert oases and urban areas [32, 41].
(2) Decline in Forestland: Woodland decreased by 80.79 square kilometers, with a change rate of -0.07%. Factors such as temperature, precipitation, and human activities contributed to the degradation of forested areas.
(3) Reduction of Grassland: The Grassland area shrank by 2335.45 square kilometers, representing a change rate of -2.12%. Analysis of Grassland use changes revealed a clear transformation of Grasslands near urban peripheries into Farmland, with human activities being the primary driver.
(4) Diminishing Water Bodies: Water bodies experienced a reduction of 244.40 square kilometers, with a change rate of -0.22%. This decrease was partly due to global temperature rise, leading to increased evapotranspiration [37, 42].
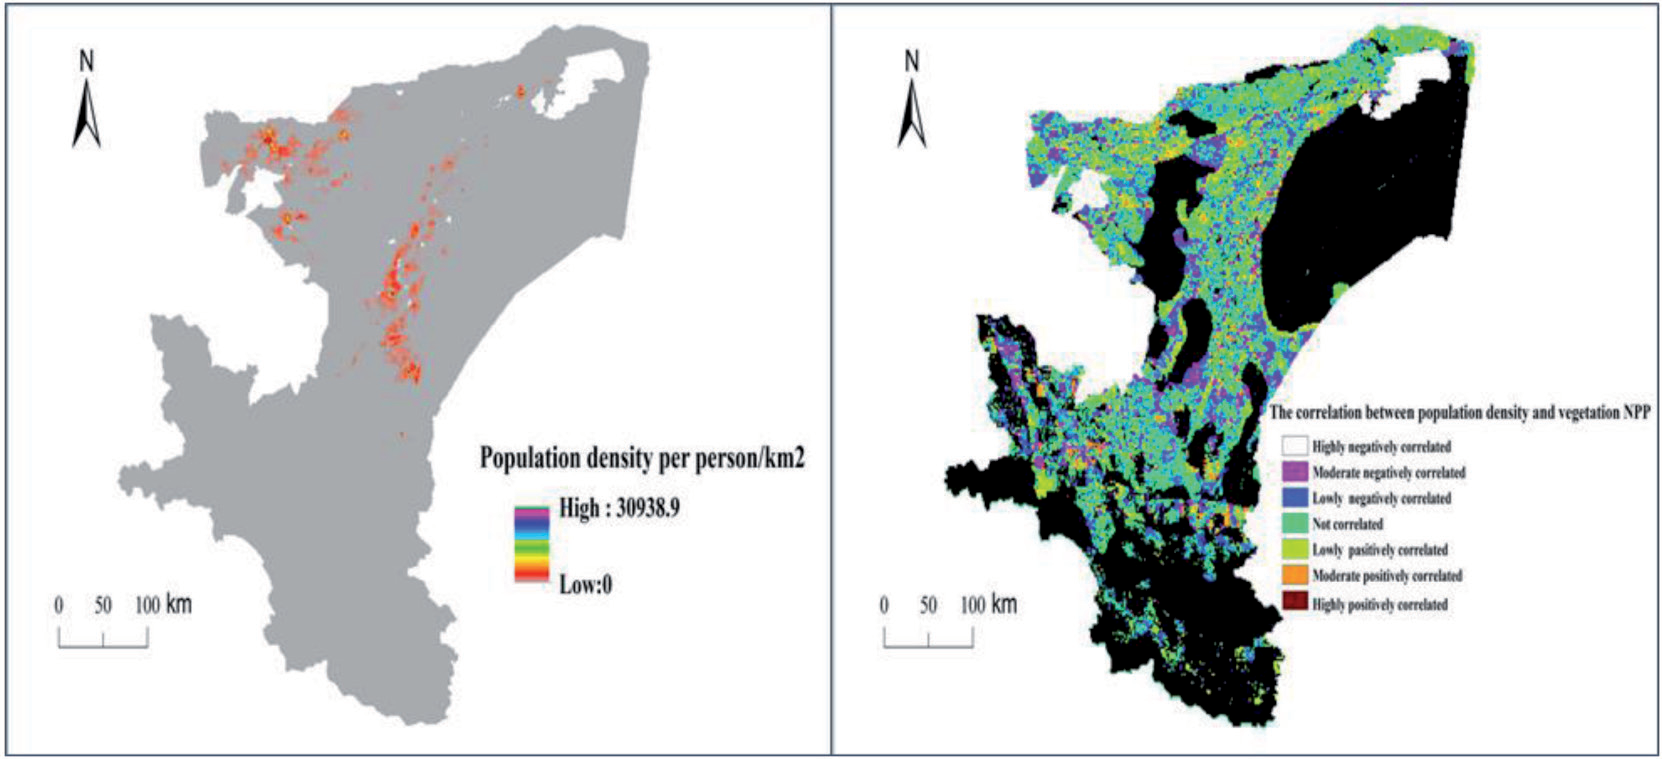
Table 4.
Land Use Changes from 2001 to 2020
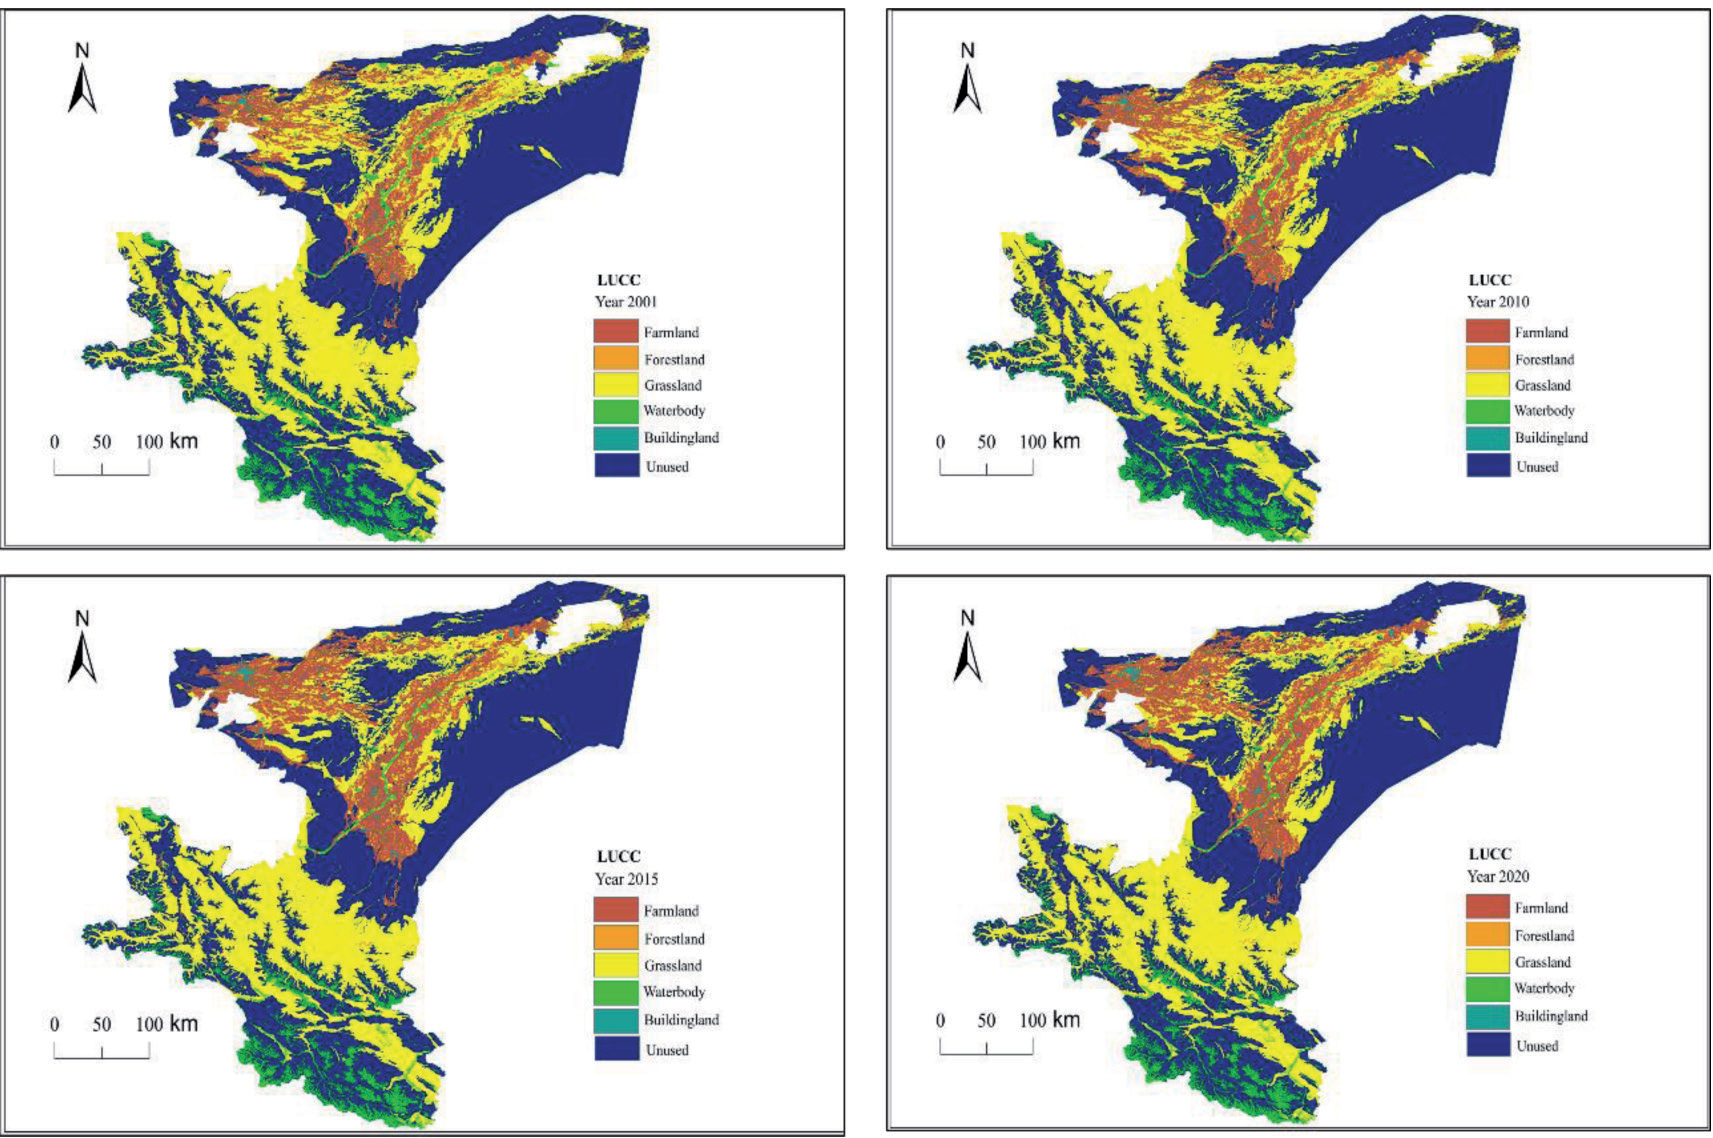
(5) Expansion of Building land: The area dedicated to urban development increased by 236.15 square kilometers, with a change rate of 0.21%. This growth was propelled by the accelerated urbanization and building processes in the Kashi region [43], mainly involving the conversion of Farmland and Forestland into urban spaces.
(6) Changes in Unused Land: Unused land in the study area, primarily consisting of deserts and wastelands [44], saw a decrease of 441.12 square kilometers, resulting in a change rate of -0.40%. Notably, the reduction in unused land was concentrated around oasis cities, with the main transformation types being Farmland and Grassland. Human activities and precipitation were the dominant factors influencing these changes.
Analysis of Changes in Land Use Types
In this study, we used Arcgis software to calculate the land use type transfer data, and generated land use transfer matrix through Excel table to analyze the land use type changes in Kashgar region from 2001 to 2020, which was analyzed by the chart (Table.5): (1) 2001- 2010 period, the biggest changes in the land use type are cropland, grassland and water body, of which cropland is the land use transfer in the area, a total of 853.39 km2, grassland and water bodies are land use transfer out of the area, a total of 523.42 km2 and 234.71 km2. (2) During 2010-2015, the biggest change in land use transfer in area is farmland and building land, respectively 2008.98 and 126.19, and the biggest change in land use transfer out area is Grassland & Unused Land, 1790.05 and 306.32, respectively. (3) During the period 2015-2020, the change in land use types is relatively flat, with smaller magnitudes of transfer-in and transfer-out types. (4) During the period of 2001-2020, the land use types transferred into the state are farmland and building land, of which the largest area transferred into is farmland, accounting for 46.19% of the total area of land use transfers, and the land use types transferred out of the state are forestland, grassland, water bodies, and unused land, and the largest area of land use transfers out of the state is grassland, followed by unused land, which accounted for 46.19% of the total area of land use transfers, respectively 37.65% and 7.11% respectively.
Impact of Land Use on Vegetation NPP
In this study, we used the distribution map of the mean values of vegetation NPP for 20 consecutive years and the land use status map to extract the NPP values of different land use types in the study area by ENVI software. The order of the mean values of vegetation NPP for 20 consecutive years in ascending order was forestland (31.3 gC.m-2) > grassland (28.5 gC.m-2) > farmland (23.4 gC.m-2) > unused land ( 1.6 gC.m-2), the NPP distribution of water bodies and built-up areas was eliminated in the study, and the highest net primary productivity of vegetation in Kashi was forest land, followed by grassland, and finally farmland and unused land, but the most land use types transferred out of the study area during the study time period were forestland and grassland, which accounted for 38.94% of the total area of land use transfers, and the most area transferred in was farmland, which accounted for 46.19% of the total area of land use transfer. Calculated from Table.6, the vegetation NPP decreased by a total of 2748.3 TgC during the period of 2001-2020, and the study area shows a decreasing trend in the value of vegetation NPP in the future period.
Table 5.
Kashi Land Use Transfer Matrix 2001-2020(km2)
Discussion
The Response of Vegetation NPP to the Natural Environment
This study examines the response of vegetation Net Primary Productivity (NPP), an important indicator for measuring vegetation growth and carbon sequestration capacity, to changes in both the natural environment and human activities. The research explores the response of vegetation NPP in the context of climate change and land use change. Through a correlation analysis of vegetation NPP with temperature and precipitation in the study area, it was observed that approximately 54.9% of the total area showed a positive correlation with precipitation, mainly distributed along the Yarkant River and Kashgar River basins. Additionally, the southern part of the study area, including the Pamir Plateau and Karakoram Mountains, acts as a barrier to the warm, moist airflows from the Indian Ocean, resulting in a perennial arid climate in the eastern Taklamakan Desert. The northwestern regions received relatively more precipitation, and the oasis cities in the western part of the study area exhibited a favorable trend in vegetation NPP. It is important to note that in arid regions, water resources play a significant role in influencing NPP. This aligns with the findings of Feng Xiao [45] and others regarding the factors affecting vegetation Net Primary Productivity during the process of desertification reversal in Yulin City. Furthermore, the study area also showed a positive correlation between vegetation NPP and temperature, covering approximately 40.9% of the total area. Significant positive correlation between NPP and both temperature and precipitation were observed in large areas of the southern Pamir Plateau. Warm, moist airflows have a promoting effect on vegetation NPP in high-latitude regions, consistent with the results of studies by Liu Jie [46] and others regarding the driving factors of vegetation Net Primary Productivity in high-latitude regions.
The Response of Vegetation NPP to Land Use
Human activities can either promote or inhibit vegetation Net Primary Productivity (NPP). The Tarim Basin, to which the Kashi region belongs, represents one of the driest areas in China. Vegetation along the riverbanks is predominantly dominated by poplar forests, while desert vegetation mainly comprises drought-resistant and salt-tolerant plant species [32, 47]. According to calculations by Xu Haiyang and others [48] on the production capacity of vegetation NPP per unit area in terrestrial ecosystems in China, forest NPP per unit area has the highest estimated value. Starting in 2015, the Kashi region Water Resources Bureau established ecological water conveyance goals for poplar forests in the Yarkant River basin, playing a significant role in the restoration of poplar forests on both sides of the Yarkant River basin [49]. In the western towns of the Kashi region, including Kashi City, Shule County, and Shufu County, where precipitation is relatively abundant and there is a higher population density (with a total population of 1.3 million, accounting for 33.3% of the Kashi region’s total population), urbanization has been rapidly progressing in recent years. While some Woodland has been converted into urban land, the Farmland area on the outskirts of these cities has seen significant expansion (NPP of Grassland > NPP of Farmland) [50]. Over the past two decades, Farmland area has increased by 2,868 square kilometers, effectively enhancing vegetation NPP. However, the proportion of desert land is substantial, accounting for 32% of the total area. In recent years, rising temperatures and insufficient precipitation have led to severe vegetation degradation in desert areas [51], causing an overall downward trend in vegetation NPP in the Kashi region.
Limitations of the Study
This study employs the CASA model to estimate vegetation NPP, using parameters extracted from remote sensing satellite data and data collected from local weather stations. While this approach is expected to improve the accuracy of NPP estimation, further validation is needed. Furthermore, the study takes a two-pronged approach, quantitatively analyzing the impact of both natural environmental changes and land use changes on vegetation NPP. However, the specific contribution analysis of these two factors to NPP impact could be further refined for a more comprehensive understanding.
Conclusions
This study utilized a variety of remote sensing satellite data, including MOD13A1/Q1, MOD09A1, MOD17A3, to estimate vegetation NPP in the Kashi region over the past two decades using the CASA model. Trend analysis and significance testing were conducted using the Sen+MK method. Annual temperature and precipitation data from ten meteorological stations in the Kashi region were interpolated in ArcGIS, and the correlation between climate factors and NPP was analyzed at the pixel level. Additionally, 30m resolution Landsat satellite data for four periods were used to analyze the relationship between vegetation NPP and land use changes. The findings are summarized as follows:
(1) Over the past two decades, vegetation NPP in the Kashi region exhibited an overall trend of an initial increase followed by a subsequent decrease. From 2001 to 2015, NPP showed an increasing trend with a growth rate of 0.303. However, from 2016 to 2020, NPP exhibited a declining trend with a decrease rate of -0.202. Areas with higher NPP were predominantly located in the central and western regions of the study area, along the Yarkant River and Kashgar River basins.
(2) Through trend analysis and significance testing using the Sen+MK method, it was observed that 37% of the total area showed a significant increase in NPP, while 73% exhibited a significant decrease. Based on the distribution of significance testing, areas with a significant increase in NPP were concentrated in the Yarkant River and Kashgar River basins, with some regions in the Pamir Plateau also showing a significant increase in NPP. Water resources played a promoting role in NPP.
(3) Precipitation in the Kashi region exhibited a stronger correlation with NPP compared to temperature (54.7% > 40.9%). The southwestern Pamir Plateau showed a positive correlation with both temperature and precipitation, indicating that warm, moist airflows have a promoting effect on NPP in high-latitude regions.
(4) Analyzing the relationship between vegetation NPP and land use changes revealed that Grassland area in the study area degraded rapidly over the past two decades, with a change rate of -2.1%. The largest increase was observed in Farmland area, with a change rate of 2.7%. Farmland expansion was primarily at the expense of Grassland area. The vegetation NPP decreased by a total of 2748.3 TgC during the period of 2001-2020, and the study area shows a decreasing trend in the value of vegetation NPP in the future period.
In summary, the availability of water resources in the study area plays a crucial role in promoting the increase in vegetation NPP. Human activities in recent years have also had a positive impact on NPP. In the future urban planning and allocation process for the study area, two key aspects should be considered: 1. In regions with relatively abundant water resources, it is important to strengthen the role of human activities. Urban areas should strictly prohibit indiscriminate logging of poplar forests when expanding urban land. Ecological water conveyance projects on both sides of the Kashgar River and Yarkant River basins should be maintained. Favorable policies should continue to be implemented in the outskirts of cities for reclamation of barren land. 2. The eastern desert region falls within the desert ecosystem, where surface vegetation is sparse, and climate factors have a dominant impact on vegetation NPP. To mitigate water scarcity and reduce wind erosion, surface vegetation can be significantly improved. By addressing these two aspects, the region can work toward enhancing vegetation NPP and achieving a sustainable balance between human activities, water resources, and ecological preservation.

