


Introduction
Peat water, found in peatland areas, refers to unprocessed water with distinct characteristics, including its blackish brown color, high pH levels ranging from 2.5 to 3.5, and varying concentrations of organic compounds, non-organic compounds, and microbes, depending on its location. Due to these characteristics, peat water is unsuitable for direct use in various applications, including consumption [1,2]. Direct utilization of peat water without appropriate treatment can lead to various health issues, hence necessitating the implementation of specialized treatment processes. Several studies have been conducted to convert peat water into clean water utilizing methods such as neutralization, aeration, coagulation-flocculation, and filtration. However, it is worth noting that these studies have primarily been focused on the filtration process [3–7]].
Filtration, as a water treatment technique, involves the separation of particles present in water by directing them through a porous medium or membrane. This process enables the removal of particles from the water [8]. Long-term use of filter cartridges can lead to a decrease in their performance effectiveness, as indicated by the changes in their color and reduced water flow [9]. Additionally, higher pressure exerted on the filter can cause particle attachment and subsequent dissolution into the filter output [10]. Increased pressure in the filter cartridge also results in higher energy consumption [11]. Therefore, proper maintenance of the filter cartridge is crucial to ensuring that the filtration process meets clean water standards. Reflecting on past literature, the issues are pointing out cartridge condition and energy consumption. This indicates the essential implementation of a decision support system. This system will optimize the filtration process, adhering to clean water standards, and is suitable for peat water condition in South Kalimantan [12,13] and minimizing energy usage. The development of a portable South Kalimantan peat water treatment solar-powered will incorporate filtration technology consisting of 4 items, including 10” membrane water filters, ultrafiltration, DC Pump, and powered by solar power, to then experiment on peat water in South Kalimantan. The prototype, depicted in Fig 1, serves as the foundation of a decision support system for cartridge maintenance and energy optimization.
One method that can be used to build a support system is the fuzzy method [14] used in various studies [15–17]. One similar study [18] created a filter washing decision support system using the fuzzy mamdani method based on the variables of filtration age, water turbidity, and reservoir level. These variables were tested by comparing MATLAB calculations and PDAM datasets.
In this research, the filter cartridge maintenance decision support system uses the fuzzy Sugeno method on the variables of turbidity, TDS (Total Dissolved Solids), and filtration pressure. Past researchers have implemented the fuzzy system into a microcontroller system [19,20]. The microcontroller system will regulate pump automation (on-off) according to filter conditions based on changes in variables read using turbidity sensors, TDS sensors, and pressure sensors. This process will provide real-time decisions on the condition of the filter during the filtration process. Implementing a decision support system will lead to the usage of the fuzzy method in the microcontroller system. The Sugeno method was chosen as it is very suitable for water pump actuators, and has an on-off mechanism. Meanwhile, the use of fuzzy Sugeno will produce a faster response [21]. According to Farmadi and Muliadi [20], the Sugeno method is suitable for microcontrollers as it is easier for making decisions, leading to simpler code writing that is easier on microcontrollers that have limited memory.
Based on the explanation above, we propose a membrane filter maintenance decision support system for the portable smart water treatment prototype for peat water in South Kalimantan. It will use the Fuzzy Inference System Takagi-Sugeno-Kang method with turbidity, TDS, and pressure variables on a microcontroller system. The results of decisions from this decision support system will be compared with the results of decision values based on simulation design in MATLAB software. So, the results of the accuracy values become a reference that the Tagakagi-Sugeno-Kang Fuzzy Inference System can use as a decision support system in automating peat water membrane filter replacement warnings.
Research Method
Takagi-Sugeno-Kang Fuzzy Inference System Design
This fuzzy system is designed using 3 input variables, namely turbidity, TDS, and pressure, as well as an output variable, namely filter condition. The output variable will be used as a parameter in the decision support system for the portable smart water treatment prototype for peat water using the Takagi-Sugeno-Kang Fuzzy Inference System. The following is the formation of the set of each variable, created by MATLAB. This variable set is based on the Minister of Health of the Republic of Indonesia, 2010. The results will be compared between the rule sets from MATLAB simulation and Arduino programming. The following fuzzy rules are used.
Fig 2 is a turbidity membership set with three linguistic variables: (1) clear with a range of [0 – 10], (2) intermediate Turbid [5 – 30] and (3) turbid [25 – >30]. The membership degree functions of Turbidity variable to the three levels in the evaluation set are (1)~(3):
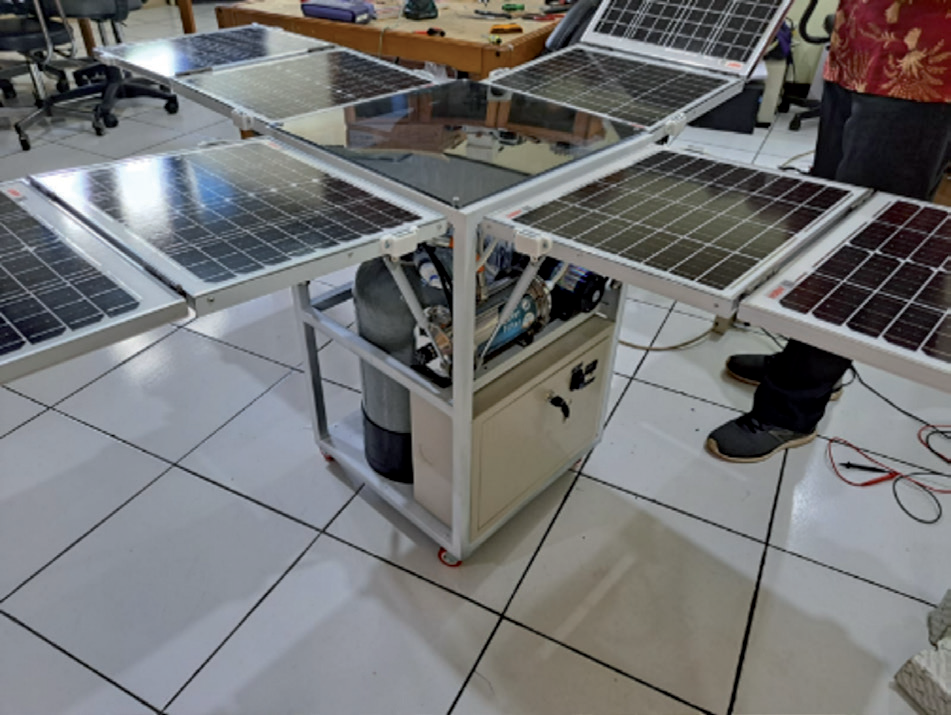
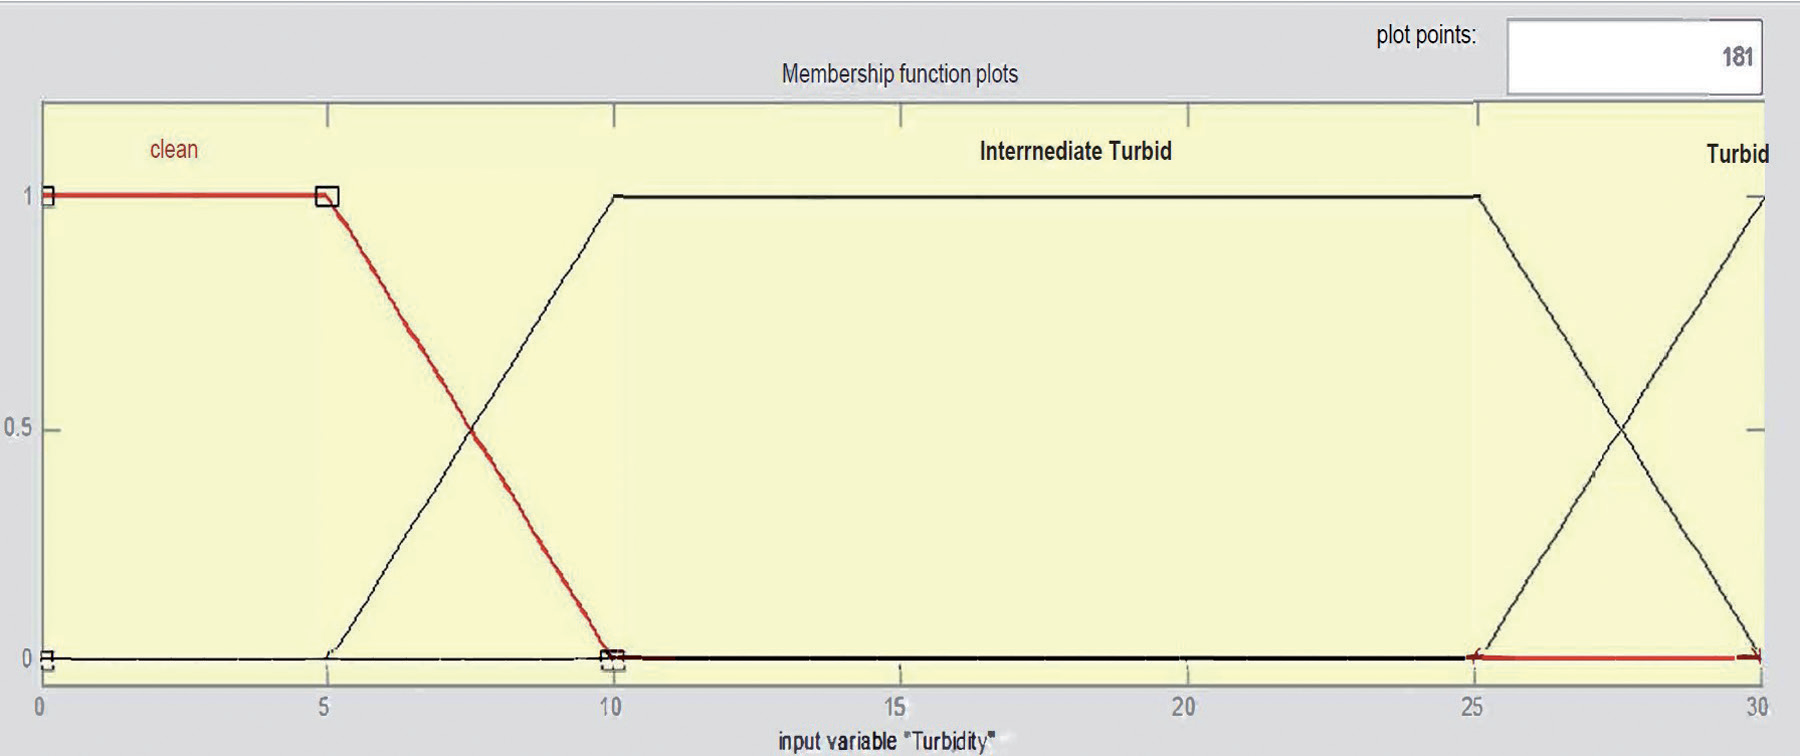
Fig 3 is the TDS membership set with three linguistic variables:(1) good with the range [0 – 500], (2) intermediate [300 – 1000], (3) and not good [900 – >1000]. The membership degree functions of TDS variable to the three levels in the evaluation set are (4)~(6):
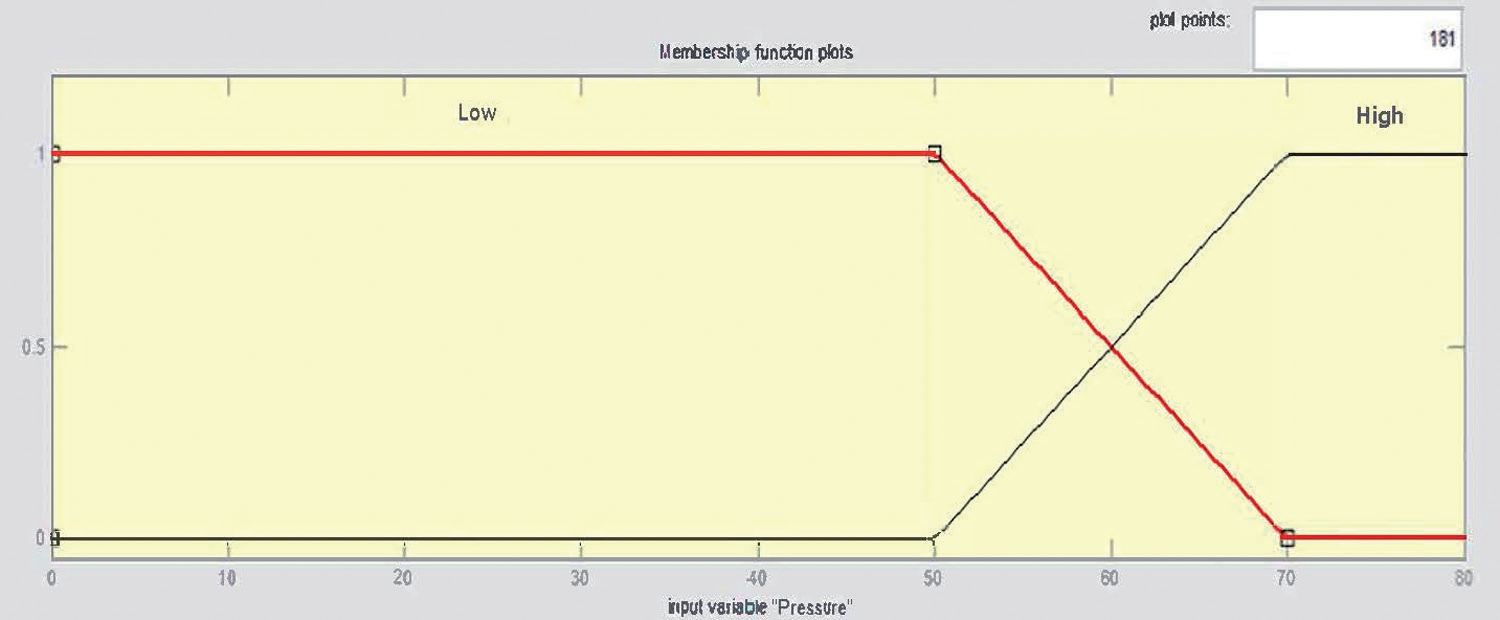
Fig 4 is a set of pressure memberships with two linguistic variables, namely low with a range of [0 – 70] and high [50 – 80]. The membership degree functions of Pressure variable to the two levels in the evaluation set are (7)~(9):
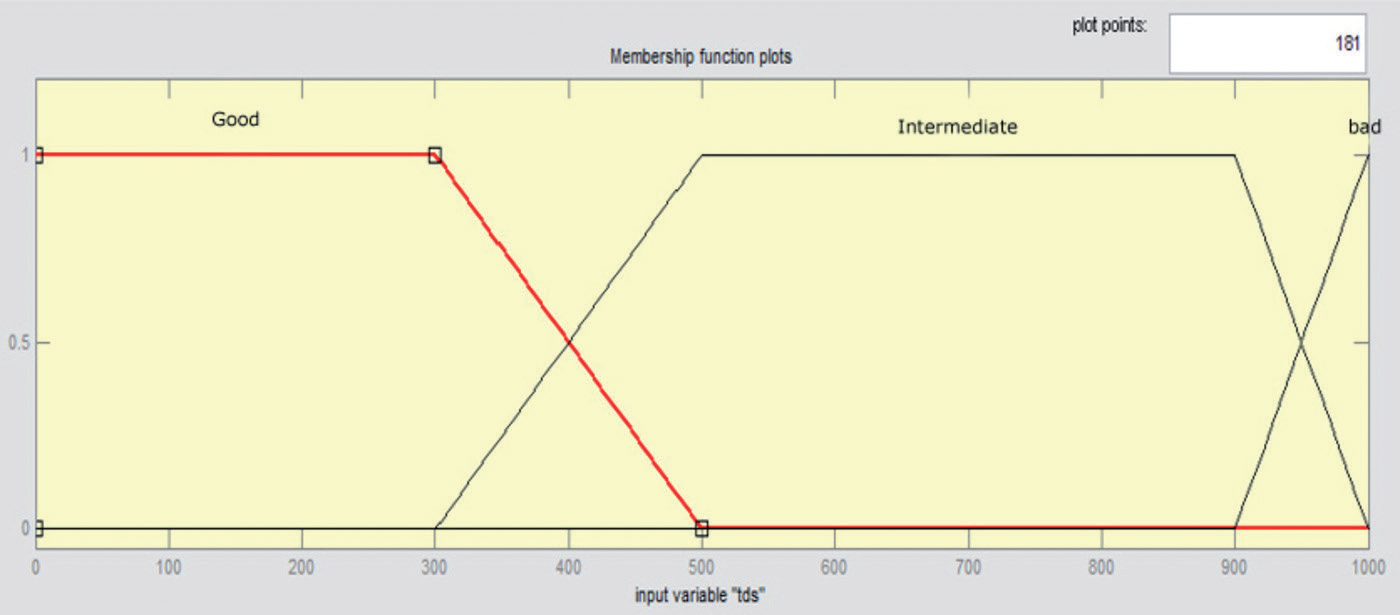
Fig 5 is the value for fuzzy output, with a clean value equal to 0, an intermediate dirty value equal to 0.5, and a dirty value of 1. The Takagi-Sugeno-Kang model uses a singleton membership function, so it does not produce a gray area, but only a piece of bar for any value in the output. Inference engine in determining the decision of membrane condition acceptance using the input variables of turbidity, TDS, and pressure. Inference engine in this system consisted of 18 rules. Then, the rule formation based on this rule, like as IF antecedent THEN consequent [23].
The following are the fuzzy rules used in this research. The formation of fuzzy rules is based on the variables used; 18 rules according to the changing conditions of each variable. The fuzzy rules are shown in table 1.
Microcontroller System Design
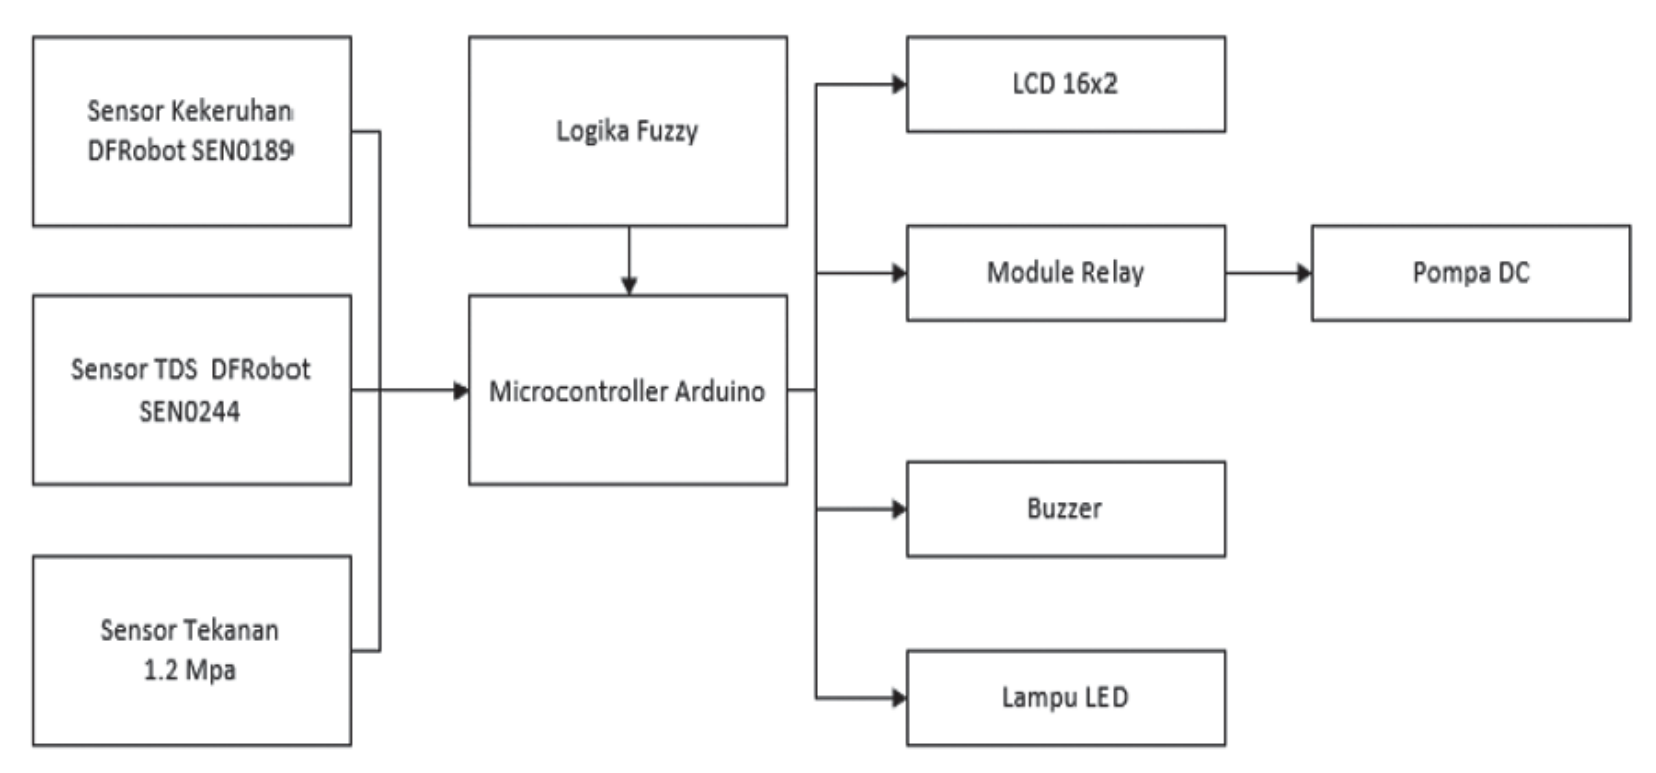
The membrane filter maintenance decision support system is designed on a microcontroller. The components and design of a microcontroller-based membrane filter maintenance decision support system can be seen in fig 6.
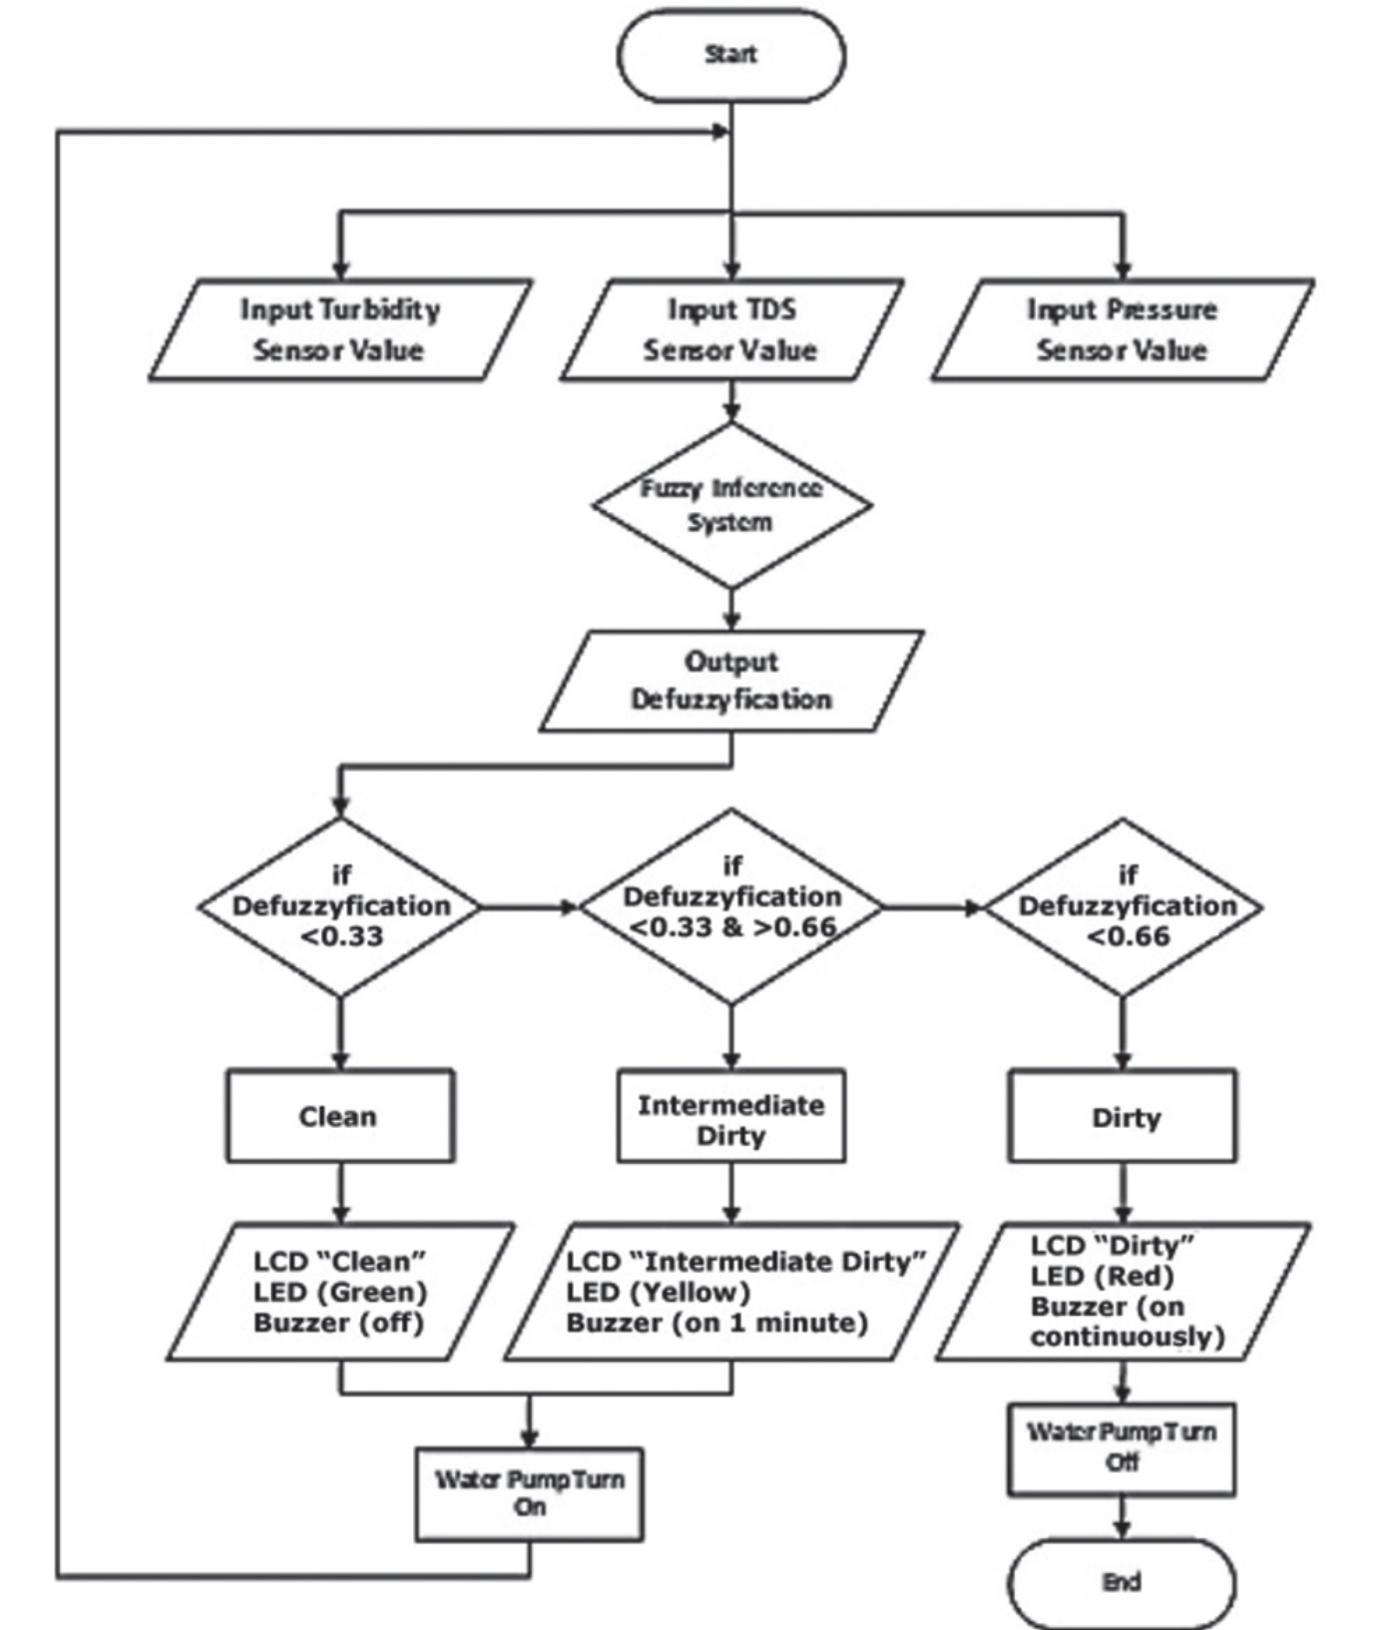
The results of this research are used as decision support in determining the condition of the filter media. The results help in determining the right time to carry out maintenance on the filtration media. The pressure sensor reads the pressure value of the water flow in the filter media, making the water that has been filtered in the protector read by the turbidity sensor and the TDS sensor. The values from the sensor are later processed by Sugeno fuzzy logic, which has been implemented in the microcontroller system. This will produce defuzzification values to determine the condition of the filter (0=clean, 0.5=intermediate dirty, and 1=dirty). If the filter is indicated to be dirty, the system will turn off the pump actuator so that maintenance can be carried out on the filter media. The flowchart of the filter cartridge maintenance decision support system is shown in fig 7.
Tab. 1.
Formation of Fuzzy Rules
Data analysis
The stages of data analysis of this research are as follows:
1. Analyze data requirements. The data used in this research is turbidity, TDS, and pressure data as a reference for forming variables in the designed decision support system. Turbidity and TDS data refer to [12,13], while pressure data refer to [24].
2. Design a decision support system as a variable test using the PDAM (regional drinking water provider) dataset using the Takagi-Sugeno-Kang Fuzzy Inference System method based on predetermined variables. The design was carried out using MATLAB software.
3. Test the accuracy of turbidity, TDS, and pressure sensor readings. Testing is carried out by comparing sensor readings with standard test equipment.
4. Testing the design of a microcontroller-based decision support system directly on the filtration process.
5. Compare the microcontroller and Matlab systems. The comparison was carried out using the MAPE method to determine the accuracy of implementing the fuzzy system on the microcontroller system [25].
Result And Discussion
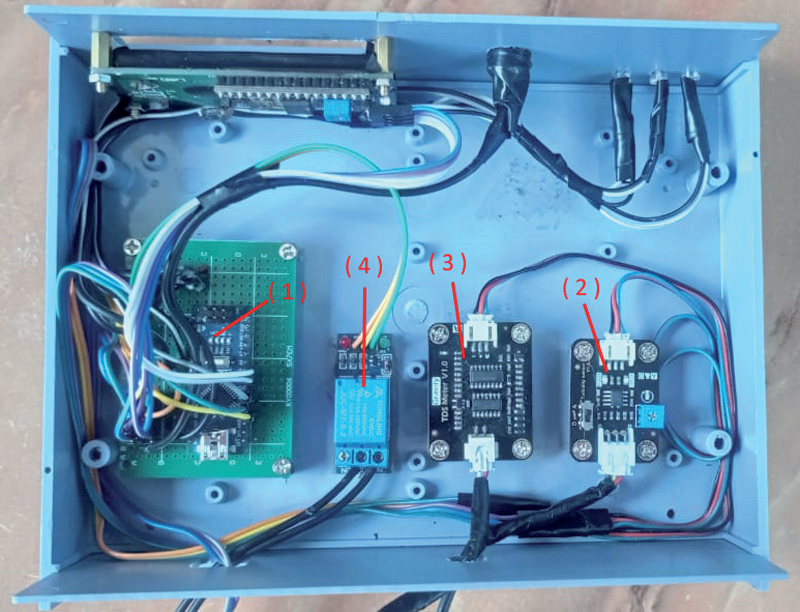
The series of microcontroller-based decision support systems is based on the design in Figure 6. The microcontroller system will collect data on turbidity and TDS from filtration results, as well as filtration pressure with a pressure sensor. The components consist of Arduino Nano as the core component, a Turbidity Sensor Board, TDS Sensor Board and, Relay Module, 16x2 LCD, Buzzer and light LED. It is also added with a Turbidity Sensor Probe; a TDS Sensor Probe that has been designed in such a way that it is placed in the reservoir to read the turbidity and TDS values from filtration results. The process towards the reservoir includes filtration results storage, Water Filter Components, and Pressure Sensors to read the filtration pressure value as output from the microcontroller system. This will indicate the condition of the filter during the filtration process. DC pump is an actuator in this microcontroller system design and used an adapter to power the DC pump.
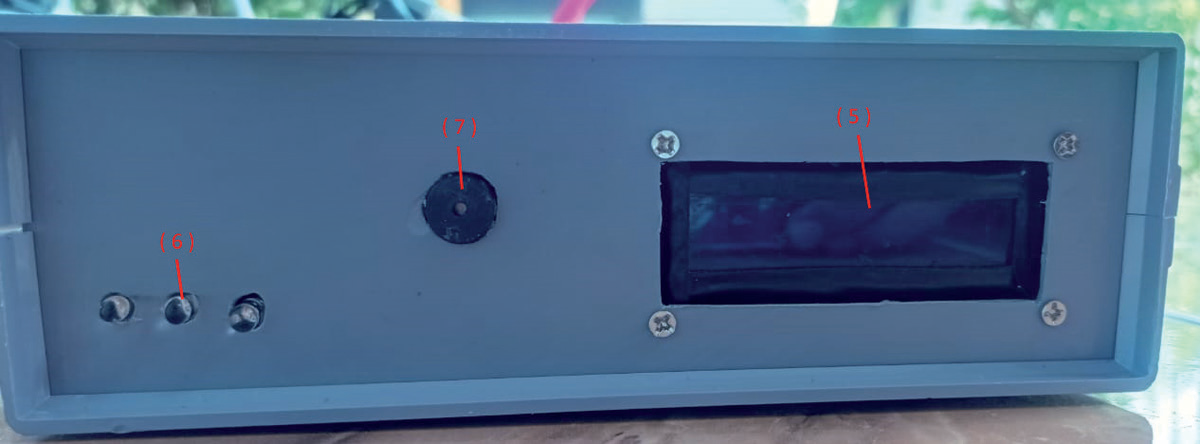
The components of the microcontroller system in Figure 8 consist of (1) Arduino Nano as the core component, (2) Turbidity Sensor Board, (3) TDS Sensor Board, and (4) Relay Module. The components of the microcontroller system in Figure 9 consist of (5) LCD 16x2, (6) Buzzer, and (7) LED as outputs of the microcontroller system to indicate the state of the filter during the filtration process.
The Turbidity Sensor and TDS sensor were calibrated with standard tools. The turbidity sensor reading test was carried out by comparing the sensor readings with a standard Turbidity Meter model AMT21 turbidity tester. The test functions by comparing the readings of the turbidity sensor and the calibrated turbidity meter AMT21, with 7 test data obtained a MAPE value of 11.85% or an accuracy of 88.15%. The TDS sensor reading test was carried out by comparing the sensor readings with a standard TDS meter. The test results were obtained by comparing the TDS sensor readings and the calibrated TDS Meter, from 10 test data obtained a MAPE value of 2.68% or an accuracy of 97.32%.
Testing of the membrane filter maintenance decision support system implemented in the microcontroller system was carried out under running filtration conditions. The test was repeated 44 times, with a time of 3 hours for each filtration process. According to the tests, the microcontroller system showed that the filter condition was clean until the 39th. In this condition, the smart water treatment shows the text “clean” on the 16x2 LCD, and the light LED green turns on. In the 40th condition, the microcontroller system showed a change in the condition of the filter, which became quite dirty. In this condition, the smart water treatment shows the text “quite dirty” on the 16x2 LCD, the light LED green turns off and the light LED yellow turns on.
During the last condition, the 44th condition, the system detects a change in the condition of the filter, as it becomes dirty, At this stage, the filtration process stopped, and the smart water treatment showed the text “dirty” on the 16x2 LCD. Then, the light LED yellow turned off and the light LED red turned on. The microcontroller system is controlling the relay module to cut off the pump actuator current that supplies water to the filtration system so that it can carry out maintenance on the filter media before it is reused.
The results of the tests that have been carried out are shown in Table 2.
Based on the test results presented in Table 4, the implementation of a decision support system on a microcontroller can provide decisions on the condition of the filter from clean to dirty according to the increase in turbidity parameters, TDS, and pressure in the filtration process.
The process of testing the implementation of the Takagi-Sugeno-Kang Fuzzy Inference System on the microcontroller system, which was carried out, resulted in 83 changes in defuzzification values. This value was then used to test the accuracy of implementing the fuzzy system on the microcontroller. Testing was carried out by comparing fuzzy calculations on the microcontroller and calculations in MATLAB. The results of the comparison of microcontroller system calculations and MATLAB calculations are according to Table 3.
The comparison results of the implementation of the Fuzzy Inference System Takagi-Sugeno-Kang decision support system on a microcontroller with MATLAB calculations obtained an accuracy value of 96.47%.
Conclusions
The results of the research show that the portable smart water treatment prototype for peat water in South Kalimantan can implement a membrane filter maintenance decision support system with the Fuzzy Inference System Takagi-Sugeno-Kang method with turbidity, TDS, and pressure variables on a microcontroller system. The use of turbidity sensors and TDS sensors obtained reading accuracy of 88.15% and 97.32%, respectively. For the pressure sensor used, the test pressure results in neutral conditions are at a value of 0 psi, and in dead-end filter conditions it is 80 psi. The implementation of the Takagi-Sugeno-Kang Fuzzy Inference System decision support system on the designed microcontroller system has succeeded in providing membrane filter state decisions. The system can show indicators in 16x2 LCD text reporting “clean” and light LED green turn on when the filter is in clean condition; 16x2 LCD shows the text “quite dirty” and light LED yellow turn on when the filter is in quite dirty condition; and 16x2 LCD shows the text “dirty”, light LED red turn on, and the pump turned off when the filter is in dirty condition, ready to change the membrane filter from the filter housing. The results of tests that compared microcontroller system readings and MATLAB calculations of 83 data changes using filtration resulted in an accuracy of 96.47%. So, the results of the accuracy values show that it can develop a water membrane filter replacement warning system with the fuzzy inference Takagi-Sugeno-Kang system using a turbidity sensor, TDS sensor, and pressure sensor.
Tab 2.
Microcontroller Implementation Test Results
Tab. 3.
Comparison Results of Microcontroller Defuzzification and MATLAB

