

Introduction
Vegetation net primary productivity (NPP)is the amount of energy that green plants capture through photosynthesis per unit area over a specific period, subtracting the energy used for their respiration [1]. In comparison to other measurable elements of the carbon budget, NPP has a higher number of accurately estimated parameters. It is widely recognized as a significant part of the terrestrial carbon cycle [2]. Additionally, NPP plays a critical role in regulating ecological processes and serves as an important indicator for identifyingcarbon sources and sinks [3]. Due to the complexity of ecosystems, NPP is influenced by a variety of factors, including vegetation dynamics, geomorphologic distribution, climatic change, and anthropogenic activity [4-6]. The vegetation growth environment is complicated and varied due to the common changes and interactions of various elements over time and in space. Furthermore, the variety and complexity of ecological resource distribution across regions result in significant spatial and temporal heterogeneity in the impact of many factors affecting NPP [7, 8]. The spatial and temporal variations are likely to result in divergent outcomes. For instance, changes in plant species composition due to climate change may stabilize NPP in high-elevation ecosystems [9], while increasing droughts can diminish NPP [10]. Urbanization may directly impede vegetation production [11], but urban heat islands and urban ecological construction can partially counteract the negative effects of urbanization [12]. Therefore, an in-depth study of the complex relationship between NPP and natural and anthropogenic factors can help us understand its influencing factors more comprehensively. Therefore, gaining a deep understanding of the complex relationship between NPP and natural as well as anthropogenic factors in spatiotemporal variations and examining the various components that exert influence helps establish a scientific foundation for the development of efficient solutions aimed at achieving carbon neutrality.
Presently, numerous researchers have discussed the correlation between NPP and various factors from diverse viewpoints, including climate, vegetation phenology, and urbanization. However, the spatial and temporal heterogeneity in the relationship between NPP and these influencing factors exhibits significant variation across different regions [13]. In recent years, most studies on the effects of natural conditions on NPP have focused on factors such as climate, topography, and vegetation conditions, and the spatial and temporal differences in these factors have led to different findings. First, climate is the main factor that affects NPP changes. For example, Chen et al. [14] found that solar radiation, temperature, and precipitation are key variables affecting carbon fluxes in ecosystems. Variations in climatic conditions across different locations have distinct impacts on the growth and distribution of vegetation. Liu et al. [15], taking into account the lag effect of climate conditions on NPP, found that precipitation is the primary constraining element for the increase of NPP in the transition zone between semi-arid temperate forests and grasslands. However, in cold, high-altitude areas such as the Jogail Plateau, the effect of temperature on NPP may be more significant [16]. In addition, different subsurface characteristics (e.g., topography, slope) also have an indirect effect on climate conditions, which in turn affects the regional distribution of NPP. Zhao et al. [17] found that warmer temperatures in the Qinba mountainous region of China adversely affected the middle and lower Qinling Mountains, but favorably increased NPP in the higher elevations of the Daba Mountains. The vegetation type itself is also a key factor influencing the spatial differentiation of NPP. Different types of vegetation have different growth characteristics and adaptive capacities. For example, Xin et al. [18] found that over the years, the average NPP of broadleaf forests in the Haihe River Basin of China was higher than that of other vegetation.
Meanwhile, due to the influence and damage of anthropogenic activities on the ecological environment, anthropogenic factors have increasingly become more significant in affecting NPP, even surpassing natural factors in certain regions [19]. Among them, land use change is the most direct signal of the impact of anthropogenic activities on terrestrial ecosystems [20]. Remote sensing technology provides support for land use in the monitoring of environmental change [21- 23]. Changes in land patterns can directly impact NPP by altering surface structures and indirectly affect NPP alterations by modifying the structure and function of ecosystems [20, 24]. These changes can have both positive and negative impacts, thus enhancing the spatial heterogeneity of NPP change drivers. For instance, the execution of the fallow return of farmland to forest and grassland project has improved ecosystem stability and consequently increased NPP in the Yellow River Basin [25]. National ecological protection policies, such as ecological compensation measures and restoration of land cover vegetation, have yielded positive ecological effects in both North China and the Tibetan Plateau [26]. Conversely, the expansion of construction land has led to a decrease in global vegetation cover and ecological function degradation, resulting in reduced NPP [27]. Overgrazing has further disrupted soil structure, impacting the productivity of grasslands in the Ili River Basin of northwestern China [28]. Additionally, anthropogenic activities and climate change have interrelated effects on NPP. Anthropogenic greenhouse gas (GHG) emissions exacerbate climate warming [29], while climate change can amplify the ecological damage caused by anthropogenic activities. These effects vary across time and space. For example, Hu et al. [30] studied future climate and LUCC changes’ impacts on global NPP under different scenarios and highlighted that in 2090-2100, climate change has a significantly positive impact on the northern high latitudes and a notably negative impact on the tropics. Similarly, in 2010-2020, LUCC has shown a negative impact on the northern high latitudes and the northern mid-latitudes, while it has had a positive impact on the tropics and the mid-latitude regions.
In summary, exploring the influencing factors of vegetation NPP from either a temporal or spatial perspective often leads to different conclusions [31]. The main reasons are: (1) Driving factors often have different feedback effects on NPP with changes in spatiotemporal scales. (2) Changes in ecosystem processes have spatial differences and time-lag effects.
(3) Due to the complexity of ecosystems, different factors interact with each other, leading to significant spatial and temporal differences in response to environmental changes. Therefore, when discussing the relationship between NPP and driving factors, the association characteristics of NPP and influencing factors in time and space should not be overlooked. How to quantitatively reveal the driving mechanisms of natural and anthropogenic factors on NPP from both temporal and spatial perspectives, and to explore the spatial continuity of the impacts of key factors on NPP is of great significance for ecosystem sustainable development planning. Taking a comprehensive consideration of the mechanisms and interactions of natural and anthropogenic factors on NPP will be more helpful for us to fully and accurately understand the changing trends and reasons for NPP.
According to the current research methods, the relationship between NPP and influencing factors is usually determined using correlation analysis and regression analysis. While these methods offer a straightforward approach to evaluating the connection between NPP and influencing elements, they can only offer a general depiction of this link, disregarding the spatial and temporal non-stationary nature of NPP and driving factors. To address these issues, GeoDetector can be used to reveal the spatiotemporal differentiation patterns of influencing factors and single and interaction forces [32]. Meanwhile, the GWR model can further analyze the specific effects of these driving factors in different geographical spaces, considering the spatial non-stationarity of the data [33]. By combining both, a more comprehensive demonstration of the complex relationship between NPP and driving factors at temporal and spatial scales can be achieved. Therefore, this study integrates GeoDetector and GWR to better explore the complex impact mechanisms of natural and anthropogenic factors on NPP in time and space.
This study attempts to address the following two questions: (1) What are the primary driving forces of NPP changes: natural factors or human-induced factors?
(2) What characterizes the divergence of the effects of the main drivers on NPP across time and space? To address these questions, this study, based on the spatiotemporal coupling perspective of vegetation NPP, takes Yunnan Province, which has the richest biodiversity in China and the most significant biodiversity globally, as a case study area. After an analysis of the spatiotemporal fluctuations of NPP, this study attempts to determine the correlation between NPP, anthropogenic factors, and natural factors. Following that, it employs GeoDetector to quantitatively assess the effects of natural and anthropogenic variables on NPP at various time intervals and find the primary influencing elements that affect NPP. Finally, key influencing factors at each time period are selected to fit a multi-temporal GWR model, exploring the heterogeneity patterns of their spatiotemporal impacts.
Materials and Methods
Study Area
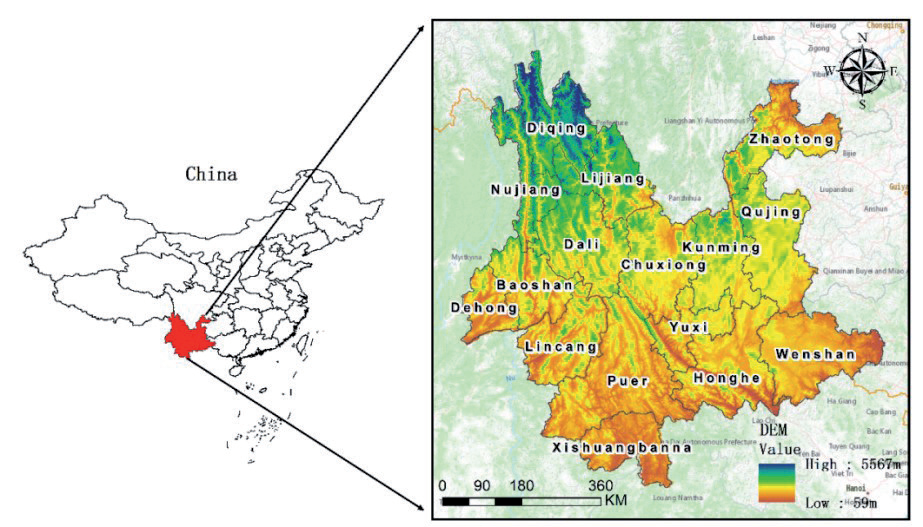
Yunnan Province (21°8′N~29°15′N, 97°31′E~106°11′E) is located in the southwest region of China (Fig. 1), with a total area of 394,100km2. The region is situated in a low-latitude inland area, characterized by higher topography in the northwest and comparatively mild terrain in the southeast. The altitude of the area ranges from 76 m to 6750 m, encompassing the basins of the Yangtze River, Pearl River, Yuan River, Lancang River, Nu River, and Daying River. The climate of Yunnan Province is typically described as a subtropical plateau monsoon climate, including a moderate annual temperature fluctuation, significant daily temperature fluctuations, and a combination of wet and dry conditions. The average annual maximum temperature ranges from 20ºCºC to 23ºC, while the minimum temperature ranges from 7ºC to 11ºC. The distribution of precipitation is quite disparate among seasons and areas, with 85% of the total precipitation taking place between May and October. The precipitation in southern, western, and eastern Yunnan is higher, with certain regions over 2300 mm. In contrast, central and northern Yunnan see comparatively lower precipitation, as little as 547 mm, although most areas receive more than 900mm of annual precipitation. The diverse and complex terrain and climate have endowed the province with abundant mineral resources and a wide variety of biological species, including rainforests, tropical forests, evergreen broad-leaved forests, coniferous forests, shrub meadows, and alpine moss, earning it the reputation of “the Kingdom of Plants”. The complex natural conditions make the research area more representative, and studying the spatiotemporal changes and influencing factors of NPP under different natural conditions is more valuable.
Data Sources
This study collected NPP data, NDVI data, meteorological data, and geographic data. The NPP data (https://lpdaac.usgs.gov/product_search/) was obtained by filling in missing values from the Terra sensor on NASA’s MODIS satellite, with a temporal resolution of 1 year and a spatial resolution of 500 m x 500 m. The NDVI data is from the Qinghai-Tibet Plateau Science Data Center (https://data.tpdc.ac.cn/home), with a temporal resolution of 1 month and a spatial resolution of 250 m. The meteorological data is also from the Qinghai-Tibet Plateau Science Data Center (https:// data.tpdc.ac.cn/home), including monthly data for solar radiation, precipitation, and temperature from 2001 to 2017. The geographic data primarily includes the Digital Elevation Model (DEM) and land use data. The DEM data was acquired from the Geospatial Data Cloud (https://www.gscloud.cn/) at a spatial resolution of 90 m. Subsequently, slope and aspect data were derived from the DEM data using ArcGIS 10.8. The land use data for 2001, 2010, and 2017 was provided by the Chinese Land Cover Data (CLCD, https://zenodo.org/record/5816591), with a spatial resolution of 30m, and the data was reclassified into six land cover types: farmland, forest land, grassland, water, bare land, and construction land. To reduce errors caused by inconsistent coordinate systems and to improve the efficiency of subsequent spatial analysis, all data was uniformly defined with the WGS_84_UTM_zone_47N projection coordinate system and resampled to a resolution of 5 km.
Methods
Correlation Analysis
Correlation analysis is the examination of two or more variables that are correlated in order to quantify the extent of the correlation between the two factors. In this study, Matlab software was used to calculate the correlation coefficient between NPP and vegetation factors and climate factors, and the results were tested by t-test.
The calculation formula for the correlation coefficient is as follows:
Among them, NPPi is the NPP value of the ith year,
In this equation, t is the test statistic; typically when, 0<t<0.05, it is considered to be a significant positive (negative) correlation between NPP and variable y.
Trend Analysis
Theil-Sen trend analysis, also known as Sen’s trend analysis, is a robust non-parametric statistical method for trend analysis proposed by Sen (1968), which is suitable for trend analysis of long time series and multivariate datasets. Compared to the requirement of normal distributions for time series data in linear regression, Sen’s trend analysis has better robustness and stability and can handle outlier and noisy data, making it more suitable for estimating long-term trend values of vegetation changes. The calculation formula is as follows:
In the equation: β represents the interannual change rate of NPP, β>0 indicates an increasing trend in NPP, β<0 indicates a decreasing trend in NPP; NPPj, and NPPi represent the NPP values in the a-th and b-th years, respectively; n represents the length of the time series. The results of the trend analysis are subjected to the MK significance test, where Z is the standard test statistic. When β>0 and |Z|>1.96, it indicates a “significant increase” in trend; when β>0 and |Z|<1.96, it indicates “not a significant increase” in trend; when β<0 and |Z|>1.96, it indicates a “significant decrease” in trend; when β<0 and |Z|<1.96, it indicates “not a significant decrease” in trend.
GeoDetector
The GeoDetector is a collection of statistical techniques used to identify and analyze the spatial variability of geographic phenomena and uncover the underlying factors that contribute to them. Factor detection can analyze the variation in dependent factors across different locations and determine how independent factors contribute to this geographical variation. Interaction detection involves comparing the q-values of single-factor and two-factor overlaid q-values to assess the presence of an interaction between the two components. It also determines the strength, direction, linearity, or non-linearity of the interaction. The q statistic is estimated as follows:
In the equation, q (0≤q≤1) represents the explanatory power of different factors on the dependent variable, where a larger value indicates a stronger explanatory power of the independent variable on the dependent variable; h = 1,..., L represents the partition of variable Y or factor X; Nh, and N are the number of units in stratum h and the whole area, respectively; and σh2 and σ2 are the variances of Y values in stratum h and the entire area, respectively.
Geographically Weighted Regression
In comparison to the traditional Ordinary Least Squares (OLS), which assumes the relationship between the independent and dependent variables to be “homoscedastic”, the Geographically Weighted Regression model adequately considers the non-stationarity of spatial data. It embeds the spatial location of the data into the regression parameters and uses local weighted least squares to estimate parameters point by point, revealing the relationship between the independent and dependent variables. The computation method is as follows:
In the equation, yi represents the value of NPP, xij is the independent variable, and βi and εi respectively represent the intercept and error.
Results
The Temporal and Spatial Evolution of NPP
Spatial Distribution Characteristics of NPP
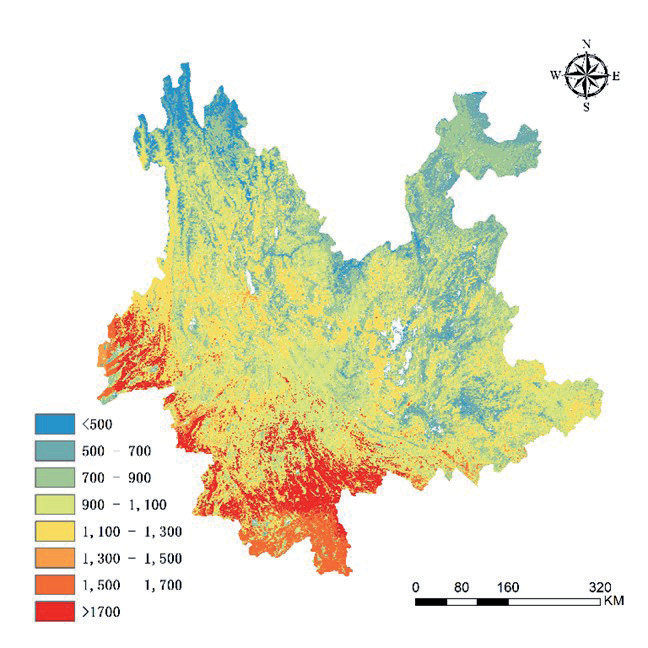
The spatial distribution of NPP in Yunnan Province from 2001 to 2017 (Fig. 2) shows significant regional variations. Overall, it exhibits a low level in the northeast and a high level in the southwest. Specifically, the following aspects are observed: 1) The northern part of Yunnan Province has the lowest NPP, ranging from 500 g C·m-2·a-1 to 900 g C·m-2·a-1 on average, with the lowest values mainly distributed in the northwestern areas such as Diqing and Nujiang. The high-altitude and low-temperature conditions in the northwestern part of the Qinghai-Tibet Plateau have affected vegetation growth, resulting in low NPP levels. 2) The central part of Yunnan Province has relatively low NPP, forming a low-value belt from west to east, with average NPP ranging from 900 g C·m-2·a-1 to 1300 g C·m-2·a-1. Generally, there is a rising pattern of NPP from the eastern to the western regions. The areas with the lowest NPP values are found in the longitudinal valley regions formed by the Jinsha River, Nujiang River, Lancang River, and Dulong River from north to south. Conversely, the areas with the highest NPP values are located in Dehong, where the average value exceeds 1500 g C·m-2·a-1. Dehong belongs to the South Asian monsoon climate, providing favorable water and heat conditions for vegetation growth. 3) The southern part of Yunnan Province has the highest NPP, with an average value exceeding 1300 g C·m-2·a-1, and the highest values are mainly located in the southwestern part of Lincang, Xishuangbanna, and most of Pu’er at altitudes below 1500 m.
The Temporal Variation Characteristics of NPP
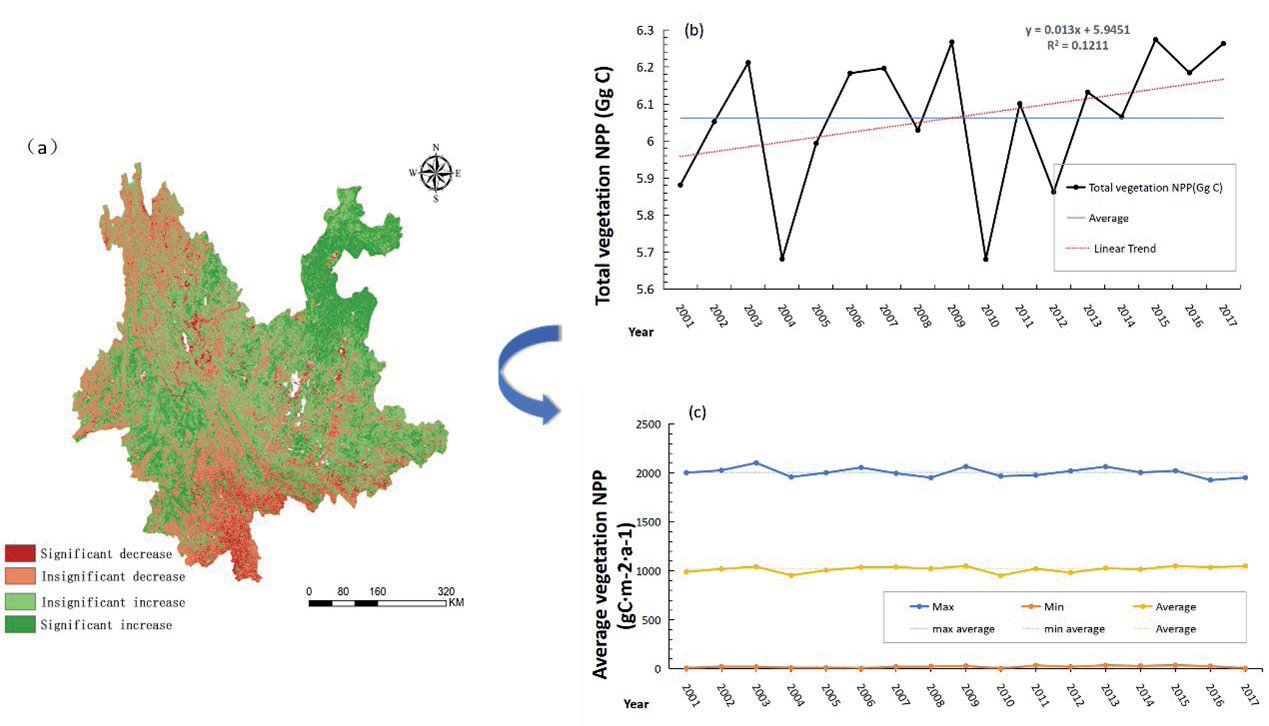
As shown in Fig. 3b), the total amount of NPP in Yunnan province from 2001 to 2017 shows a fluctuating upward trend, with an annual average of 6.06 Gg C. The minimum and maximum values of NPP occurred in 2010 and 2015, at 5.6 Gg C and 6.27 Gg C, respectively. The interannual variation of NPP showed significant lows in 2004 (5.682 Gg C) and 2010 (5.68 Gg C). The fluctuation of NPP in Yunnan province was large from 2001 to 2010, but decreased after 2010 and exhibited an overall increasing trend. To better understand the change in NPP in Yunnan province over the past 17 years, this study also calculated the annual average NPP values for the study area based on pixels (Fig. 2). The range of annual average NPP change was 951.85 g C·m-2·a-1 to 1050.87 g C·m-2·a-1, with the minimum and maximum values occurring in 2010 and 2015. The average maximum value of NPP was 2005.96 g C·m-2·a-1, and the average minimum value was 19.4 g C·m-2·a-1. Additionally, the study found that the maximum, minimum, and average values of NPP showed similar changing trends between adjacent years over the past 17 years.
This study used Sen’s trend analysis and the MK significance test to obtain the spatial distribution map of NPP change in Yunnan province from 2001 to 2017 (Fig. 3a). The results indicate that the area where NPP increased accounts for roughly 62.75% of the total area and is mainly characterized by non-significant increases. The areas with increased NPP are mainly distributed in the northeastern and western parts of Yunnan province, such as Zhaotong, Qujing, Baoshan, and Lincang. The area with a non-significant decrease accounts for approximately 30.26% of the total area and is mainly distributed in the northwest regions of Diqing, Nujiang, Lijiang, and Dehong, as well as in the southern regions dominated by Xishuangbanna and Pu’er. Overall, the increase in NPP in Yunnan province outweighs the decrease, indicating an increasing trend in NPP from 2001 to 2017, consistent with the temporal characteristics of NPP change in the study area.
Influencing Factors of NPP Change
The Correlation Between NPP, NDVI, and Climatic Factors
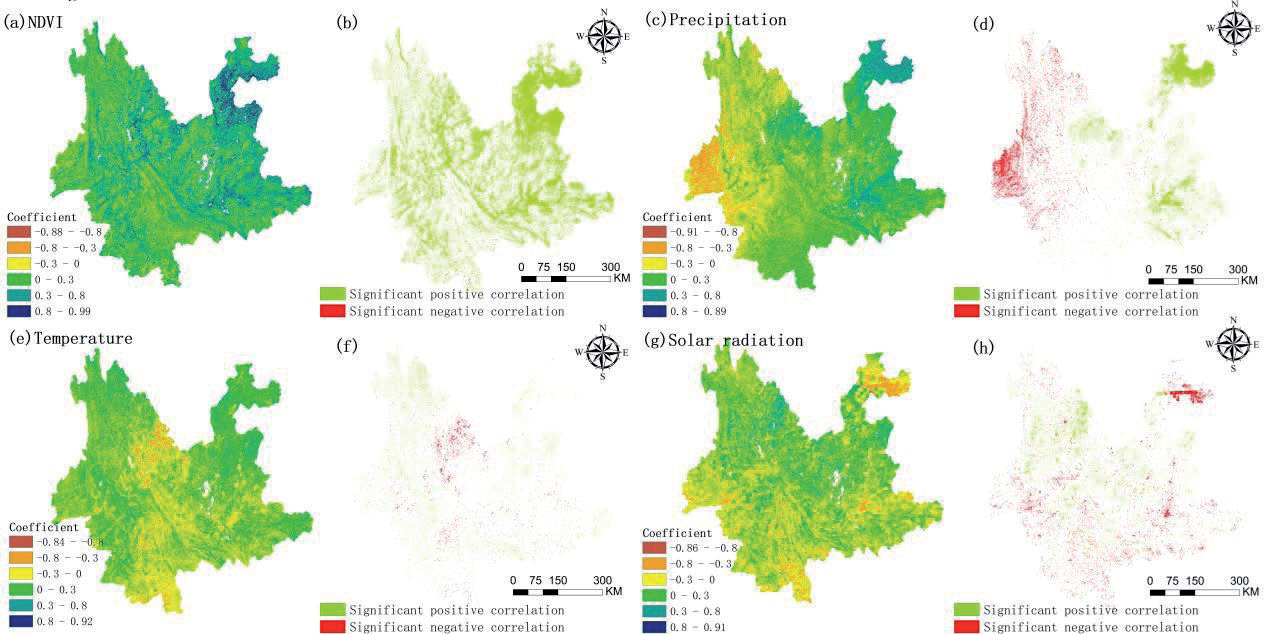
NDVI is an important indicator of vegetation coverage, which has a good indicative role in the yield of NPP [4]. NPP will rise in proportion to the augmentation of vegetation coverage. The results (Fig. 4(a-b)) of the correlation analysis show that the correlation coefficient between NPP and NDVI is between -0.88 and 0.99. Among them, the regions with a correlation coefficient greater than 0 accounts for 83.54% of the total area of Yunnan Province, and those less than 0 accounts for 16.46% of the total area of Yunnan Province, indicating that most of the NPP in Yunnan Province are positively correlated with NDVI. The regions exhibiting a significant correlation (t<0.05) between NPP and NDVI encompass 31.79% of the entire land area of Yunnan Province. These regions are widely dispersed over most parts of Yunnan Province. Out of all the areas analyzed, 31.33% show a significant positive correlation (R>0, t<0.05) between NPP and NDVI, with the highest concentration observed in Zhaotong. On the other hand, only 0.46% of the areas exhibit a significant negative correlation (R<0, t<0.05) between NPP and NDVI, with sporadic distribution across different prefectures and cities.
Fig. 3.
Changes in NPP over time in Yunnan Province, 2001-2017; (a) change in trend; (b) inter-annual change in total NPP; (c) interannual change in the mean, maximum, and minimum values of NPP
Similarly, the correlation analysis of NPP in Yunnan Province and various meteorological factors (precipitation, temperature, solar radiation, Fig. 4(c-h)) shows that the coefficient of correlation between NPP and precipitation is between -0.91 and 0.89, with an average value of 0.045. The regions exhibiting a correlation coefficient exceeding 0 encompass 57.38% of the entire study area. Among these, the areas displaying a significantly positive correlation constitute 6.81% and are primarily concentrated in the eastern section of Yunnan Province. Conversely, the regions with a correlation coefficient below 0 cover 42.62% of the total study area. Within this subset, the significantly negatively correlated areas account for 3.43% and are predominantly found in the western part of Yunnan Province. The correlation coefficient between NPP and temperature in Yunnan Province is between -0.84 and 0.92, with an average value of 0.017. The areas with positively correlated and significantly positively correlated relations account for 53.40% and 2.08% of the total study area, respectively, while the significantly negatively correlated areas account for 1.09%, mainly distributed at the junction of Lijiang, Dali, and Chuxiong, in the central part of Pu’er, and in the southern region of Baoshan. The net primary productivity (NPP) in the research area has a predominantly negative association with sun radiation. The correlation coefficient between solar radiation and NPP ranges from -0.86 to 0.91, with an average value of -0.032. The locations that exhibit a strong negative correlation make up 3.17% of the entire study area, primarily located in the southwestern and northeastern regions of Yunnan Province.
In general, the variation in NPP in Yunnan Province is intricately linked to climate change. Precipitation exerts the most substantial influence on the variation in NPP in Yunnan Province, compared to temperature and solar radiation.
NPP Changes Under Different Terrain Conditions
The research area’s multi-year NPP mean values were evaluated geographically with each terrain factor (altitude, slope, and aspect) to determine the spatial distribution characteristics of vegetation NPP on each terrain factor. The results are depicted in Fig. 5. The investigation revealed that the distribution pattern of vegetation NPP in Yunnan Province demonstrated an initial rise followed by a decline in relation to altitude. Specifically, when the altitude was below 1500 m, the vegetation NPP increased as the altitude increased. However, when the altitude exceeded 1500 m, the vegetation NPP decreased as the altitude increased. NPP reached its peak at an altitude of 1000-1500 m, with a value of 1131.09 g C·m-2·a-1. Conversely, at altitudes beyond 300 0m, the vegetation’s NPP was at its lowest, measuring 715.625 g C·m-2·a-1.
The influence of aspect on NPP is such that the NPP of the shady slope>the NPP of the sunny slope >the NPP of the flat ground. The primary reason for this distribution may be that under the same amount of precipitation, the solar radiation intensity on the shady slope is weaker, resulting in less water evaporation, moist soil, and higher fertility, making the natural conditions better than those on the sunny slope and flat terrain, hence leading to higher NPP.
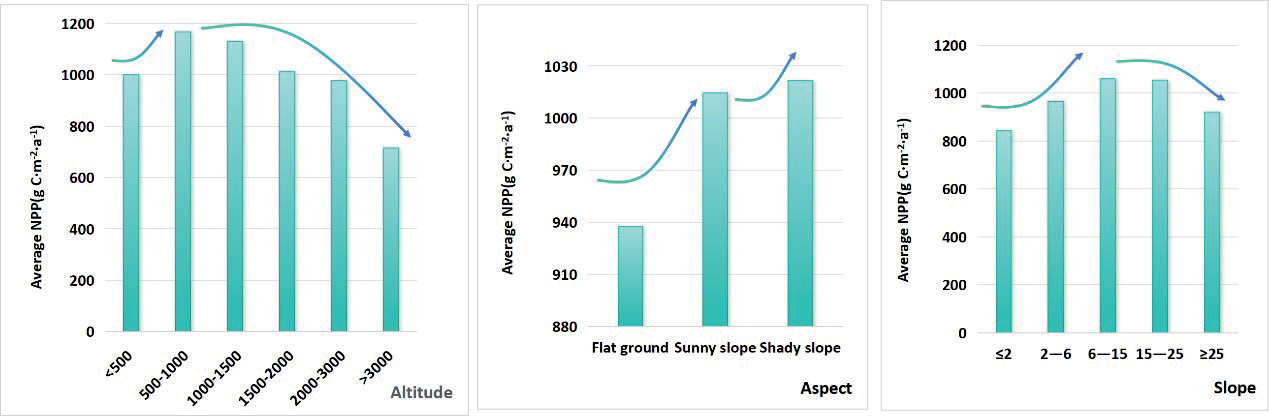
There are also significant differences in NPP corresponding to different slopes, with the average NPP showing a decreasing trend with an increasing slope. The 6-15°slope region in Yunnan Province has the largest proportion, accounting for 41.46%, and belongs to a hillside. The average NPP in this slope range is also the highest at 1059.29 g C·m-2·a-1. For slopes below 15°, NPP shows a progressive increase as the slope increases. Conversely, for slopes over 15°, the NPP declines as the slope grows.
Table 1.
Land use transfer matrix from 2001 to 2010, from 2010 to 2017, and from 2001 to 2017(unit:km2).
NPP Gain and Loss Caused by Land Use Transfer
The land use transfer matrix can reflect the transfer of different land types. The land use transfer matrix between different years in Yunnan Province is shown in Table 1. Forest, farmland, and grassland are the three main types of land use in the study area. Forest conversion is predominantly driven by the transformation of farmland, while farmland conversion primarily arises from the conversion of forest. Additionally, grassland conversion is largely attributed to the previous conversion of both farmland and forest. From 2001 to 2010, the area of farmland converted to forest was the largest, at 8492.56 km2, accounting for 3.05% of the cumulative extent of the study area. The total area of bare land transferred was the smallest, mainly converted to grassland. From 2010 to 2017, the area of forest converted to farmland was the largest, at 19076.81 km2, followed by farmland converted to forest land, at 17150.19 km2. The area converted to forest accounted for 6.37% of the cumulative extent of the study area, and compared to the previous decade, the area of land converted to construction land changed the most, increasing by 26.63%. From 2001 to 2010, the area of forest land converted to farmland was the highest, at 20691.56 km2, and construction land was mainly converted from farmland, with an area of 648.69 km2.
NPP gains and losses caused by changes in land use types are shown in Fig. 6. From 2001 to 2010, the largest total NPP loss caused by the conversion of land use types to water was 121.26kg C·m-2·a-1, followed by the loss due to conversion to construction land. From 2010 to 2017, the highest NPP gain caused by the conversion of land use types to forest was 118 kg C·m-2·a-1, and the gain from farmland was 113.08 kg C·m-2·a-1. It is worth noting that from 2001 to 2010, the conversion of other land types to forest caused a slight decrease in NPP, while from 2010 to 2017, the forest conversion caused a significant increase in NPP. From 2001 to 2010, the conversion of other land types to construction land caused a decrease in NPP, while from 2010 to 2017, the conversion to construction land caused an increase in NPP. Overall, from 2001 to 2017, the highest NPP gain caused by the conversion of all land types to forest was 104.68kg C·m-2·a-1, the highest NPP loss was caused by the conversion to water, and the lowest NPP loss was caused by the conversion to construction land.
Factors Influencing the Spatial Heterogeneity of NPP
GeoDetector Results
The factors affecting NPP were identified through the use of GeoDetector, and the dominant factors were determined. The interaction effects between various factors on the spatial heterogeneity of NPP were also determined. The analysis of factor detection in Fig. 7a) reveals that all factors successfully met the significance test (p<0.01). The primary factor observed in each year was NDVI, with an average explanatory power of roughly 0.46 across the three-year period. The average q values of the factors over the three years were: NDVI (0.46) > Pre (0.32) > Tmp (0.21) > LUCC(0.18) > DEM (0.13) > SR (0.09) > Slope (0.05) > Aspect (0.002). This indicates that NDVI, precipitation, temperature, land use, and elevation were important influencing forces for the variation in NPP from 2001 to 2017 (q>0.1), while solar radiation, slope, and aspect had relatively minor spatial heterogeneity effects on NPP in Yunnan province (q<0.1). It is noteworthy that overall, the q-value change rates for precipitation, aspect, and NDVI were negative, with precipitation showing the largest absolute value of change rate and NDVI the smallest, indicating a decrease in the explanatory power of these three influencing factors for NPP, with precipitation showing a greater fluctuation in q-value compared to NDVI. The q-value change rates for land use, solar radiation, temperature, elevation, and slope were all positive, indicating an enhancement in the explanatory power of these five influencing factors for NPP, with temperature, elevation, and slope showing relatively significant changes, while solar radiation and land use exhibited more stable changes.
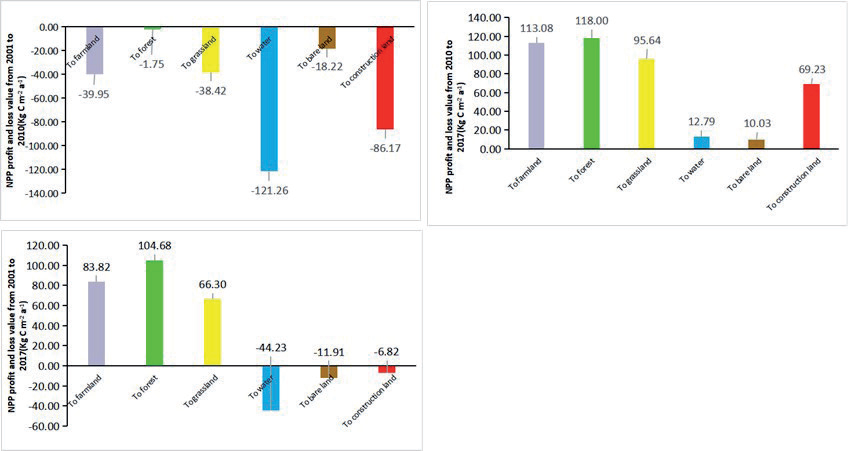
Fig. 7.
GeoDetector results: (a) Factor detector in 2001, 2010, and 2017; (b), (c), (d) Interaction detector between factors in 2001, 2010, and 2017; LUCC-land use; Pre-precipitation; DEM-altitudes; Tmp-temperature; SR-solar radiation; NDVI-vegetation index.
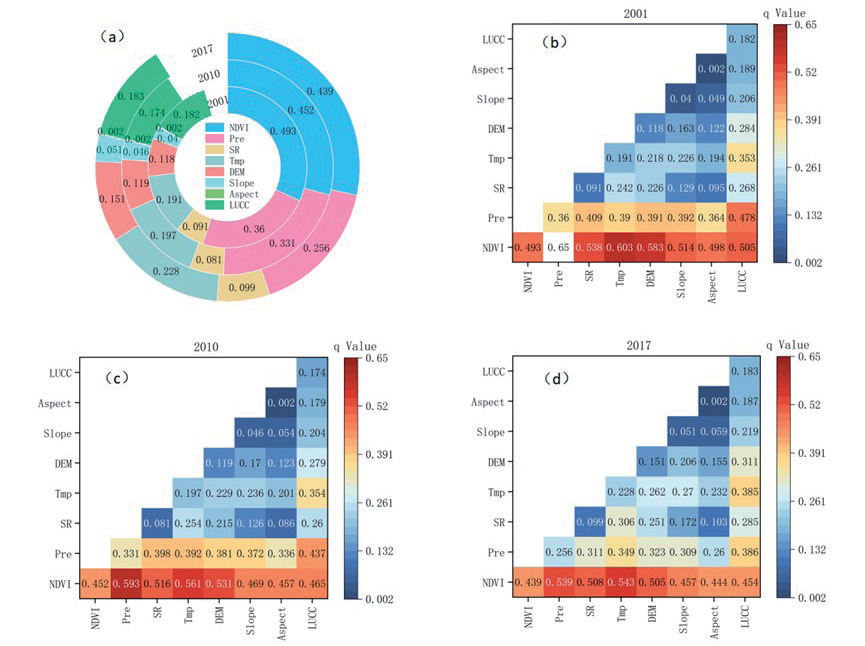
Based on the findings of the interaction detection analysis (Fig. 7(b-d)), it was noted that the q-values for the interactions among all components were higher than those for any individual factor. The interaction types between factors were either two-factor enhancement or nonlinear enhancement, indicating that the changes in NPP in Yunnan province from 2001 to 2017 were influenced by the synergistic effects of multiple factors rather than being controlled by a single factor. In 2001, 2010, and 2017, the interactions of NDVI∩Pre had the strongest explanatory power for NPP changes, with values of 0.650, 0.593, and 0.539, respectively. In the same years, the interactions of NDVI∩Pre, NDVI∩Tmp, and NDVI∩DEM had the highest average explanatory power for NPP changes, with values of 0.622, 0.582, and 0.557, respectively. In 2017, the dominant factors became NDVI∩Tmp, NDVI∩Pre, and NDVI∩SR, with explanatory powers of 0.543, 0.539, and 0.508, respectively. Overall, although NDVI has always been the dominant factor in NPP changes and has strong explanatory power for NPP when interacting with meteorological factors, its explanatory power after interacting with other factors has been weakening year by year. Conversely, the explanatory power of the interactions of LUCC∩DEM and LUCC∩Tmp was lower than that of NDVI when interacting with other factors, but their explanatory power has been strengthening year by year, indicating that the impact of land use and topographic changes on NPP changes in the study area should not be overlooked.
GWR Results
Based on the results of GeoDetector, four main factors, including NDVI, precipitation, temperature, and altitude, were selected. Since the VIF of temperature and altitude are both greater than 7.5 and the correlation coefficient between temperature and NPP is greater than that of altitude, the altitude factor is excluded. Hence, NDVI, precipitation, and temperature are determined as explanatory variables of the GWR model for the analysis of influencing factors.
Table 2.
Comparison of OLS and GWR models.
| year | Model | Adjusted R2 | AICC |
|---|---|---|---|
| 2001 | OLS | 0.679 | 24994.064 |
| GWR | 0.758 | 21448.092 | |
| 2010 | OLS | 0.638 | 26895.822 |
| GWR | 0.712 | 23852.807 | |
| 2017 | OLS | 0.668 | 25482.383 |
| GWR | 0.747 | 22110.509 |
On one hand, this approach achieves factor reduction, and on the other hand, it maximally reflects the impact of influencing factors, avoiding redundancy and ineffectiveness.
To reduce errors in the GWR results, it is necessary to first use ordinary least squares (OLS) to test the collinearity of the independent variables. Compared with the results of the OLS model (Table 2), the GWR model’s adjusted goodness of fit (Adjusted R2) increases, and the AICc value significantly decreases. This indicates that the GWR model can better explain the spatial distribution of how the three factors affect NPP.
The distribution results of the Geographically Weighted Regression coefficients between the three factors and NPP (Fig. 8) indicate that the spatial distribution of different influencing factors has significant spatial heterogeneity, specifically in the following three aspects:
(1) NDVI has a significant positive impact on NPP. The high positive value region of the regression coefficient is mainly located in the southern part of Yunnan Province (Xishuangbanna, the southern part of Pu’er, and the southern part of Honghe). These areas belong to the tropical region of Yunnan, with good water and heat conditions, high forest coverage, complex community structure, and rich species, thus leading to higher NPP. The region with a low positive value of the regression coefficient is mainly distributed in the northwest and northeast of Yunnan Province (Diqing, Nujiang, and the northern part of Zhaotong). The northwestern part of Yunnan belongs to the high-cold region on the southeast periphery of the Qinghai-Tibet Plateau, with high altitude and unfavorable conditions for plant growth, resulting in relatively low vegetation coverage and thus lower NPP. The region with a low positive value of the regression coefficient in the central part of Yunnan gradually transitions to the region with a high positive value, indicating the gradual improvement of Yunnan’s ecosystem.
Fig. 8.
Geographically Weighted Regression results: spatial distribution of regression coefficients for NDVI, precipitation, and temperature.
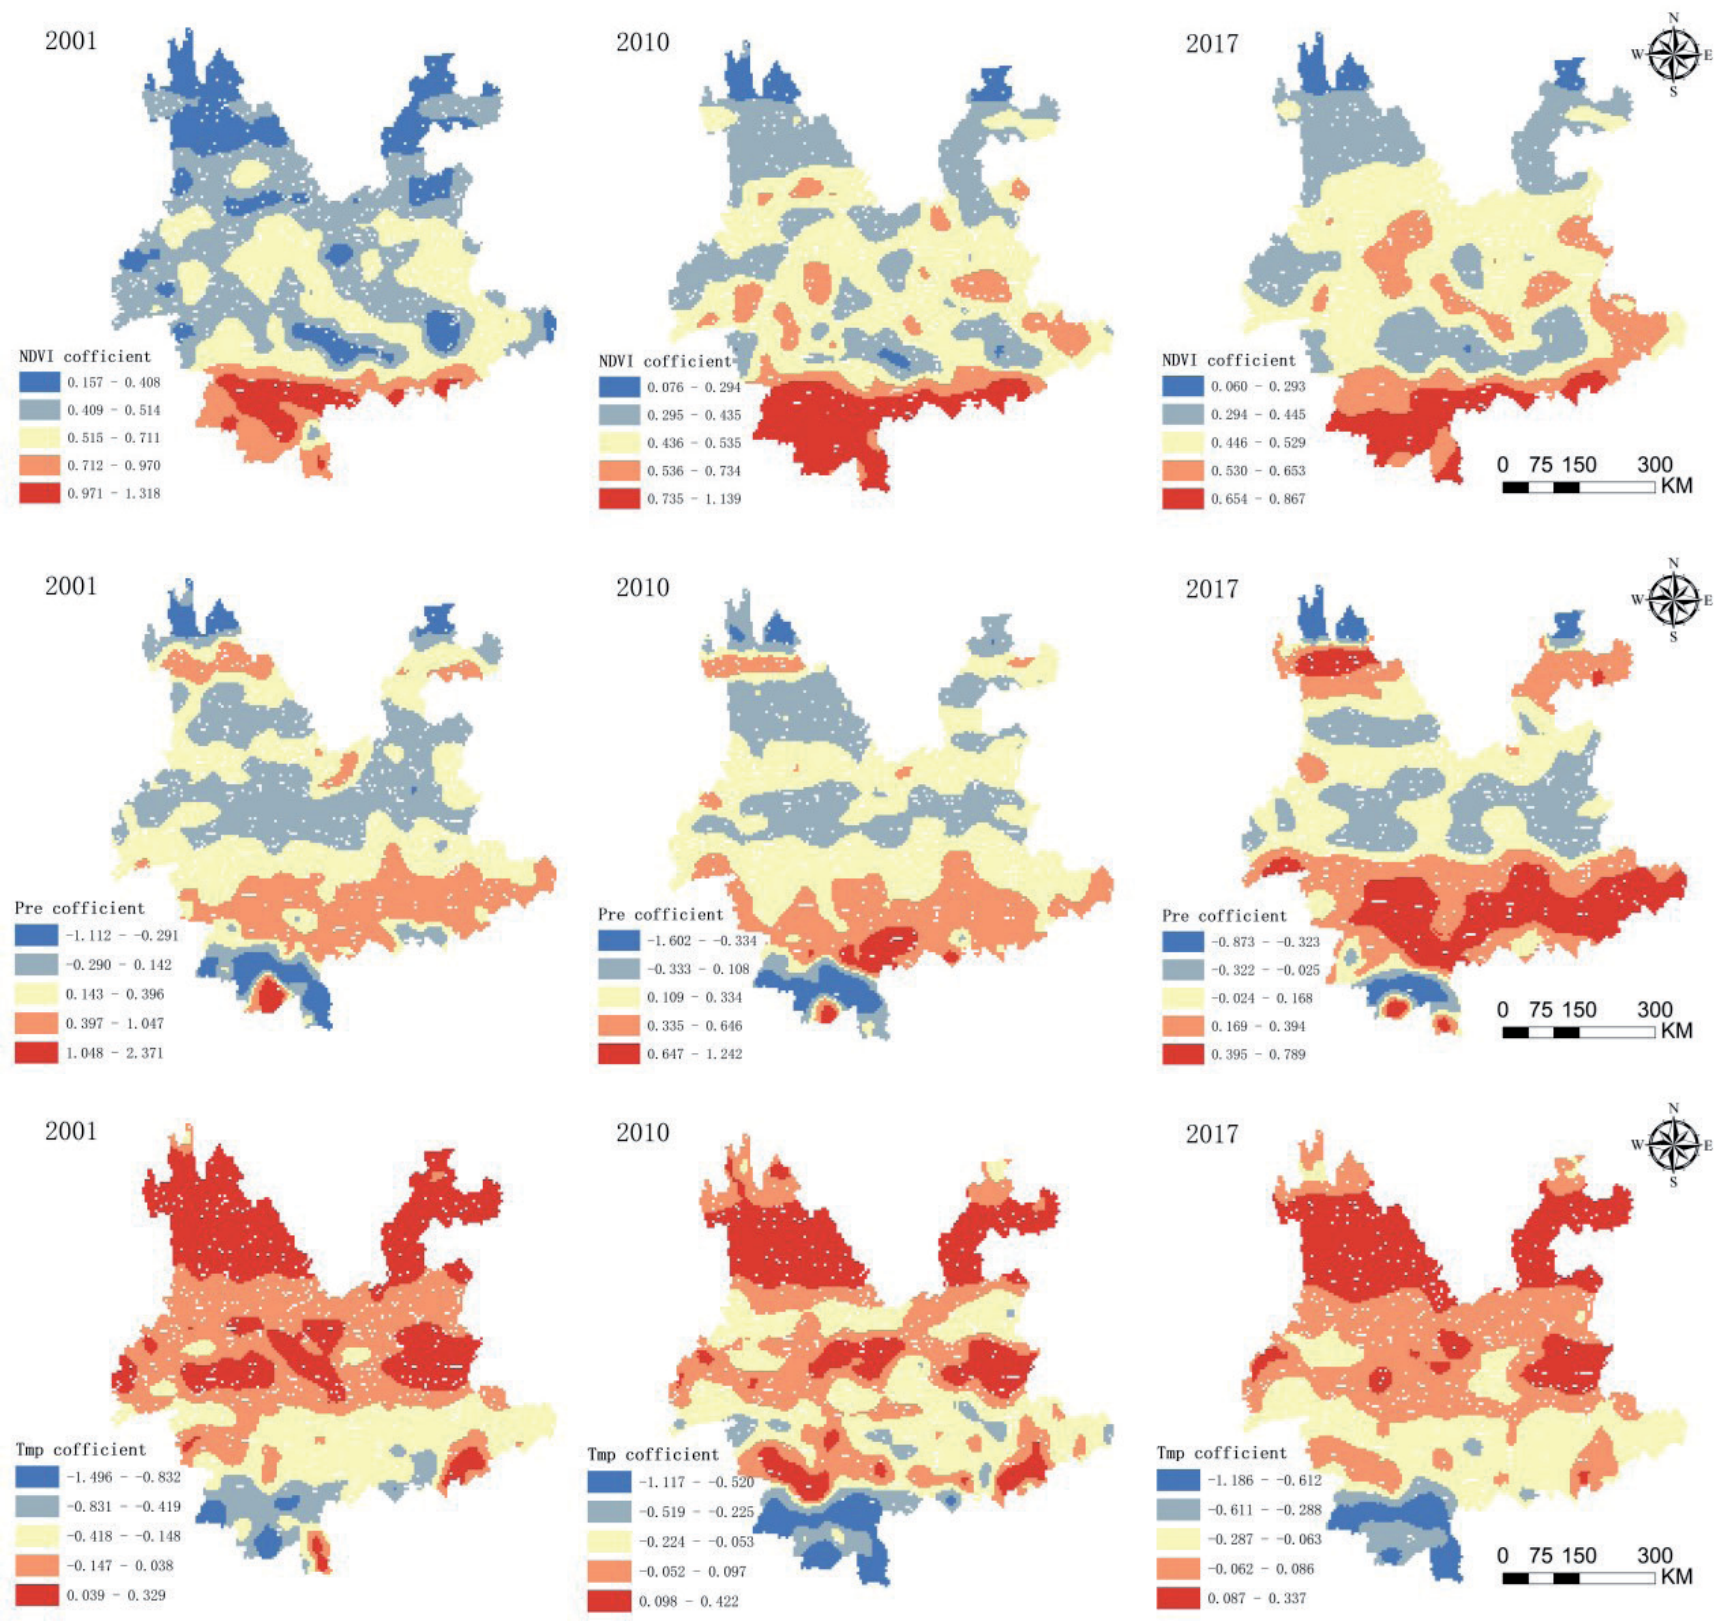
(2) From 2001 to 2017, the spatial distribution map of the regression coefficient of temperature shows that temperature has both positive and negative effects on NPP. The northern part of the province (Diqing, Nujiang, Lijiang, and Zhaotong) and some areas in the central part (Qujing, Chuxiong, and the southern part of Dali and Dehong) are positively influenced by temperature. The vegetation in these locations mostly comprises warm-temperate coniferous and broadleaved mixed forests, cold-temperate coniferous forests, temperate and cool coniferous forests, alpine shrubs, and meadows. These plant types possess specific adaptations suited for cold settings. High-value areas of the regression coefficient are mainly concentrated in the northern part of Yunnan Province, including Diqing, Lijiang, and Zhaotong, as well as in the central areas such as Chuxiong, Qujing, Dehong, and Wensha. In the southern areas such as Xishuangbanna and Pu’er, there is a significant negative effect of temperature, and over time, the area of negative impact surrounds the entire southern region. This is mainly due to the high temperatures in the southwest region, which can increase vegetation water consumption and suppress photosynthesis.
(3) Precipitation mainly has a positive effect on NPP. Over time, positive high-value areas gradually emerge around Pu’e, Hongh, and Wensha, indicating a strong promoting effect of precipitation on NPP in these areas. Over time, there has been a local expansion of areas with negative values, which has impacted the central regions (Kunming, Chuxiong, and certain parts of Dehong) as well as the eastern regions (such as Qujing City). In these areas, the negative high-value areas are most prominent in specific parts of Xishuangbanna, Diqing Prefecture, and Zhaotong City.
Discussion
Spatial and Temporal Heterogeneity Patterns Influenced by Natural Factors
Natural factors are important drivers of NPP, and their impact exhibits significant temporal and spatial variations. The results of our study indicate a decline in the explanatory capacity of precipitation and NDVI on NPP over an interval of time, whereas temperature, solar radiation, DEM, slope, and land use have shown an increase in their explanatory capacity. Among these factors, NDVI, precipitation, and temperature exhibit significant variations in the regions of North, Central, and South Yunnan, and they are the main drivers of spatial heterogeneity in NPP. This aligns with the research findings of Chen et al. [34] and Sun et al. [35] on Yunnan Province, who also found that natural factors have a stronger explanatory power for the spatial distribution of NPP than anthropogenic factors, and the interaction effects of any two factors can enhance this explanatory power. The primary reasons for this phenomenon are: (1) Yunnan Province is situated in a complex environment with diverse biota at a low latitude and high altitude, where land use is dominated by forests and grasslands, playing important roles in water conservation and soil retention [36, 37]. Therefore, natural conditions such as vegetation cover and climate have a significant impact on NPP. However, in recent years, frequent extreme weather events globally have led to flooding from extreme precipitation and insufficient soil moisture supply from extreme drought, disrupting the growth environment for vegetation and reducing the explanatory power of precipitation in the spatial differentiation of NPP [38]. (2) Against the backdrop of global warming, higher temperatures may extend the growing season for vegetation [39], leading to increased efficiency in photosynthesis, with solar radiation as the main energy source for vegetation, hence enhancing its explanatory power for NPP. (3) Anthropogenic activities such as urbanization and agricultural expansion have led to significant changes in land use, affecting landscape structure, altering ecosystem functions, and thereby influencing the spatial distribution of NPP [40, 41].
However, it is noteworthy that the influences of NDVI, precipitation, and temperature on NPP in South and North Yunnan show opposite spatial differences, with NDVI and precipitation decreasing in influence with increasing elevation, while temperature’s influence increasing with elevation. Importantly, over time, the positive correlation between vegetation NPP and NDVI in Central Yunnan has been gradually strengthening. In the northern regions of Yunnan, such as Nujiang and Diqing, despite possibly high vegetation cover, the high altitude, low temperature, short growing season, and poor soil quality limit the growth rate and strength of vegetation, hence their relatively lower contribution to the NPP. In contrast, in the southern region, such as Xishuangbanna, lower altitudes, favorable thermal conditions, and longer growing seasons facilitate rapid vegetation growth and recovery [42], resulting in a higher impact on NPP. Additionally, the increase in the influence of NDVI on NPP in Central Yunnan represents improvements in ecological and environmental quality and advancements in agricultural production techniques [43]. Among meteorological factors, precipitation is the predominant factor influencing variations in vegetation NPP, promoting NPP in most regions. For instance, the tropical and subtropical climates of regions like Honghe, Wenshan, and Pu’er benefit from increased precipitation, promoting vegetation growth [42]. Conversely, precipitation shows the strongest negative correlation in some regions in the north and south of Yunnan. The high altitude in the north makes excessive precipitation likely to trigger natural disasters (landslides, debris flows, etc.), hindering vegetation growth, whereas excessive precipitation in the south, like in Xishuangbanna, a humid region, affects thermal conditions and suppresses vegetation growth [43]. Temperature is also a crucial factor influencing vegetation NPP. The main vegetation types in Northwest Yunnan are warm-temperate mixed broadleaf-conifer forests, cold-temperate coniferous forests, temperate coniferous forests, alpine shrubs, and meadows, which are more sensitive to temperature. Higher temperatures significantly promote photosynthesis, favoring vegetation growth. Conversely, the increase in vegetation NPP in Northeast Yunnan (e.g., Zhaotong) is due to higher temperatures and increased precipitation, which facilitate photosynthesis and transpiration, leading to a significant increase in vegetation cover. In southwestern Yunnan and most of the northern region, while higher temperatures are conducive to photosynthesis, they may also hinder the increase in vegetation NPP due to increased water consumption, suppressing photosynthesis [42]. For example, in 2010, higher temperatures in southwestern Yunnan led to a larger area of negative influence on vegetation NPP, mainly related to that year’s extreme drought [44]. Drought affects plant photosynthesis, nutrient absorption, and leaf health and subsequently influences NPP [45].
Spatial and Temporal Heterogeneous Patterns of Anthropogenic Influences
The spatial and temporal distribution pattern of NPP is mostly influenced by anthropogenic causes, particularly in relation to anthropogenic land use. The influence of land use on the spatial divergence of NPP is comparatively small in relation to natural causes; however, it has a tendency to grow as time progresses. Our study shows that the explanatory power of Slope ∩ LUCC and DEM ∩ LUCC on NPP has a tendency to increase over time, which fits with the results of Xu et al. [43], Chen et al. [34], and Sun et al. [35]. The interaction of topography and land use may directly impact soil, water, and light conditions, thereby altering plant growth and affecting the spatial and temporal distribution patterns of NPP. In recent years, significant changes in land use have occurred in Yunnan Province due to socioeconomic development and population growth, leading to adjustments in land use structure. For example, the conversion of agricultural land to impermeable surfaces has taken place on a large scale [46]. Furthermore, our study found that although overall, the conversion of land cover types to forests, grasslands, and croplands between 2001-2017 resulted in NPP gains, conversions to water bodies, bare land, and urban land led to NPP losses. Specifically, land use transitions caused vegetation NPP losses from 2001-2007, particularly the conversion to forests, resulting in a decrease of 1.75 Kg C·m-2·a-1, while transitions from 2010-2017 led to vegetation NPP gains, especially the conversion to urban land, which resulted in an increase of 69.23 Kg C·m-2·a-1. This contrasts with some studies where land conversion to forests increases vegetation productivity while conversion to urban land reduces it [7, 47]. The main reasons for this may be related to the differences in the direction of land use change and the level of urban development in different regions [48]. From 2001-2010, much of Yunnan Province’s forests were converted into croplands. Croplands, with long-term cultivation and fertilization, have higher soil quality than forests. After conversion, forests need to undergo long-term natural succession and vegetation recovery to increase NPP, as also evidenced in studies of the Shenyang economic zone [49]. A recent study found that the promotion effect of the urban environment on vegetation production is constrained by the level of urban development, with higher urbanization leading to higher overall vegetation levels, a phenomenon inseparable from natural and climatic conditions [50]. Meanwhile, from 2001-2010, slow urban development in Yunnan Province resulted in the conversion of land use types to urban land, disrupting the original vegetation cover and causing an overall decrease in NPP. However, from 2010-2017, accelerated urbanization intensified the urban heat island effect, promoting vegetation growth [46, 51]. Moreover, impermeable surfaces, compared to vegetated cover, reduce water retention, infiltration, and evapotranspiration, thereby favoring vegetation growth and increasing NPP [52]. Additionally, from 2010-2017, urban development placed a greater emphasis on ecological construction, and urban irrigation, construction, and greening provided favorable conditions for urban vegetation growth, such that the indirect effects of anthropogenic intervention in the urbanization process on improving the vegetation growth environment outweigh the direct losses caused by vegetation destruction [12], leading to an increase in vegetation NPP.
Advantages and Limitations
This study addresses the lack of research on the spatial and temporal variability of NPP and the factors that influence it. It combines a GeoDetector and a GWR model to examine the distinct spatial and temporal characteristics of the effects of natural and anthropogenic factors on NPP. The findings confirm that natural factors have a dominant influence on the changes in NPP in Yunnan Province, and there are significant differences in the spatial and temporal impacts of natural and anthropogenic factors on NPP. The combined use of GeoDetector and GWR models not only comprehensively demonstrates the complex relationship between NPP and the drivers on the temporal and spatial scales, but also enhances the explanatory power of the models. This is different from the traditional analysis. However, our study also has some limitations. Firstly, when using GeoDetector to identify the dominant factors of NPP at different time scales, the independent variables of GeoDetector must be categorical, requiring the discretization of factors. Different classification methods may lead to different results [32]. The classification of each factor in this study mainly refers to existing research and uses the natural breakpoint method to partition factors combined with the characteristics of Yunnan Province, which lacks a quantitative evaluation and inevitably affects the accuracy of the research results. Further investigation is needed to examine the influence patterns of different factors affecting NPP. Secondly, the influence of environmental complexity at different scales on ecosystems is of great significance, but the GWR model only assigns a uniform search bandwidth for all independent variables, ignoring the different scale effects of different variables, and the response relationship between NPP and different factors at different scales may vary. Based on these limitations, we recommend that future research should further reveal the partitioning effects of NPP and its influencing factors by improving existing methods and conducting a more detailed exploration of their relationships at different spatial scales.
Conclusions
The exploration of the driving factors of NPP changes and their spatial-temporal correlation features is the basis and prerequisite for the sustainable development of ecosystems. This study uses GeoDetector to reveal the mechanisms of natural and anthropogenic factors at different times and spaces, identify key factors affecting NPP, and then use these key factors to construct the GWR model. Based on the regression coefficient, the spatial-temporal heterogeneity of the key influencing factors for NPP is visualized. The principal results of this investigation are as follows:
(1) From 2001 to 2017, the overall NPP in Yunnan Province showed an increasing trend, with a change rate of 0.013/year. The non-significant increase in NPP is the main spatial distribution in the region. This indicates that vegetation productivity is developing in a positive direction under the influence of natural and anthropogenic factors.
(2) The impact of natural factors on NPP shows significant spatiotemporal differences. NDVI, temperature, and precipitation dominate the spatiotemporal distribution pattern of NPP. From the spatial distribution, with the increase in altitude, the influence of NDVI and precipitation decreases while the influence of temperature increases. The NDVI has had a favorable, increasing effect on NPP in the central Yunnan region over time. In terms of temporal variations, temperature, solar radiation, and topography all exhibit increasing trends in explanatory power, while precipitation and vegetation on the NPP show declining trends. This implies that the important role of natural factors in impacting vegetation cannot be ignored.
(3) Anthropogenic variables have a relatively low explanatory power on the spatial distribution pattern of NPP as compared to natural sources; however, this is growing over time. Although urbanization had a negative effect on vegetation productivity from 2001 to 2017, we found that after 2010, urbanization had a positive effect on vegetation productivity. This indicates that, against the backdrop of accelerated urban development, anthropogenic activities have improved NPP more than they have harmed it.
The study examines the spatial and temporal connections between NPP and driving variables, offering a fresh outlook for research on sustainable development in regional and global NPP.

