


Introduction
Semarang City is a metropolis characterized by its high population density. According to data from the Central Statistics Agency for 2021, the population in the region has increased to a staggering 1.6 million individuals, with a corresponding growth rate of 0.25% [1]. However, this consistent surge over the years has exerted significant pressure on the availability of clean water resources. Semarang City has emerged as one of the regions grappling with excessive groundwater exploitation. Groundwater plays a pivotal role in sustaining local industries, agriculture, and domestic water usage for the residents. Globally, 65% of domestic air supply, 25% of industry, and 15% of agriculture comes from groundwater [2, 3]. In recent years, exploitation practices have reached unparalleled levels, primarily driven by increased demand. This has led to an imbalance between the charging and depletion of groundwater resources, leading to various problems, such as land subsidence, decreased quality, and seawater intrusion [4].
Water is the most important basic need for sustaining life, and groundwater remains the primary source of this need in Semarang City. This indicates that careful monitoring of its replenishment assumes paramount importance, serving as an integral facet of water resource management [5]. Therefore, the stable isotopes 2H (Hydrogen) and 18O (Oxygen) of groundwater are very powerful and flexible for knowing the origin of groundwater, mixing processes, and detecting chemical evolution [6, 7]. Stable isotopes have been widely used as tracers in groundwater studies [8]. By leveraging isotope hydrogeology, this method provides valuable insights into the composition of stable isotopes found in precipitation obtained from fractionation during seawater evaporation [9]. Studies on deep-water isotopes have also been used to determine the origin of groundwater and its association with rainwater. The isotope composition of groundwater retains its distinct character despite being mixed with water from various sources [10]. It is important to note that evaporation is the pivotal driving force fostering divergence in isotopes constituent of rainfall and groundwater. Stable isotopes in these water sources are powerful tools for studying their nature, origin, recharge patterns, and interactions [10]. Therefore, this study aims to determine the quality of groundwater through the analysis of parameters sodium (Na+), calcium (Ca2+), and magnesium (Mg2+). The results are expected to provide information on the suitability of the groundwater as irrigation water by calculating parameters such as the Sodium Adsorption Ratio (SAR) (sodium (Na+), calcium (Ca2+), and magnesium (Mg2+) and electrical conductivity (EC) [11, 12]. The samples obtained were then classified based on the method proposed [13] to define their origin in Semarang City through analysis parameters of isotope content of 18O and 2H. This was carried out by calculating the excess deuterium (DE) possessed by groundwater as an indicator of whether it originated from rainwater or was found in shallow/deep depths [14, 15].
The analysis had also been used by several studies to determine the origin of groundwater and its availability through isotope analysis of 18O and 2H. Sudaryanto and Lubis [16] conducted a study in Semarang City, which was also the location used in this study. Therefore, this current analysis is expected to help in solving the current problems by effectively utilizing the existing groundwater. Previous research used dug-well water and monitoring wells, while this research used deep wells as water samples for isotope testing. In previous research, only isotope tests were carried out, whereas in this research, chemical analysis was used to determine the condition of water for irrigation. This can be achieved through the distribution of groundwater contained in deep aquifers as the main water and irrigation source in areas with ineffective management from the relevant local government.
Material and Methods
Study Area
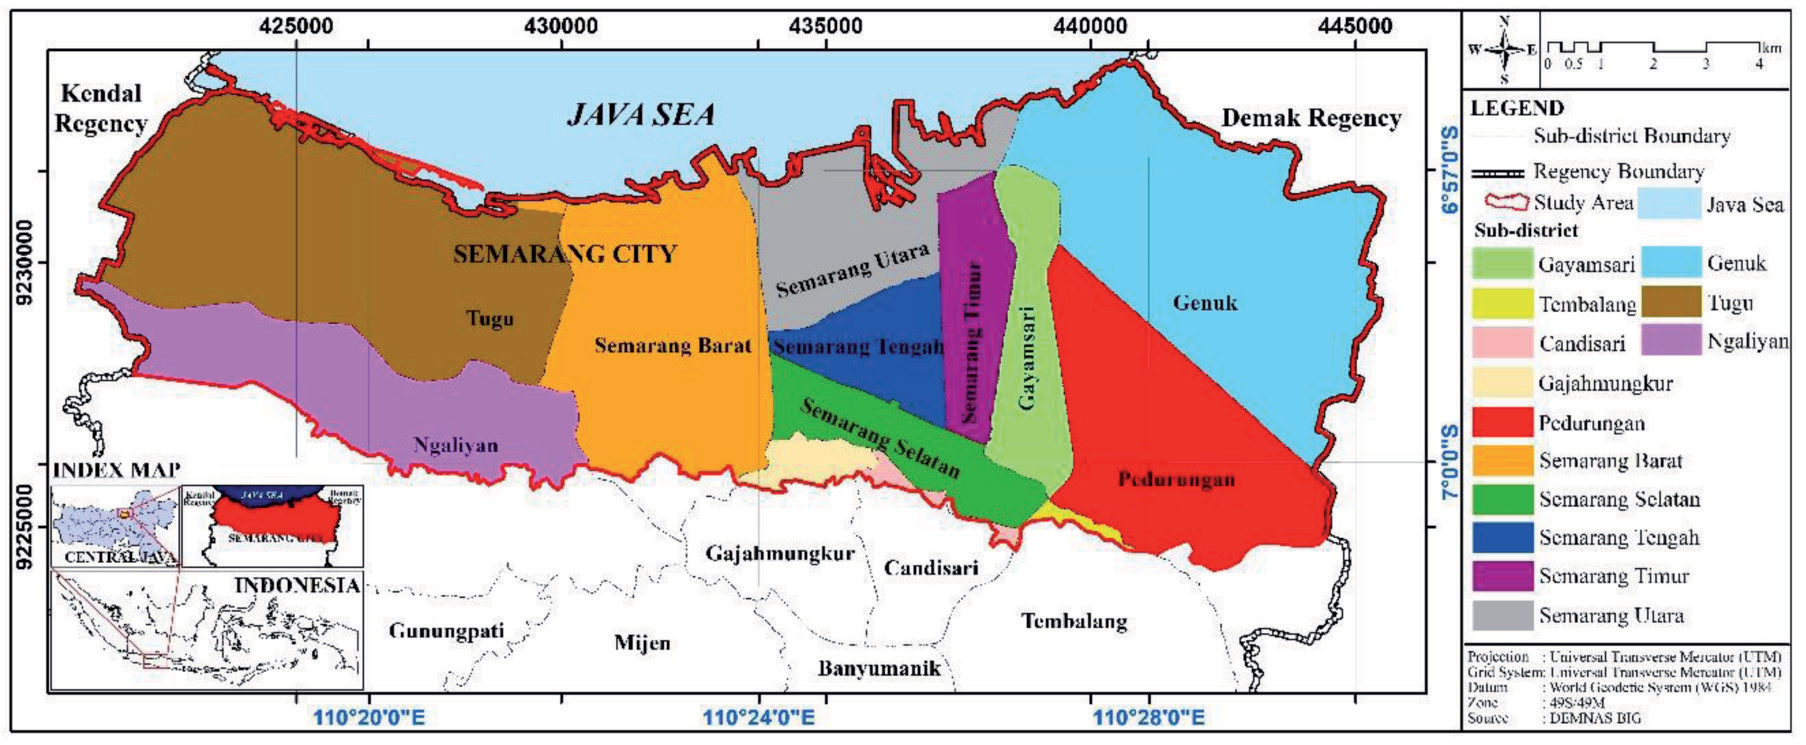
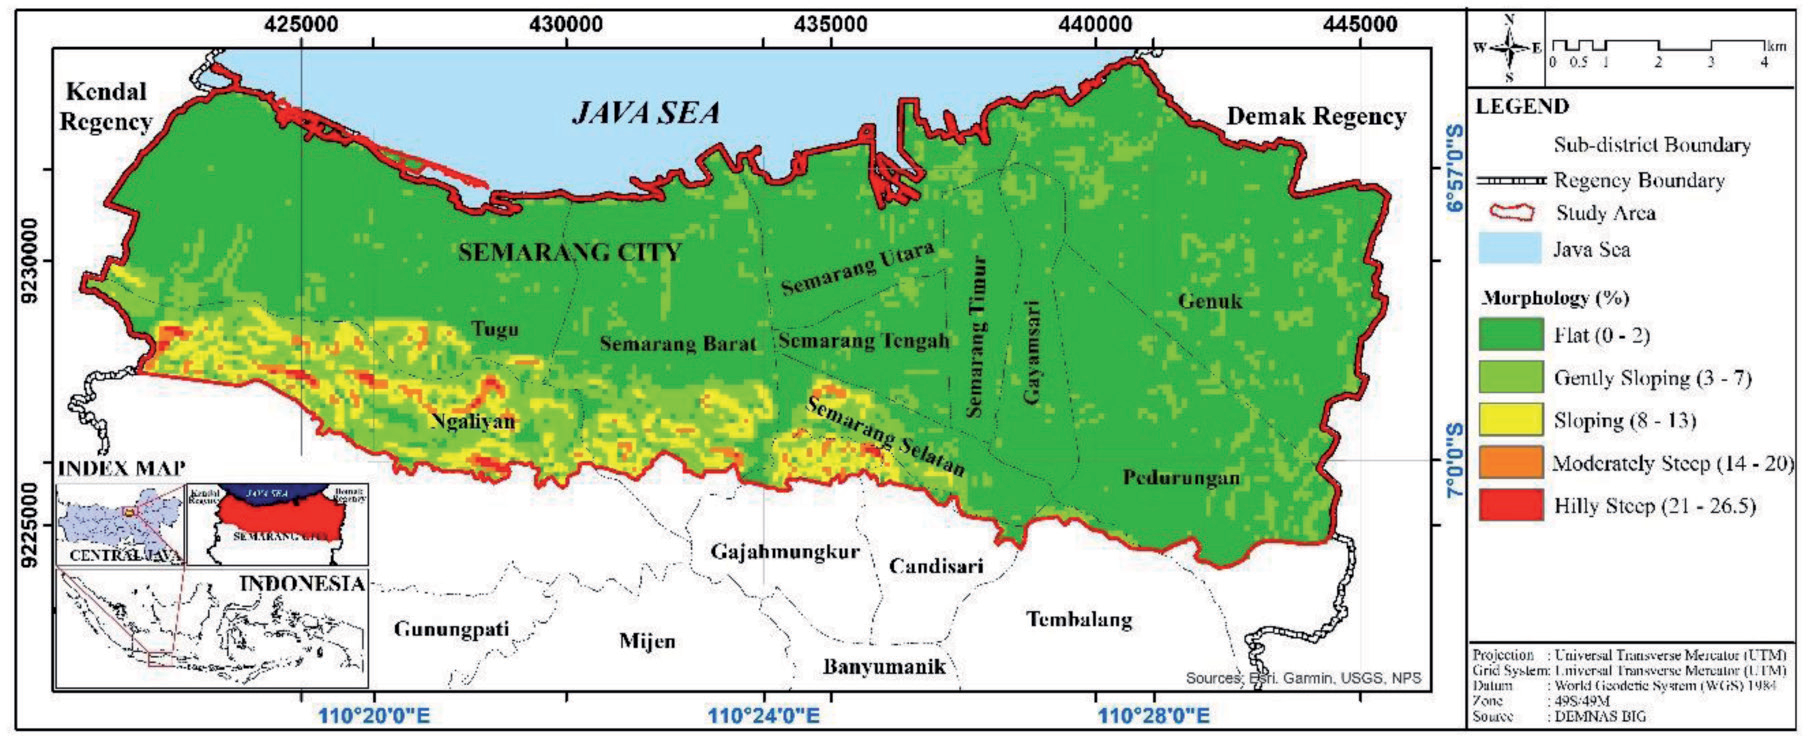
This study was carried out in Semarang City lowland area (Fig. 1), which was located between 110˚17’E - 110˚30’E and 6˚55’S - 7˚1’S /420864 - 445519 mE and 9224184 -9233797 mS. Physiographically, Semarang City is included in the Semarang-Demak Basin [17]. Based on classification [18], the morphology in the area consisted of plain morphological units with a distribution of 83.36%, as well as gentle undulating (9.38%), undulating oblique (5.69%), and hilly undulating (1.33%) slopes. The steep hilly morphology had a distribution of 0.23% in the area. Furthermore, it had ridges that generally extended in a west-east direction and was located in the southern part of the study area (Fig. 2).
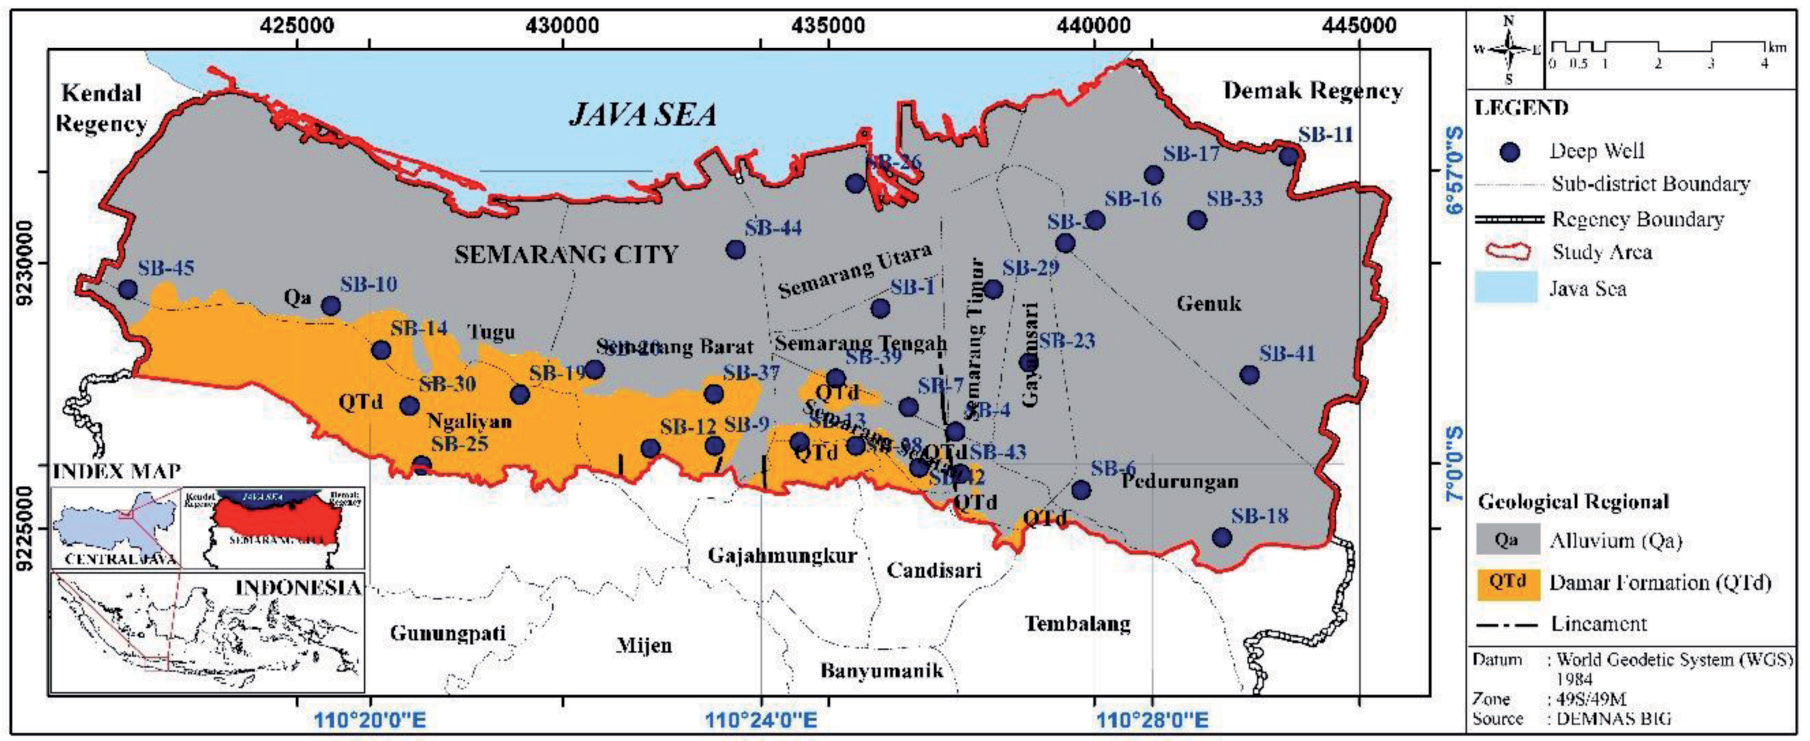
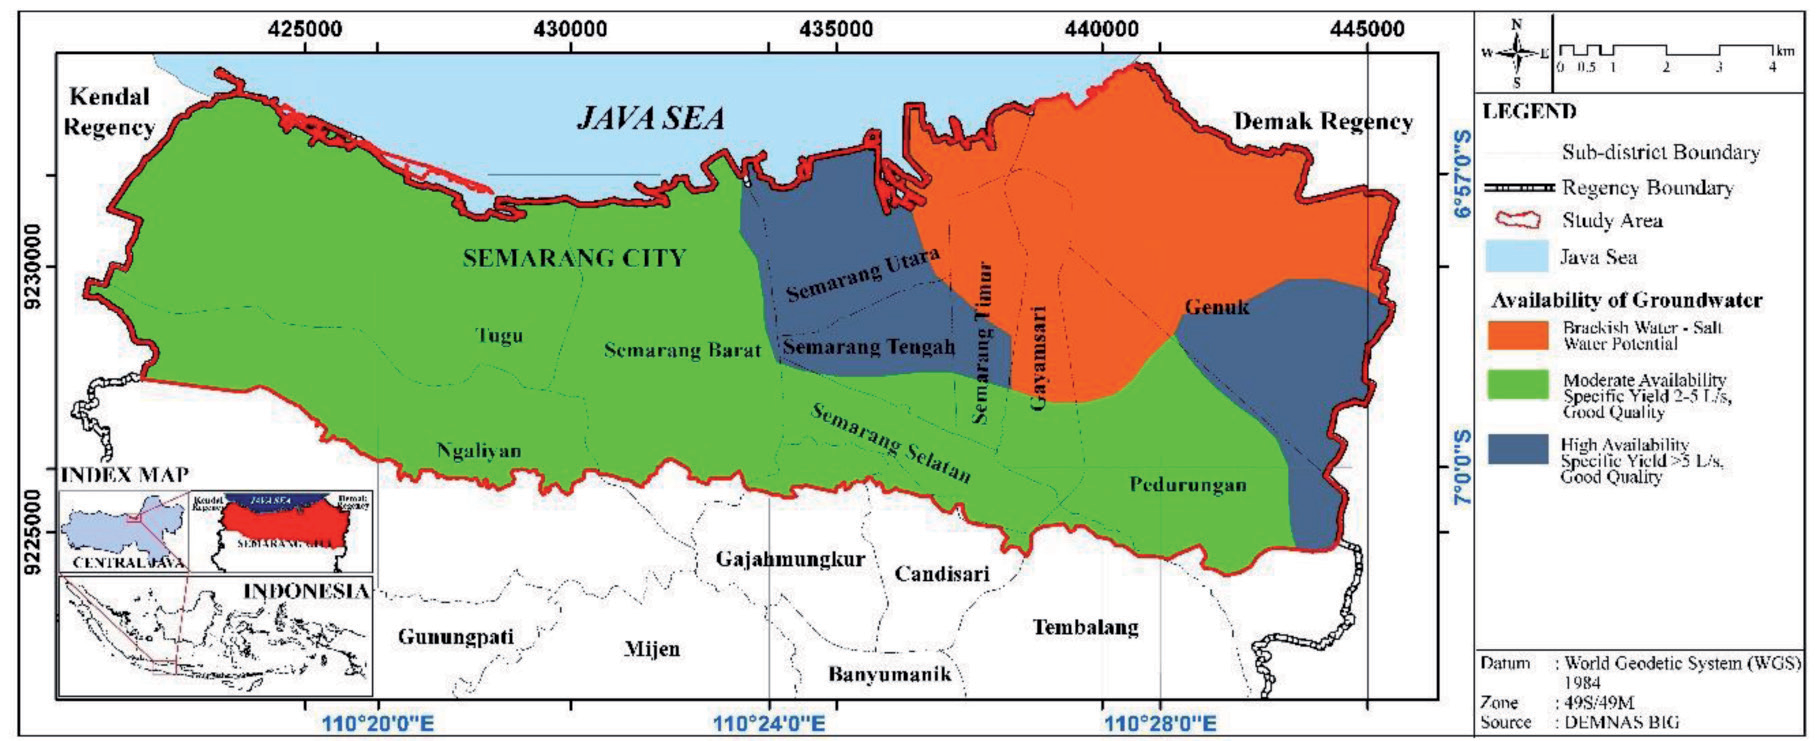
The stratigraphy of the study area was composed of Plio-Pleistocene to Holocene rock formations [19]. Based on Fig. 3, there were several rock formations in the study area, and they were sorted from oldest to youngest. The Damar Formation (QTd) was composed of tuffaceous sandstone, conglomerates, and volcanic breccias, which could have been deposited as lava. Alluvium (Qa) consisted of gravel, sand, silt, and clay. Furthermore, the structure that developed in the lowland part of Semarang City was in alignment [20]. The atlas map showed that Semarang City had 3 levels of groundwater availability, namely saltwater potential, as well as high and moderate availability with a water debit of > 5L/s and 2-5 L/s, respectively [21]. The hydrogeological map of the region is presented in Fig. 4.
Water Sampling
Secondary data were in the form of topographic maps, groundwater availability maps, regional geological maps, licensed borehole distribution locations, and DEM data. Meanwhile, primary data were obtained directly in the field, such as the quantity and quality of groundwater. The information on quantity was in the form of well locations, well depths, groundwater table depths, and elevations. The data were collected by taking direct measurements of the water level in combination with GPS.
A sampling at the study location consisted of 30 deep wells for analysis of stable isotopes content 18O and 2H, as shown in Fig. 3. Measurements of EC were also carried out for all samples. The distribution of sampling locations was based on the geological and hydrogeological conditions of the area.
All groundwater samples were subjected to laboratory tests to obtain results in the form of chemical content, including Na+, Ca2+, and Mg2+ dissolved in water and the content of stable isotopes 18O and 2H. Stable isotopes analysis of rainwater was carried out to determine the Global Meteoric Water Line (GMWL) equation.
This study was divided into four stages, namely the preparation stage, observation, data processing and analysis, and completion. The Preparatory Stage started with a literature study and preparing supporting files for field observations. In the observation phase, surface lithology, morphology, and hydrogeology data were collected by measuring the groundwater level and taking 30 samples to test the chemical content and stable isotopes 18O and 2H. Data Processing and Analysis were carried out by performing data processing in the form of determining the distribution of surface lithology and morphology, analysis and calculation of groundwater quality using SAR, EC, and %Na, and stable isotopes analysis. The stages of data analysis were performed using various software, including Excel 2010, Surfer 11, and ArcGIS 10.4. The completion stage involved concluding the analysis results carried out along with providing suggestions on points that were suitable for irrigation, were in deep aquifers, and were not affected by secondary evaporation.
Analysis of SAR and Stable Isotopes
The method used in this study was hydrogeochemical and stable isotopes analysis. Hydrogeochemical analysis was carried out to determine the quality of groundwater for irrigation using SAR and EC calculation in the samples and %Na. Meanwhile, isotope analysis was performed to determine the origin of groundwater.
Sodium Adsorption Ratio (SAR) and Electrical Conductivity (EC)
SAR was used to describe the extent to which sodium was likely to be absorbed into the soil, and it was calculated using Equation (1):
The parameters used are Na+, Ca2+, and Mg2+, which must have units of meq/L.
The calculation results were then used to classify groundwater for irrigation purposes, as shown in Table 1 [22].
The calculation of SAR and EC was carried out to determine the relationship and effect between salinity hazard and sodium hazard through classification [23]. Based on the classification, there were 4 class divisions on salinity and sodium hazards, including classes C1, C2, C3, and C4, indicating low to high levels of water salinity. This also applied to low to high sodium concentrations in classes S1, S2, S3, and S4. Apart from SAR and EC, irrigation suitability could also be evaluated using Na% and EC [13] using Equation (2):
Stable Isotopes
In the hydrological cycle, isotopes 18O, and 2H were included in the water compounds 2H, 18O, and HDO. Isotope content in water was used by a mass spectrometer to determine isotope ratio (δ) using the following equations [24]:
The mass spectrometer results were expressed in parts per million (ppm) . The SMOW standard established through the Vienna Convention had relative values for 18O = 0.0‰ and 2H = 0.0‰, with a measurement accuracy of 18O = ± 0.2‰ and 2H = ±1‰ [25].
The values of the corresponding 2H and 18O in precipitation were correlated and followed a linear relationship on a global scale. This relationship was defined by [26], as the Global Meteoric Water Line (GMWL) with a slope of 8 and an intercept of 10:
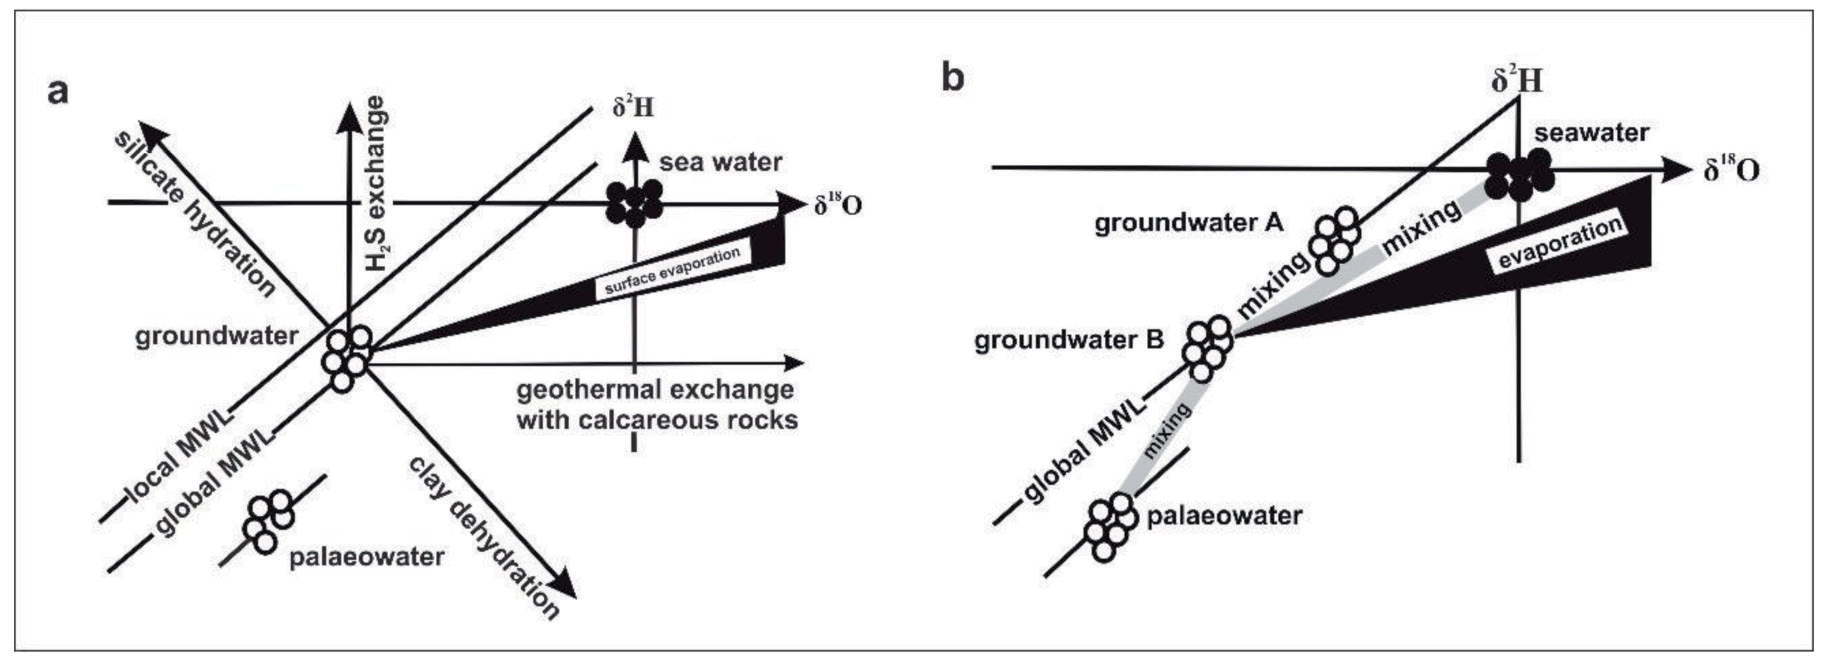
The GMWL was a line that showed the annual average value of isotopes ratio of hydrogen and oxygen in rainwater on Earth [27]. By comparing rainwater isotopes with the samples, the origin of the water and the mixing process, rock interactions, and evaporation could be identified [28, 29] as shown in Fig. 5.
Dansgaard [30] introduced DE as the GMWL interceptor, and it was defined below:
Based on the calculation results, the DE value of GMWL was 10, and its typical value ranged from 0 to 20, depending on the specific humidity conditions during the evaporation process in the source water. DE was useful for inferring any secondary processes (temperature, relative humidity, and amount of precipitation) present in the vapor composition of the atmosphere in the evaporation-condensation cycle in nature [30]. A value < 10 indicated that isotope composition was generally caused by a secondary evaporation process and changes in temperature and relative humidity, as well as the amount of rainfall occurring in the study area [26]. The secondary evaporation effect indicated the evaporation of rain that was released from the cloud base to the ground. Rainfall, which was affected by the evaporation effect, showed a characteristic of 18O enrichment and a decrease in DE [31].
Groundwater sampling was carried out in August 2022, and a total of 30 samples were obtained. At each point, the sample is taken after pumping 5-10 minutes. This aims to get a good sample with new water. To get good isotope results, deep groundwater samples taken were put into an airtight 100 ml bottle after being rinsed 3 times and confirmed to have no bubbles, then labeled [2, 27]. This was because air bubbles could cause evaporation, thereby changing stable isotopes compounds [28]. The H atomic composition of groundwater originating from rainwater infiltration was located along the local meteoric line unless there was an exchange of 18O, causing the graph of the relationship of 18O and 2H to move away from the local meteoric line, indicating evaporation [27, 32]. Stable isotope analysis has been carried out by many researchers around the world because of the use of isotopes in addition to knowing the origin of water, they can also filter groundwater in sewage and even nirate sources [33-35]. But in its application, the stable isotope method has drawbacks, namely that it only has two components, namely the interaction of water sources and dry weather conditions [34]. In dry weather, the use of water isotopes is more optimal. Data obtained from stable isotopes analysis were analyzed in the hydrochemical laboratory of the Center for Groundwater and Environmental Geology, Indonesian Geological Agency. The 18O and 2H values were measured relative to the Vienna Standard Mean Ocean Water (VSMOW) using the Cavity Ringdown Spectroscopy/MU.AT.2-09 analyzer.
Results and Discussion
Hydrogeological Condition
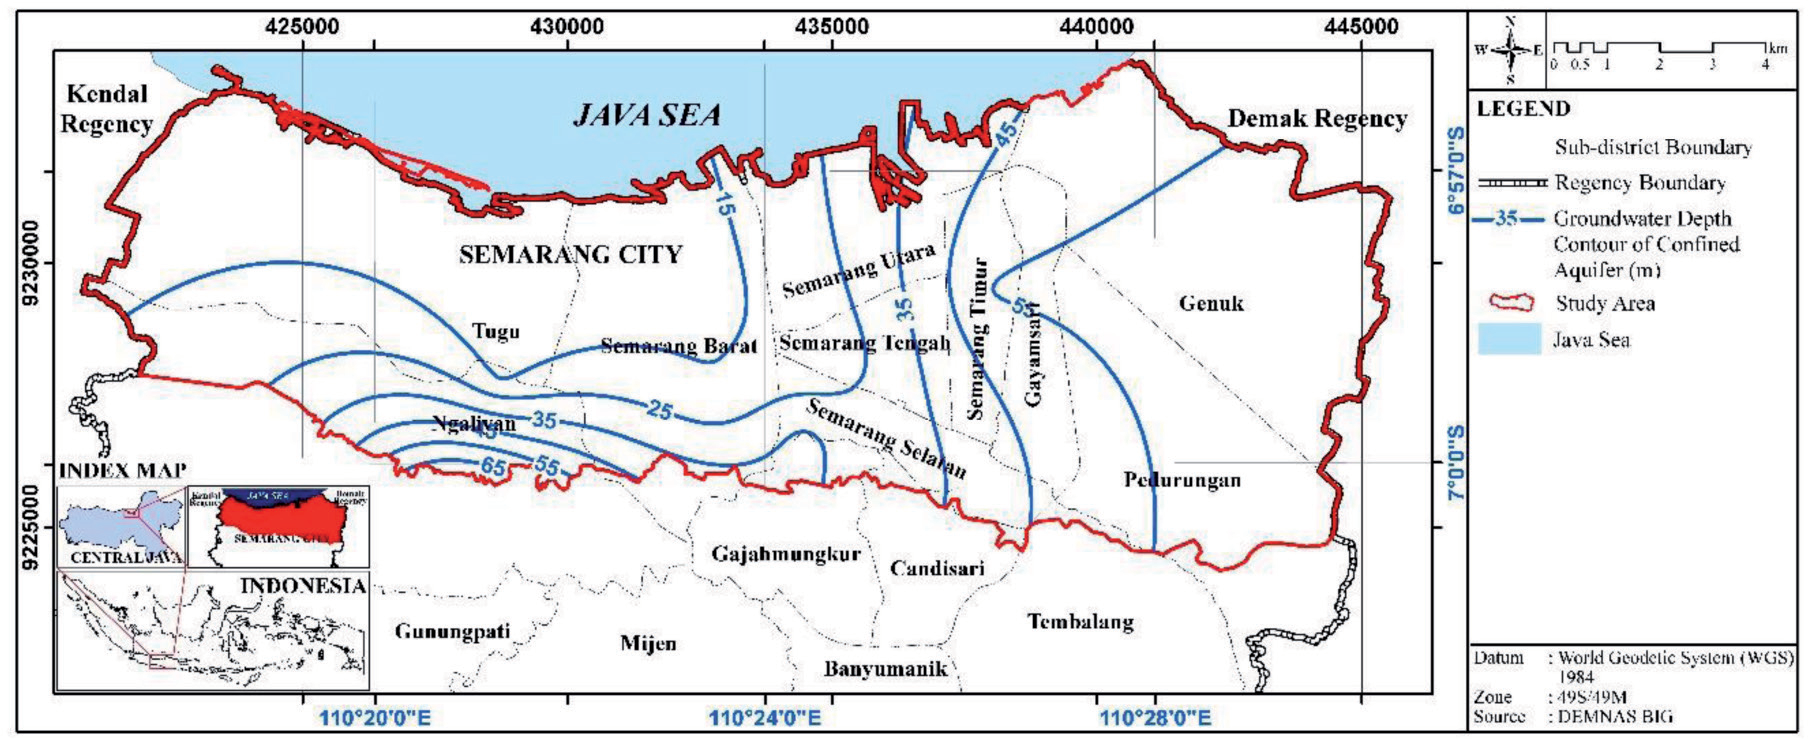
Based on the measurement results, the depth of groundwater ranged from 5.60-136.05 masl, and the level ranged from -51.82 to 59.17 masl. The direction of the flow of groundwater under pressure was from southwest to northeast. The pattern of flow was influenced by the amount of withdrawal. An overview of the depth of the groundwater table and its position are presented in Fig. 6 and Fig. 7.
Irrigation Suitability Assessment
Based on the analysis of EC of 30 samples, the values ranged from 389-6,440 µmhos/cm, as shown in Fig. 8. The calculation results of SAR using Equation (1) at 30 groundwater sample points showed that the lowest value of 2.34 was obtained at point SB-19, Ngaliyan, Semarang, while the highest value of 129.1 was recorded at SB-10, Tugu, Semarang. Based on the classification of irrigation water [22], there were 9 excellent samples to be used as irrigation water. Furthermore, a total of 18, 2, and 1 samples were in the unsuitable, permissible, and good categories. The SAR results were then combined with the EC value.
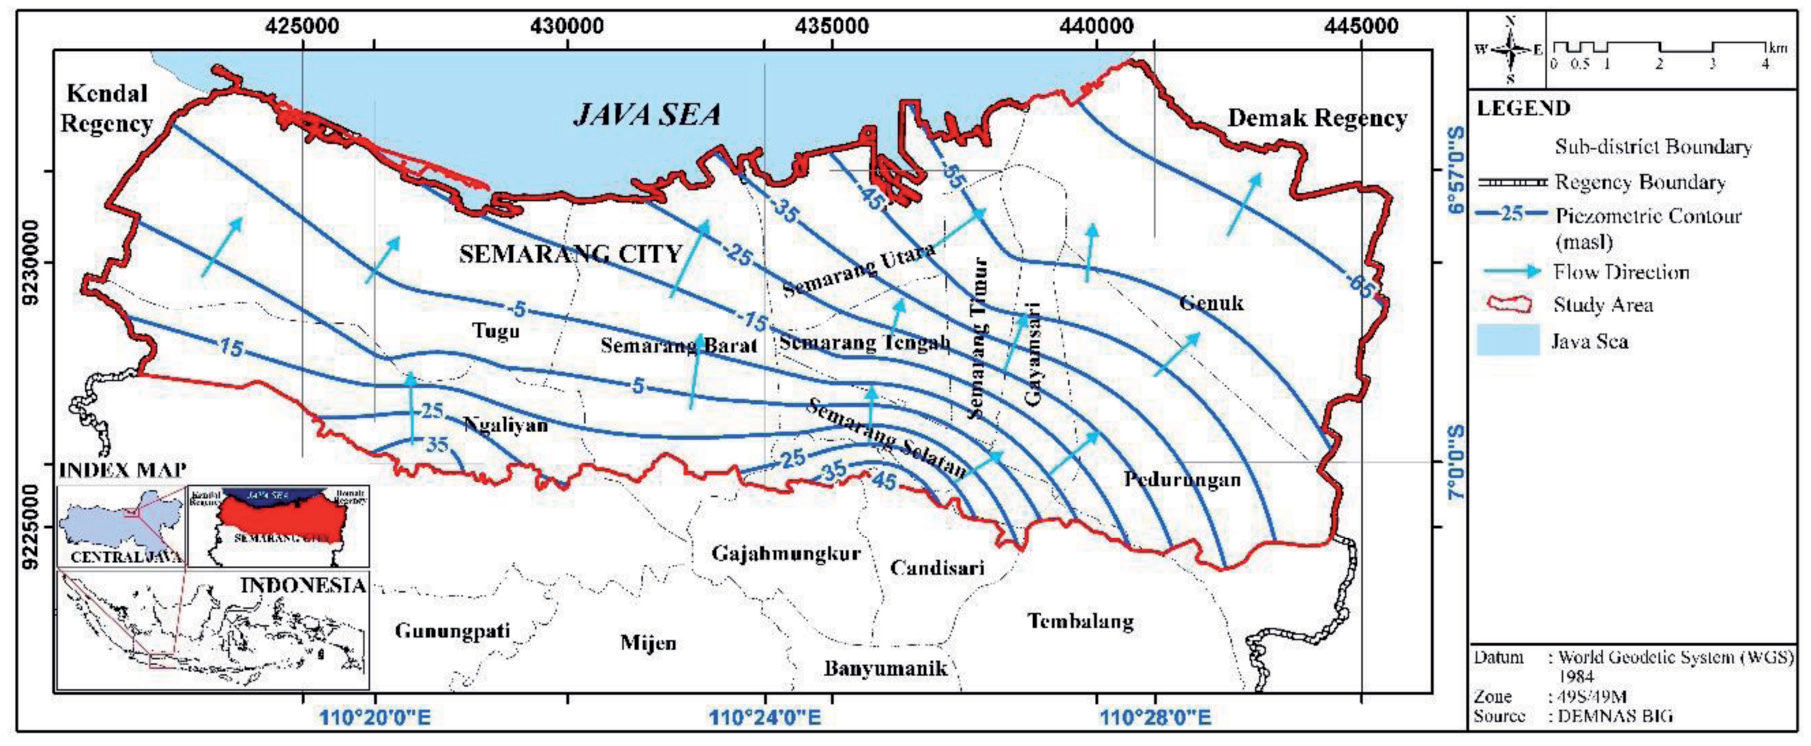
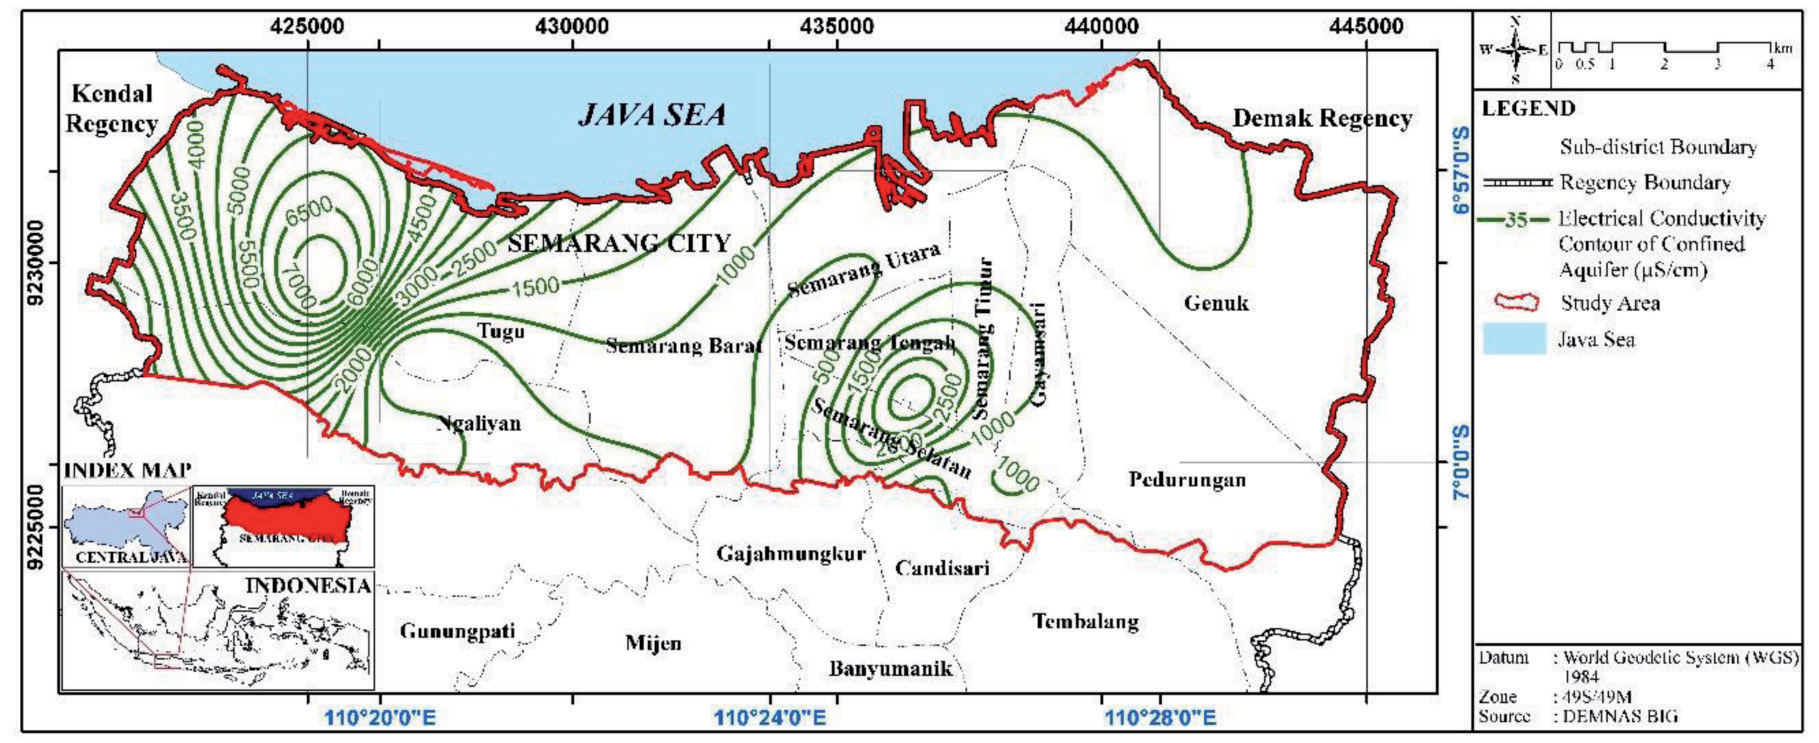
Table 2.
Classification of groundwater samples for irrigation.
The result of the merger was based on the classification proposed by [23], with 8 different classes, as shown in Fig. 9a. Class C2 –S1 had moderate salinity conditions and low sodium levels, indicating its suitability for irrigation. Furthermore, it was found in SB-9, SB-12, SB- 13, SB-14, SB-19, SB-25, SB-30, and SB-37 points. C2– S2 had moderate salinity conditions and moderate sodium levels and was permitted for irrigation. Furthermore, it was found in SB-16, SB-17, SB-35, SB-41, and SB-42 points. C2–S3 had moderate salinity conditions and high sodium levels. This class was still permitted for irrigation and was found in SB-11. C3–S1 had high salinity and a low sodium level and could be used for irrigation. However, it was necessary to carry out special treatment along with the provision of adequate drainage. Based on the results, this class existed in dots SB-18, SB-23, and SB-33. C3-S2 had high salinity and moderate sodium level, indicating that it could be used for irrigation, but special treatment along with adequate drainage was needed. This class existed in dots SB-1, SB-4, SB-6, SB-20, SB-26, SB-29, SB-39, SB-43, SB-44, and SB- 45, with alluvial lithology. This indicated that adequate drainage, management specialized in salinity control, and plants with good salt tolerance were needed. C3-S4 with high salinity and sodium levels was present in dots SB-38 but was not suitable for irrigation. This was due to its high salt concentrations, which could affect plant growth [12]. C4–S2 with very high salinity and moderate sodium levels, only existed at point SB-7 and was not permitted for irrigation. Furthermore, C4–S 4, with very high salinity and very high sodium levels, only occurred at point SB-10, which was not permitted for irrigation.
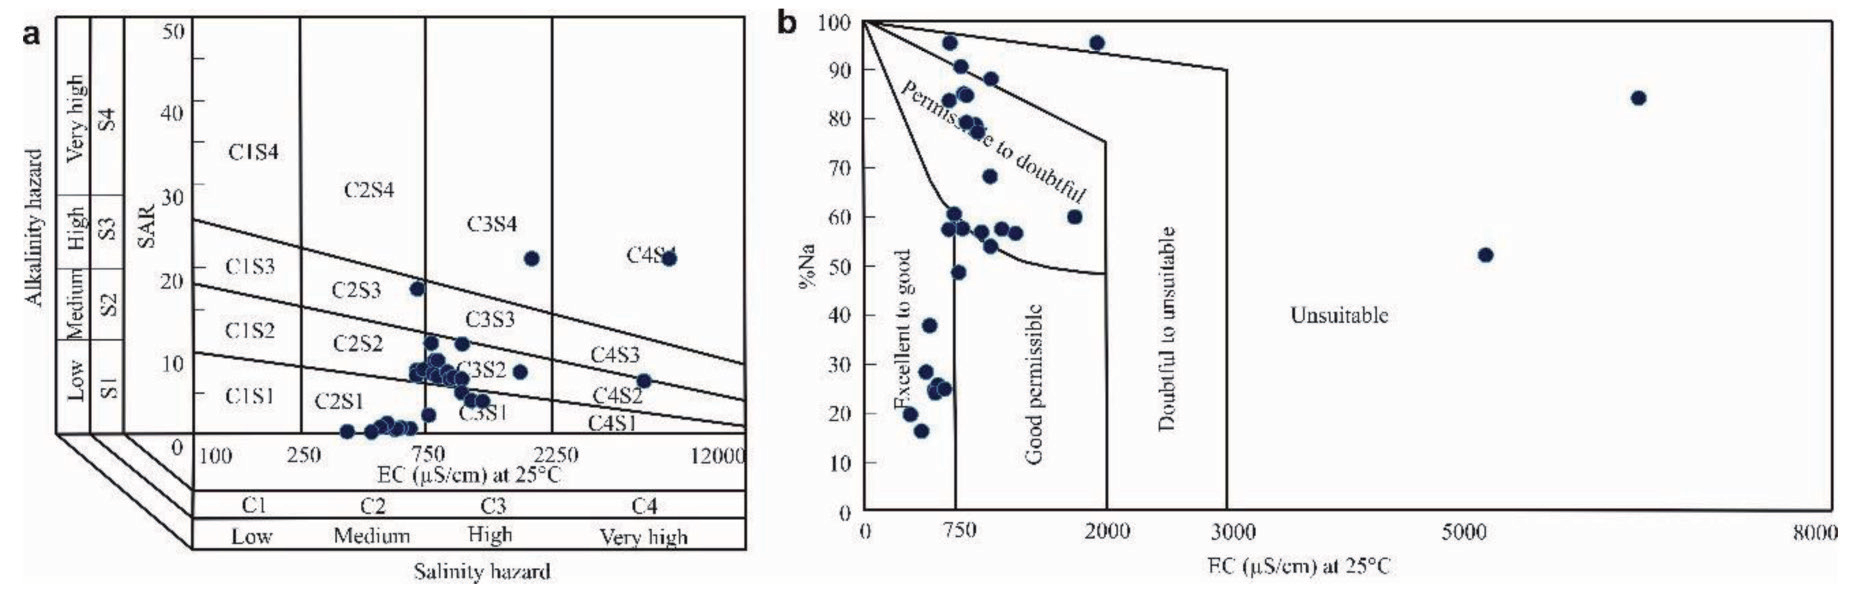
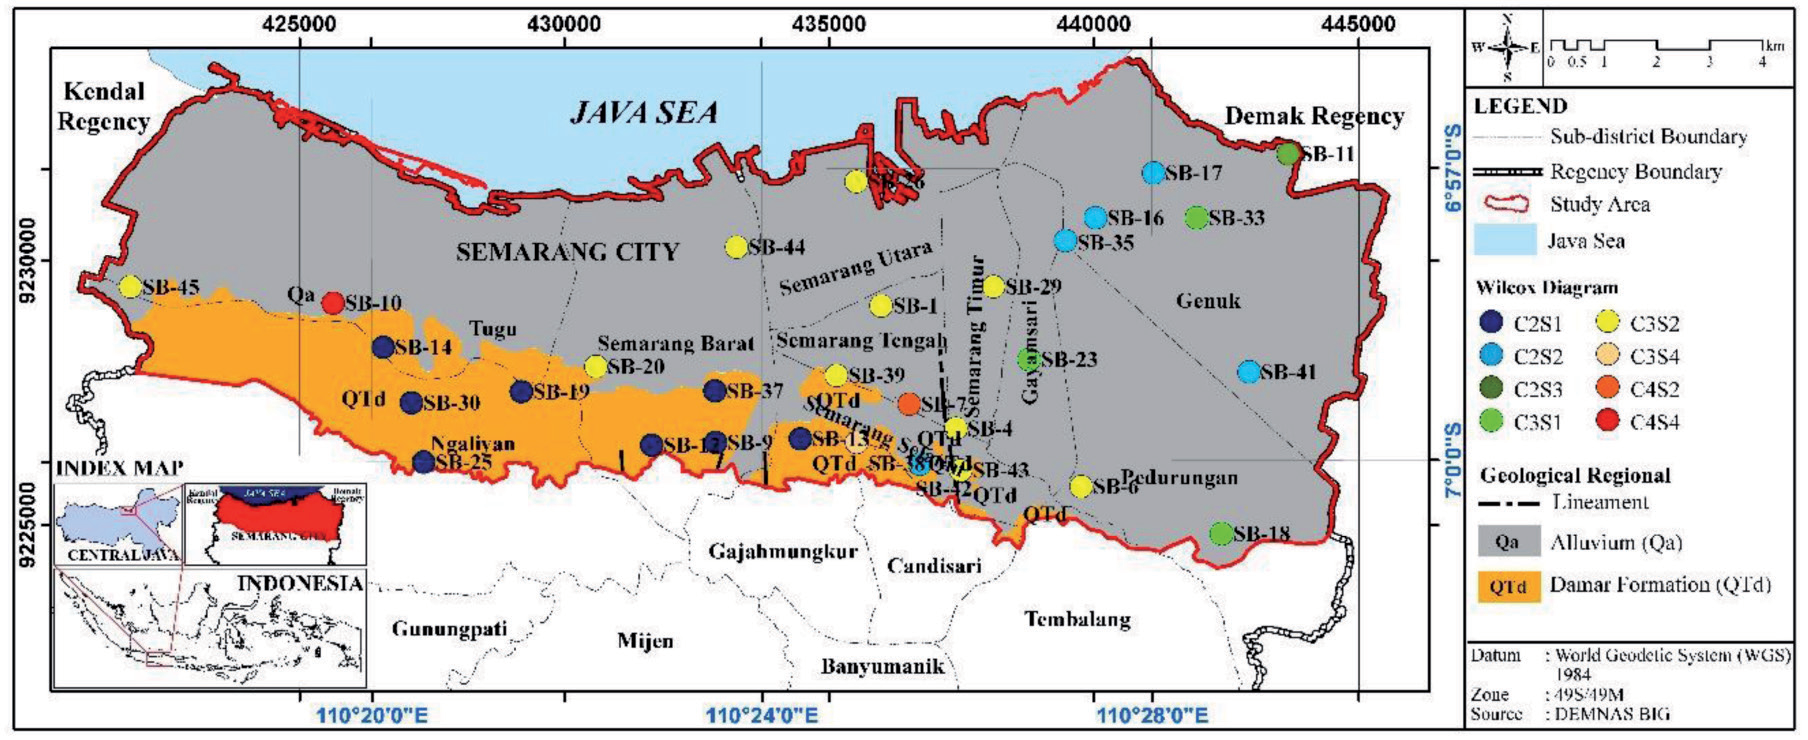
Table 3.
Summary of isotopes values.
| Type | δ18O | δ2H | ||||||
|---|---|---|---|---|---|---|---|---|
| Range | Average | SD | CV (%) | Range | Average | SD | CV (%) | |
| Deepweels | -6.04-(-4.59) | -5.7 | 0.29 | -5.02 | -36.3-(-27.3) | -33.93 | 1.78 | -5.25 |
Table 4.
Calculation result of isotopes δ18O and δ2H.
Based on the calculation results of SAR and EC, 13 deep wells were feasible to use as irrigation water. A total of 8 of them had medium salinity and a low sodium level, while 5 had medium salinity and moderate sodium. The results showed that 14 deep wells were suitable for irrigation, but special treatment and adequate drainage were required due to the lithology being alluvium, consisting of clay, mud, market, and silt. Alluvium deposits contained clay, which was capable of storing water and could drain deep water. One of the efforts to reduce the salinity level of the 13 water samples requiring special treatment was by selecting plants with good salt tolerance (soybean) [36]. A total of 3 groundwater sample points were not suitable for irrigation, namely SB-7, SB- 10, and SB-38, with a high salinity of 5,080 μS/cm, 6,330 μS/cm, and 1,905 μS/cm, respectively. High salinity could prevent the uptake of water by plants, leading to poisoning.
According to [37], an assessment of the quality of groundwater for irrigation purposes could be conducted by calculating Na% using Equation (2). According to [13], groundwater quality could be classified into 5 groups based on sodium percentage, namely very good (11 samples), good (1 sample), permitted (12 samples), doubtful (3 samples), and unsuitable (3 samples), as shown in Table 2 and Fig. 9b. The distribution of groundwater quality is presented in Fig. 10.
Recharge Sources of Groundwater
The ranges of isotope values, standard deviations, and coefficients of variance (CV) based on the type of sampling source are summarized in Table 3. The use of isotopes 18O and 2H analysis to determine the origin of groundwater was achieved by calculating the GMWL using Equation (5). The calculation results were then plotted into a scatter plot diagram to determine the relative positions of isotopes 18O and 2H to the GMWL. The plot showed the position of the groundwater samples relative to the GMWL. The proximity of some samples of groundwater from deep wells to the GMWL indicated that they were from modern rainwater [14]. Meanwhile, an extremity from the line indicated the occurrence of primary evaporation when water entered the soil, as shown in SB-1. The effect of evaporation could also be observed by calculating the excess DE based on Equation (6). The value of DE in most of the wellbore samples (SB-1, B-16, SB,17, SB18, SB-26, SB-33, SB-35, SB-39, SB-41, SB-43, SB-44, SB-6, SB-14, SB-19, SB-30, SB- 9, SB-12, SB-13, SB-23, SB-29, SB-4, SB-38, SB-45, SB-7, SB-25, SB -37, SB-42, SB-11, SB-20) was greater than 10, while SB-10 was less than 10 (Table 4). Samples B-16, SB,17, SB18, SB-26, SB-33, SB-35, SB-39, SB-41, SB-43, SB-44, SB-6, SB-14, SB-19, SB-30, SB-9, SB-12, SB-13, SB-23, SB-29, SB-4, SB-38, SB-45, SB-7, SB- 25, SB-37, SB- 42, SB-11, and SB-20 had lower isotope composition, DE of more than 10, and were positive with a relative position around the GMWL. This indicated the occurrence of lower rainwater evaporation during the recharging process, as shown in Table 4. The position of SB-1 was relatively far from the GMWL, indicating the presence of evaporation during the infiltration process. The 29 points were in a deep groundwater flow system with infiltration areas at lower temperatures and high humidity, which were accompanied by a relatively fast infiltration process [14]. The relatively fast infiltration process at the six points was indicated by the lithological conditions in the form of an alluvium lithology unit with an aquifer in the form of sand. The areas also consisted of tuffaceous sandstones in damar formations with good porosity, thereby ensuring the proper infiltration of water into the lithology unit (Table 4). Based on the groundwater availability map, the 29 points were included in medium-high groundwater availability and saltwater potential.
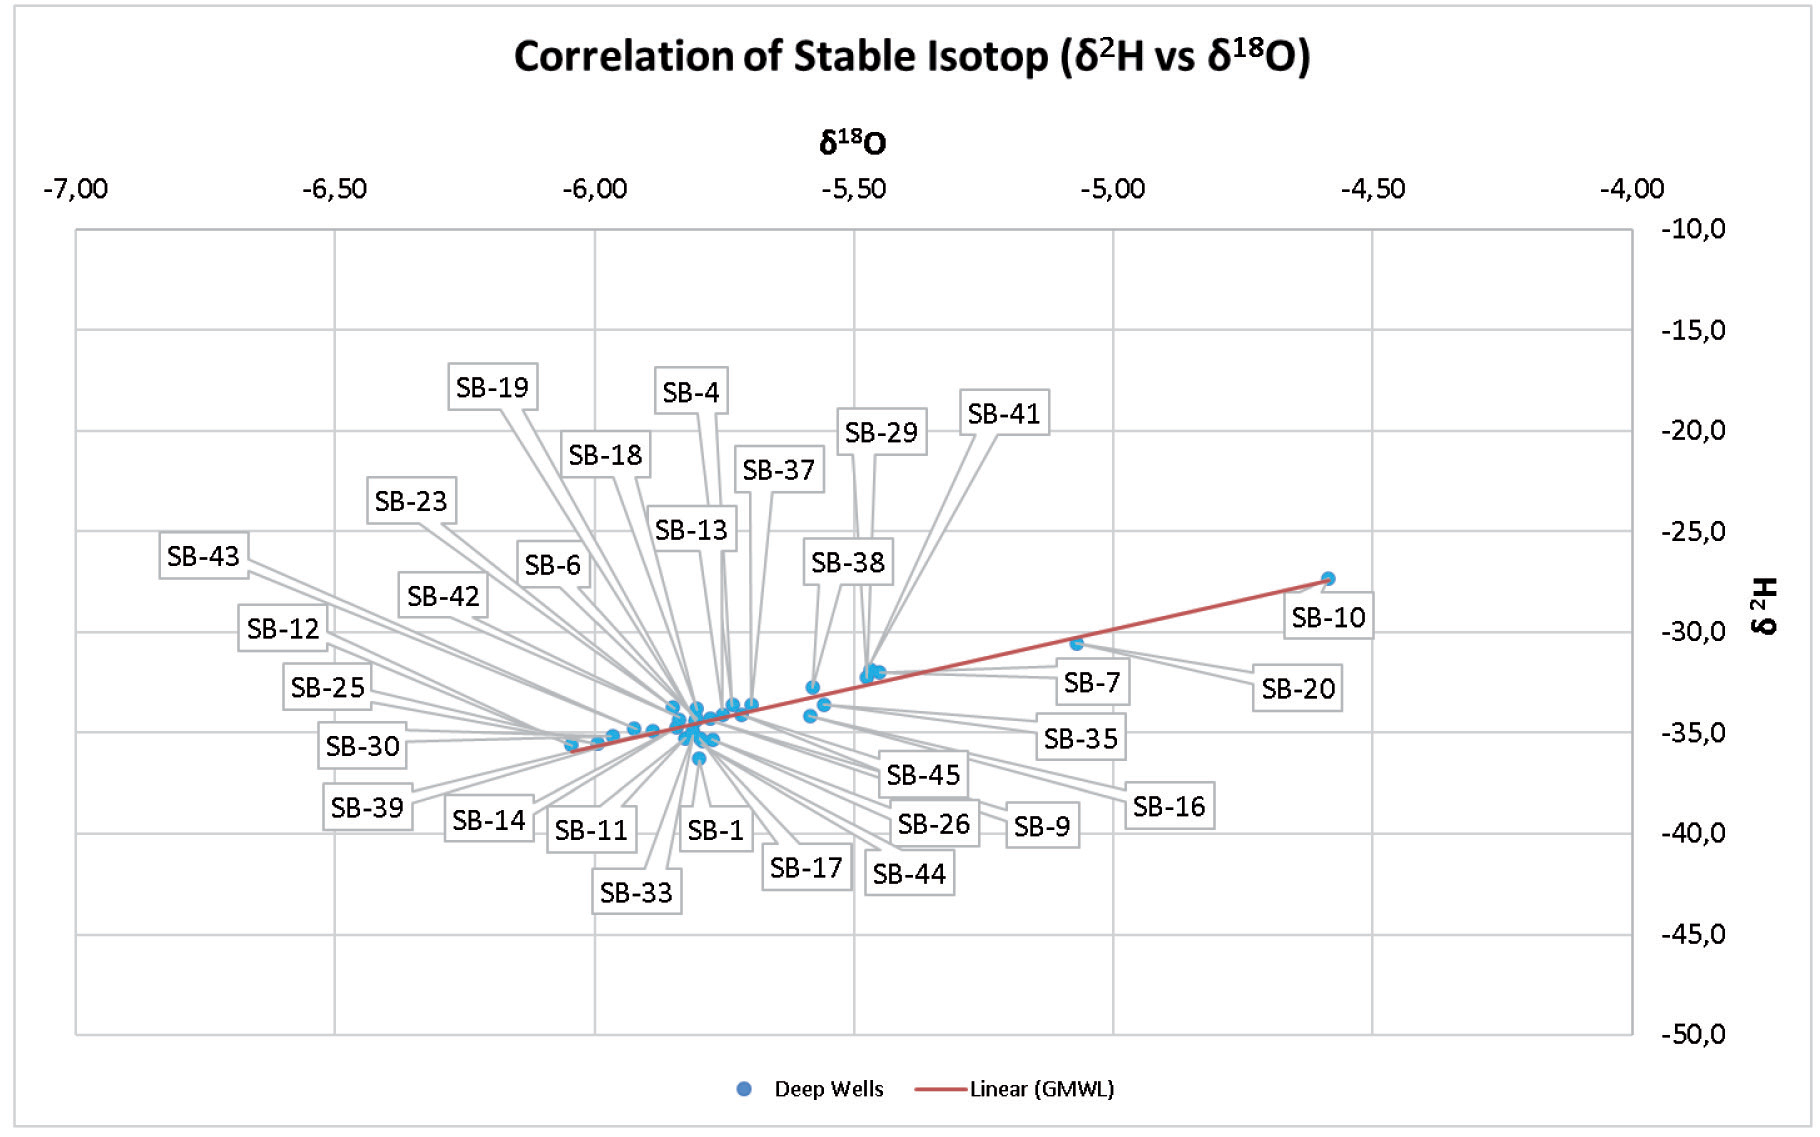
The majority of groundwater samples in deep wells were on the GMWL, with isotope values of 18O and 2H. The results showed that the further the samples were to the right, the higher the value, as shown in Fig. 11. Isotopes composition of 18O and 2H was moderate to high, while the DE value was less than 10 and was positive (Table 4). This indicated that the drainage system owned was relatively shallow, with conditions of high temperature and low humidity. This led to rainwater refilling, which was influenced by the evaporation process during infiltration, specifically at point SB-10. Point SB-10 was more influenced by secondary evaporation and was shown to have a lower amount of rainfall in the summer [30]. The positive value of DE was obtained through the calculation results in Equation (5). Based on this finding, it produced a positive DE value and was inversely proportional to the values of isotopes 18O and 2H, which were mostly negative. The difference in these values showed the effect of evaporation that occurred in the study area. Stable isotope analysis data showed that 30 samples of groundwater under pressure contained isotope -6.04-(-4.59) at an altitude of 2-102 meters above sea level. Based on the graph between 18O and 2H in Fig. 11, the groundwater samples were parallel to the GMWL, which had the equation D(2H) = ẟ18O+10 [31]. This showed that there was a variation in the height of the sampling. The stable isotope content of SB-10 Tugu was 18O-4.59‰, and the sample at this location had a heavier 18O value than other samples. This indicated a dominant salt influence, as shown by the EC value reaching 6,440 µhos/cm. The position of the sample points was very indented to the right, indicating that it was closer to the source or shallower than others. This was also supported by a DE value of <10, showing the presence of the groundwater source at a shallow position. SB-20 located in Tugu, had a stable isotope value of 18O-5.07. This groundwater was also likely to be close to the source, as marked by the value moving away to the right, but it was still influenced by global meteoric water. A total of 28 samples were on the left and attached to the GMWL, indicating that they experienced mixing. This water was obtained from within and was marked with a DE value of > 10. In the SB-1 sample, the stable isotopes point was away from the GMWL, indicating that evaporation had occurred. The groundwater in the study area originated from global meteoric water, which had experienced mixing and evaporation. However, this study could not determine the type of water mixing due to a lack of data.
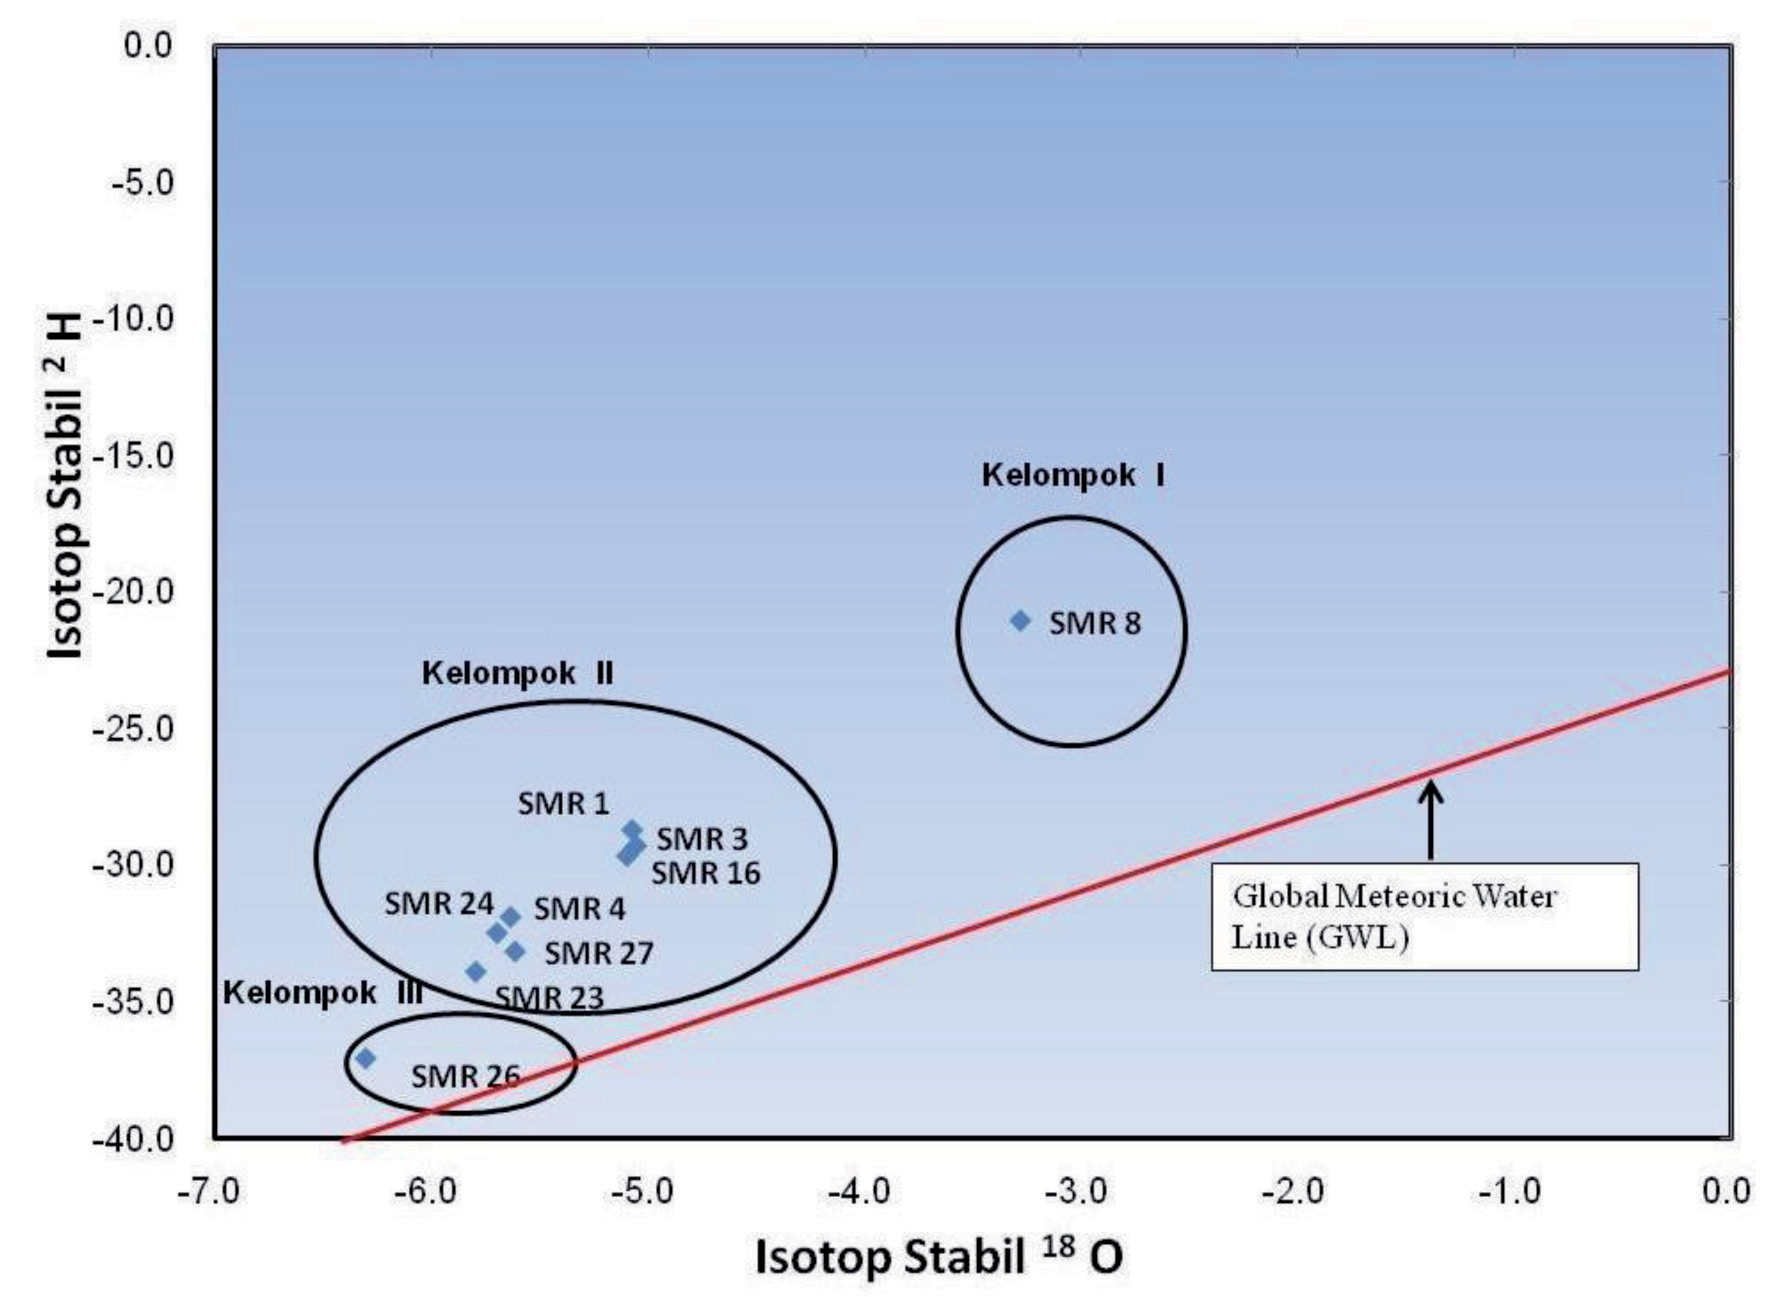
Sudaryanto and Lubis in [16] grouped stable isotope content in Semarang City into 3 different categories, namely Group I with a stable isotope value of 18O-3.3‰, located in the SMR-8 monitoring well at LIK Kali Work. Groundwater oxygen values in this location were higher and indicated the dominant effect of salt water, as marked by an oxygen weight of <-4%. The influence of water salt helped in determining the type of groundwater. Furthermore, the examined well contained NaCl and was situated at a depth of 125 m. Stable isotope groupings are presented in Fig. 12. According to [16], the well had penetrated the bedrock layer, consisting of rock sea clay. Furthermore, groundwater in the well was obtained from the surrounding area, which seeped into the aquifer layer and dissolved the constituent ancient salts. Group II with a stable isotopes value of 18O-5.8%, -5.7%, -5.1%, -5.1%, -5.6%, 5.1%, and -5.6% was found in SMR-23 North Kepundan, SMR-24 Karang Wulan, SMR-1 Citra Land Simpang Lima, SMR-3 Tanjung Mas, SMR-4 Kimia Farma, SMR-16 Sampokong, and SMR-27 Silence, respectively. The similarity in the values recorded in dug and monitoring wells indicated that groundwater was obtained from the local area. The results were in line with [38], which used tracers 14C and 18O on low plains low in Jakarta. Furthermore, all monitoring wells were of the NaHCO4 type except for SMR-16, Sampokong with Ca (HCO3)2. Ca (HCO3)2 wells experiencing changes in cation exchange due to the mixing of freshwater and saltwater during land formation [39]. Group III with scores of 18O-6.3 was found in the monitoring well SMR-26 PT. Mega Rubber was equipped with deep wells, reaching 90 meters in depth. This group of groundwater originated from areas with an altitude above 400 m, and was often found in the Semarang basin system, with aquifers consisting of alluvium and damar formations. In research, water that is not recommended for irrigation water is found in SB-7, SB-10, and SB-38 because of its high sodium and salinity. This is also supported by isotope data, which shows that the SB-10 sample is in a shallow aquifer with the value DE < 10 and is located close to the sea, so it is assumed to be susceptible to seawater intrusion. In samples SB-7 and SB-38, the sodium and salinity are high, possibly due to formation water, or trapped water. High sodium and salinity are not suitable for irrigation water because they can cause plants that do not have a tolerance level for salt to die. In this research and previous research from [16], there was both influence from seawater; this was supported by the results of SAR parameter analysis, which showed high sodium and salinity values.
Conclusions
In conclusion, the results showed that the surface geological conditions in the study area consisted of alluvium lithology units and damar formations, such as tuffaceous sandstone, breccia, and claystone. The plain had a steep hill morphology, and the region was often used as paddy fields, settlements, plantations, and industry. The pattern of groundwater flow owned by a confined aquifer was trending southwest-northeast. Based on the calculation of SAR and EC of groundwater, the area could be divided into 8 classes, including C2-S1 (medium-low sodium salinity), C2-S2 (medium-moderate salinity), C2-S3 (moderate salinity-high sodium), C3-S1 (high salinity-low sodium), C3-S2 (high salinity-moderate sodium), C3-S4 (high salinity-very high sodium), C4-S2 (very high salinity-moderate sodium), and C4-S4 (very high salinity-very high sodium). The results of the SAR classifier with EC showed that SB-9, SB-12, SB- 13, SB-14, SB-19, SB-25, SB30, SB-37, SB16, SB-17, SB-35, SB-41, and SB-42 could be used as good sources of irrigation. Furthermore, the calculation of isotopes 18O and 2H showed that all groundwater originated from global meteoric rainwater and had experienced mixing. All sample points could be used as the main source in assisting local communities to meet their needs, because at these points, groundwater was found in aquifers. The presence of proper supervision and management could maximize the use of groundwater in the surrounding area.

