


Introduction
Groundwater is of crucial global importance for human consumption, as well as for supporting habitats and sustaining the river base flow standards. It is often clear, colorless, high quality, and free of microbial contamination since the soil surface acts as a natural filter through the ground surface that requires less treatment [1].
In rural and urban areas where average precipitation is below the global average, groundwater serves as a primary source for industries and irrigation. It is estimated to account for 34% of the world’s total water resources [2]. Nowadays, the quality of groundwater is seriously threatened by the rising amount of soluble or dissolved chemicals originating from urban areas and industries, along with contemporary agricultural methods [3]. The composition of groundwater is influenced by various factors such as atmospheric inputs, interactions between soil, water, and rocks, as well as pollutants originating from activities like mining, clearing land, farming methods, acid rain, and discharge of household waste [4]. Further, open defecation, animal waste, and industrial discharge sites are major sources of contamination, contributing to the presence of harmful microbiological content in groundwater. This leads to water-related diseases, causing high mortality rates among children under five years old worldwide, particularly in rural areas of developing countries [5].
A comprehensive understanding of physio-hydrochemical elements and hydrogeological parameters is essential for enhancing water quality data and its management. The Water Quality Index (WQI) is particularly important in assessing water suitability for drinking purposes. Effective groundwater management practices contribute to the sustainability of water systems and help meet future demands [6]. Some advanced tools are required at the initial level to monitor the groundwater quality and its source of pollutants. The Geographic Information System (GIS) has emerged as a powerful tool for analyzing water quality parameters by means of water quality assessment and interpolation [7]. It is used for the storage, analysis, and visualization of spatial data in various domains, such as engineering and environmental fields [8]. GIS is a software-based technology that utilizes hardware assistance and proves beneficial for a wide range of geospatial applications. GIS encompasses a multitude of functions like collecting, storing, overseeing, retrieving, transforming, examining, simulating, and presenting geographic data. It establishes a connection between data and maps, enabling the integration of location data with several forms of descriptive data.
Many researchers have used data acquired through remote sensing methods in conjunction with GIS technology to assess and simulate groundwater for mapping spatial water resources. Ramamoorthy et al. [9] investigated the Nandhiyar sub-basin to identify suitable locations for the extraction of groundwater accurately. Gholizadeh et al. [10] utilized remote sensing methods with different sensors to evaluate water quality indicators, such as undesirable deposits, colored dissolved organic matter, chlorophyll levels, and various pollutants in various water bodies like groundwater, lakes, ponds, and oceans. It was concluded that large volumes of data can be examined using this significant approach. The advancement of picture interpretation techniques from basic linear regression to principal components analysis and neural networks will improve the accuracy and ease of manipulation of the procedures. Reshma [11] carried out numerical studies to identify areas with the potential for groundwater recharge at the Thiruverumbur block of the Trichy district in Tamilnadu. Samy Ismail Elmahdy and Mohamed Mostafa Mohamed [12] employed the Normalized Difference Vegetation Index (NDVI) and the Spectral Angle Mapper (SAM) algorithms to monitor changes in land use and cover in Ajman. The resulting maps were compared to a set of groundwater quality index variables, such as total dissolved solids (TDS), magnesium (Mg), chloride (Cl), and nitrate (NO3) in the shallow aquifer. The analysis confirmed that groundwater depletion is occurring in areas dependent on irrigation for agriculture, driven by uncontrolled population growth and variable climate change. A thorough understanding of the local climate, rainfall patterns, soil composition, and the relationship between surface and groundwater is necessary for groundwater conservation and management. Sharma et al. [13] conducted a thorough investigation of twelve hydro-chemical parameters and identified three factors using the Kaiser Criterion of the Eigenvalues. Shubhra Singh et al. [14] carried out an experimental investigation to assess the pollution potential of leachate generated from the solid waste disposal site and its impact on aquifers in the Varanasi environs, Uttar Pradesh, India. Physicochemical parameters of leachate and groundwater samples were determined to evaluate the leachate pollution index (LPI) as well as the water quality index (WQI). The leachate pollution index indicates that the leachate generated from the landfill site is moderately contaminated. Due to the impact of leachate on groundwater resources, it is suggested that an engineered landfill site be developed to control the leachate percolation into the groundwater. Zexin Lin et al. [15] developed a rural drinking water monitoring system based on wireless sensor networks. Additionally, an advanced GPS technique was employed to identify the areas that were severely affected. The nodes for all modules were created, including water quality monitoring, paths, collecting hubs, processing units, and deliverable portions, and activated on the collection of samples. It is found that there is a higher decrease in human intervention with this system. Hari et al. [16] explored the spatial analysis of total hardness, conductivity, and pH. Jesuraja et al. [17] conducted an evaluation of the groundwater quality and groundwater pollution index (GPI) in the coastal aquifers of Thiruchendur in Tamil Nadu by Wilcox diagram and found that 60% of samples unsuitable for irrigation due to more EC and acidity in groundwater. Further, it was noticed that about 10% of the assessed locations were deemed suitable for irrigation. Raja and Neelakantan [18] employed USEPA methodology to evaluate non-carcinogenic health hazards from exposure to fluoride and nitrate through groundwater consumption using the distribution plots method. The findings of spatial distribution graphs revealed that the majority of groundwater samples exhibit an alkaline nature. Adimalla et al. [19] examined the groundwater’s suitability for drinking and irrigation in the semiarid region of central Telangana, India, and outcomes demonstrated that Groundwater is the most crucial resource for both drinking and irrigation purposes in the above region. The maximum permissible levels of fluoride and nitrate were surpassed in approximately 51% and 71% of groundwater tests, respectively. It was concluded that the majority of the groundwater in the study region is deemed suitable for irrigation purposes. Muhammad Irfan [20] conducted a spatio-temporal analysis to evaluate Groundwater Level (GWL) characteristics across four different locations in South Sumatra. It was discovered that the tidal patterns on peat land in South Sumatera differed from those on the river in the same region. Statistical analysis indicates a significant correlation between GWL and both rainfall and soil moisture. The analysis found low GWL throughout the summer and high GWL during the rainy seasons. Qianqian Zhang et al. [21] studied the decline in groundwater quality in various regions globally, including China, using a water quality index (WQI) and multivariate statistical approaches. His research emphasizes the effect of pollution on the groundwater quality in the riverbed area of the Hutuo River. The study revealed that a sizable fraction of the groundwater samples in the area exceeded the very low grade of III for groundwater quality in China, with nitrate levels at 53.09%, sulfate at 18.52%, and total hardness at 83.95%. Bharath Singh Jebaraj et al. [22] concentrated on employing water quality sensors to create an affordable water quality monitoring system for Gummidipoondi Lake. The primary study parameters of the lake water are temperature, pH, and turbidity. The results generated by this method are used to identify contamination in the lake and notify the public works agency of the need to take preventative measures. Arun Prathap et al. [23] examine the spatial and temporal variations within the Thiruvallur district of Tamil Nadu, India. The analysis includes the quality of water with respect to pH and total hardness, along with the presentation of rainfall data. It is ascribed that the potential for groundwater, as well as the overall quality of the water, are increased by the heavy rains. It also lessens the groundwater’s hardness. Qirong Lu et al. [24] investigated various characteristics such as temperature, pH, TDS, conductivity, and turbidity of four water samples from different sections of the Li River using a newly developed sensor-based system. Additionally, an experiment was carried out using information gathered from particular river segments. The experiment results demonstrate that the system is relatively stable in measuring the aforementioned characteristics. The comparison of results indicates that the average measurement error for water quality indicators can be maintained within 5%.
Qianqian Zhang et al. [25] conducted statistical analyses, including principal component analysis and Pearson correlation coefficient analysis in the Shijiazhuang region, to investigate the underlying relationship between socioeconomic development and the quality of groundwater. The findings indicate the formation of significant depression cones at the original groundwater table over a span of 43 years. In addition, the chemical composition of shallow groundwater has significantly shifted from an HCO3-Ca (Mg) type to a more complex HCO3-SO4-Ca (Mg) type. The deterioration in groundwater quality is attributed to various factors such as population growth, socioeconomic development, and the over-exploitation of groundwater resources.
Harish Bisht et al. [26] conducted a hydrochemical analysis of meltwater from the Gangotri Glacier to investigate the chemical weathering processes and identify the sources of ions, along with the factors influencing the ionic composition, during the 2015 and 2016 ablation seasons. The hydrochemical analysis of the Gangotri Glacier meltwater reveals that it exhibits a slightly acidic nature, characterized by CaSO4 hydrochemical facies. The study indicates that carbonate weathering is a key geochemical process governing the meltwater chemistry of the Gangotri Glacier. The correlation matrix analysis concludes that both sulfide oxidation and carbonation play a role in influencing the rock weathering process.
Duan et al. [27] conducted a systematic analysis of the key factors contributing to the decline in surface water quality at 27 provincial boundaries in China. It was concluded that the percentage of building land, the level of economic development, the proportion of farmland, and the extent of social development were recognized as important factors influencing the aquatic environment at provincial boundaries.
Gopi et al. [28] conducted a study on the water quality in and around the Nagapattinam region, analyzing the geochemical properties and chemical composition of the water. The qualitative and quantitative assessments were carried out during the post-monsoon period (January) in 2020. The physicochemical parameters indicated that the quality of groundwater varied from one bore well to another. Elevated levels of total hardness and pH suggest the intrusion of saline water in the specific area. It is recommended to implement treatment technologies in the studied regions to reduce hardness and salinity, ensuring the provision of safe water to the public.
Ratnakar Dhakate [29] evaluated the effects of seawater intrusion from the coast into the inland areas of the Cauvery River Basin (CRB) and the Uppanar River Basin (URB) by analyzing the groundwater chemistry of major ions. The study employed Piper Diagrams, Hydrochemical Facies Evolution Diagrams (HFE-D), Gibbs Plots, and Principal Component Analysis (PCA), which includes Cluster and Factor Analysis, to detect seawater intrusion from coastal areas into inland aquifers and to explore the hydrogeochemical characteristics and salinization processes. The analysis concludes that the streams contribute to saline water intrusion in both URB and CRB; however, this intrusion is more pronounced in URB due to factors such as excessive water extraction, elevated tides, and aquaculture activities.
Objectives of the Study
The primary goal of the current investigation is summarized as follows:
To analyze the quality of the collected groundwater samples by evaluating their physical and chemical characteristics in the Tiruvallur district.
To generate geospatial maps that depict the spatial distribution of groundwater quality throughout the study area.
To assess groundwater quality through hydrogeochemical facies for its suitability for agriculture purposes.
Experimental
Study Area
The study area selected is the Thiruvallur district in Tamil Nadu, a mixture of urban and rural areas with a total area of 3422 sq km, as shown in (Fig. 1). The district is situated between the longitudes of 79o15’ E to 80o20’ E to latitudes of 12o15’ N to 13o15’ N. The district is characterized by sandy, red, non-calcareous, and coastal alluvial soil that has been blended with soda or alkali. In this region, the average annual rainfall is recorded at 1152.8 mm. The maximum and minimum temperatures range from 37.9ºC to 23.6ºC. This district is supported by several groundwater resources, with approximately 70 dug wells present in the area. For the selected blocks in Tiruvallur district, namely Madhavaram, Ponneri, Poonamallee, and Ambattur, a total of 11 dug wells have been identified in various villages. It includes Thiruthani, Thirvalangadu, Thiruvallur, Thirumullaivoiyil, Thiruverkadu, Madhavaram, Thiruvottriyur, Ennore, Periyapalayam, Gummidipoondi, and Redhills. The wells are selected in residential, industrial, and commercial places in the district. The latitudes and longitudes of sampling locations, along with sampling points within the study area, are illustrated in Table 1.
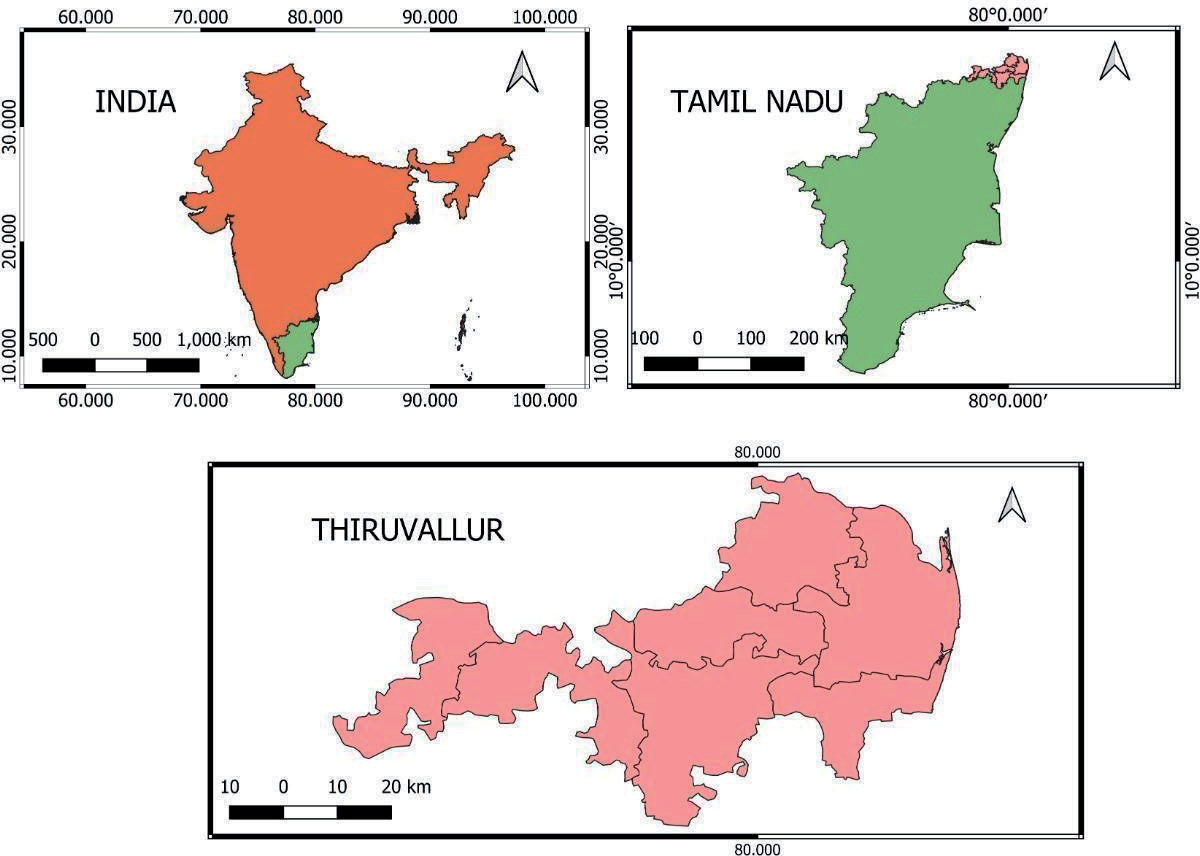
Table 1.
Sampling Locations and GPS coordinates.
Methodology
The methodology proposed for the study is discussed below. The study involves the collection of primary and secondary data.
Physicochemical Analysis
Groundwater samples were collected from 20 groundwater wells at 11 different locations in the study area in the year 2022 to evaluate both groundwater quality and major ion chemistry. The collection, preservation, and analysis of the samples were carried out in accordance with the standard methods outlined by the Central Pollution Control Board (CPCB) in 2007 [30]. As per the CPCB guidelines, the sampling locations are selected such that the samples taken are representative of the source from which water is obtained. The sampling points should include those that yield samples representative of the conditions at the water system, particularly points of possible contamination upstream and downstream of significant pollution outfalls like city sewage drains and industrial effluent outfalls.
The samples were collected four times, once in pre-monsoon (PRMS), April-May, and thereafter at intervals of 3 months covering monsoon and post-monsoon (POMS) periods. For the groundwater study, sampling will be done in a tube well, dug well, and hand pump, which are in use. In the present study, the samples were composed of open-dug wells and tube wells. The sample from an open well is collected using bottles at a depth of 30 cm below the surface of the water. Tube wells were continuously pumped for a minimum of 10 minutes before collecting the samples, and then the samples were collected using 1 L HDPE (high-density polyethylene) bottles. Sample bottles were rinsed and washed properly three times with deionized water before the sample collection. The container is attached with an inscribed tag or label. The GPS of sampling stations, sample number, and the sampling date should be clearly marked on the tag and the samples brought to the laboratory. The methods for estimating the variations in physicochemical parameters are provided in Table 2.
The measured physio-chemical characteristics such as EC, pH, TDS, TH, Chlorides, Alkalinity, Calcium, Magnesium, Sulfate, Nitrate, Sodium, and Potassium of collected samples are as per the standard, and the test procedures are presented in Table 3.
The acquired data on groundwater quality serves as a basis for the current study. Table 4 illustrates the comparison between measured parameters and the recommended standard limits in drinking water specified by the Bureau of Indian Standards (BIS 10500, 2012) [31] and the World Health Organization (WHO, 1983) [32-33] for the purposes of drinking and public health. The methodology adopted for this study is shown in Fig. 2.
Preparation of Spatial Database Using QGIS
GIS is a software-based technology that utilizes hardware assistance and proves beneficial for a wide range of geospatial applications. GIS encompasses a multitude of functions like collecting, storing, overseeing, retrieving, transforming, examining, simulating, and presenting geographic data. It establishes a connection between data and maps, enabling the integration of location data with several forms of descriptive data. It establishes a fundamental basis for the process of mapping and analysis, which finds application in scientific research as well as various industries. The Geographic Information System (GIS) interpolates the groundwater quality of unknown locations by utilizing the water quality parameters of known regions. This process creates a continuous surface that illustrates the spatial distribution of water quality characteristics over a large area [34].
Table 2.
Methods employed to estimate different physicochemical parameters.
Table 3.
Sampling locations and physicochemical parameters of selected groundwater samples in the Tiruvallur district.
Quantum Geographic Information System (QGIS) is an open-source, cross-platform desktop GIS that performs as GIS software, enabling users to compose and export graphical maps as well as analyze and modify spatial data. The Geospatial database for the study is prepared from QGIS by creating spatial thematic maps. The water quality maps are created through interpolation techniques. In the present study, the measured characteristics obtained from the physicochemical assessment of groundwater samples at 11 locations are integrated with QGIS. The Inverse Distance Weight (IDW) method is used for generating groundwater quality maps for the proposed study locations in the Thiruvallur district. This process creates a continuous surface that illustrates the spatial distribution of water quality characteristics over large areas [34-35]. The spatial distribution of water quality is shown in Fig. 3
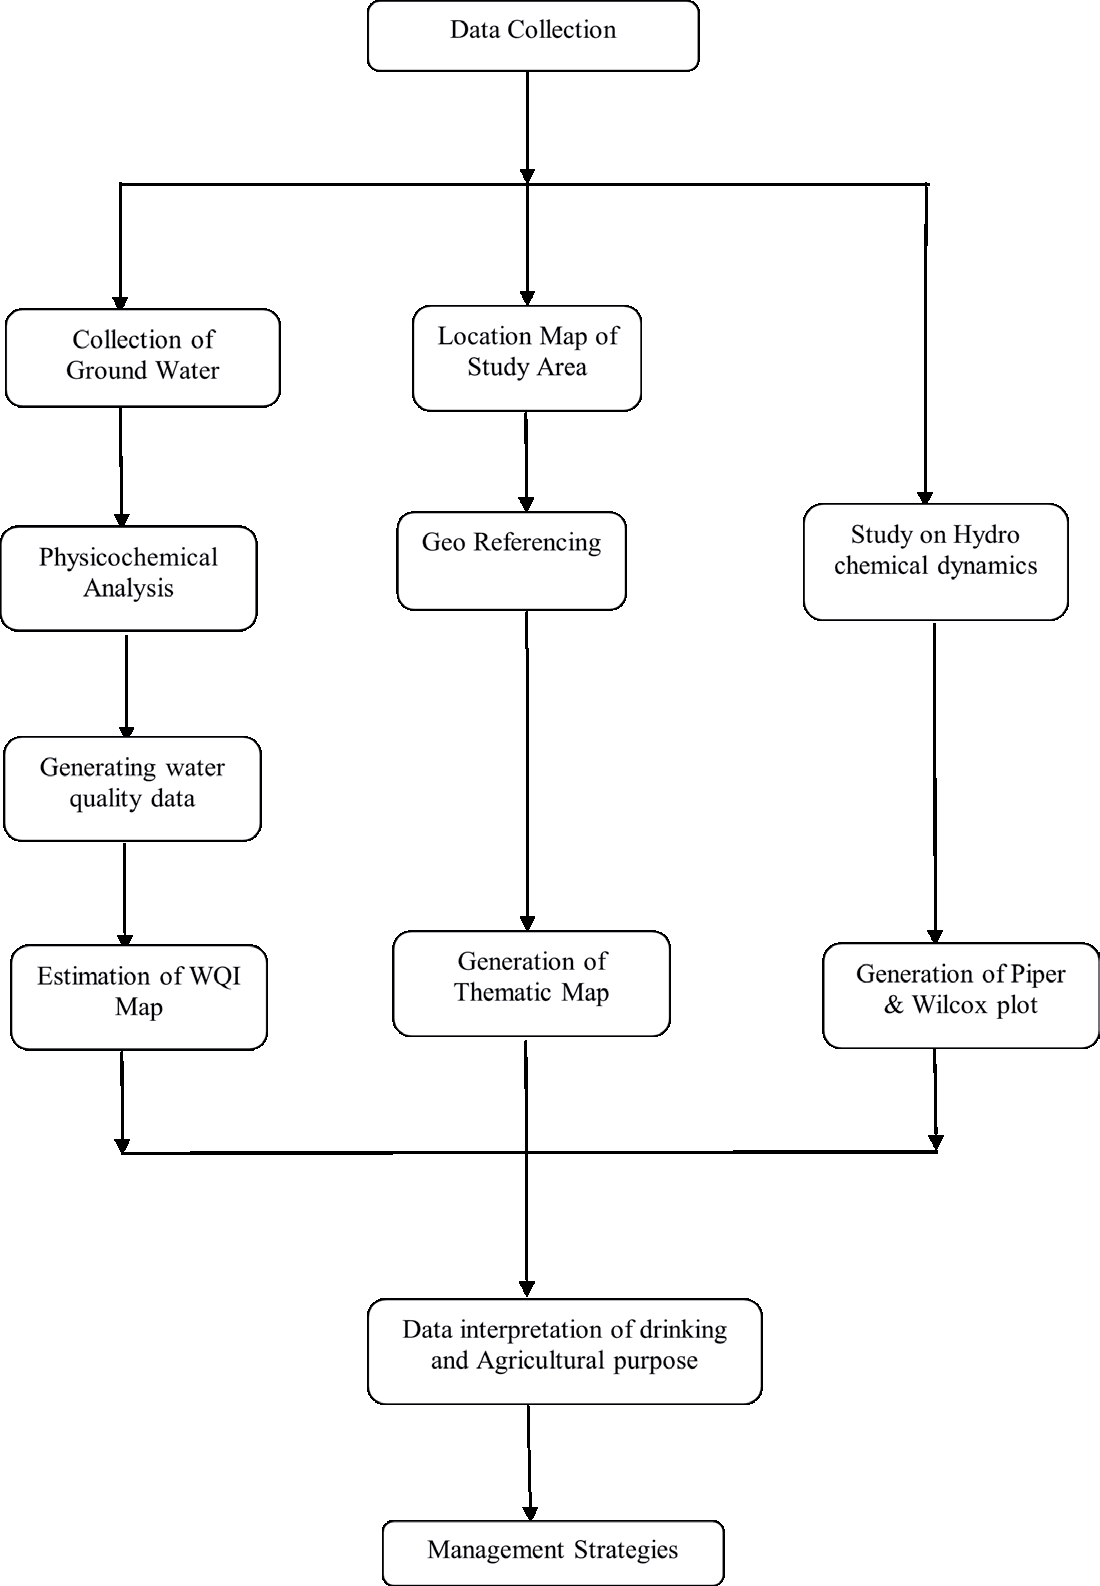
Table 4.
Statistical comparison of physio-chemical parameters (BIS and WHO standards).
The State Surface and Groundwater Resources Data Centre Chennai, Taramani, provided information on groundwater quality for the most recent ten years, from 2012 to 2022. It was categorized as secondary data for all the sample sites. The primary data on physio-chemical characteristics of groundwater samples collected from the study region were compared to the secondary data in this study [36]. The water quality comparative analysis diagrams generated using QGIS are illustrated in Fig. 4.
Generation of Water Quality Index Map
The Water Quality Index (WQI) is a numerical rating that reflects the quality of water based on several physical, chemical, and biological parameters. The overall Water Quality Index (WQI) is a valuable and unique assessment system obtained from the Weighted Arithmetic Index method that summarizes the water quality status. It is particularly useful in determining the best treatment method to satisfy specific water quality requirements [37].
A quality rating scale (Qi) was initially developed for each characteristic. The sub-index value of each characteristic is estimated by multiplying the rating scale with the respective estimated weighing factor. The sub-indices are combined to get the overall Water Quality Index. Table 5 displays the water quality rating assigned by the Bureau of Indian Standards (BIS) based on the Water Quality Index. According to the BIS guidelines, the WQI values are usually divided into five categories, each representing a range of water quality: less than 25 as ‘Excellent,’ 25–50 as ‘Good water,’ 50–75 as ‘Poor water,’ 76–100 as ‘Very Poor water,’ and greater than 100 (Fig. 5), which is unfit for drinking purposes.
Table 6 provides the calculated WQI alongside the corresponding status of chosen groundwater samples in the Tiruvallur district. The spatial databases built using QGIS were integrated with non-spatial data to create the maps depicting the spatial distribution of all water quality parameters as well as the WQI map, as shown in (Fig. 4). The calculated WQI values for the samples in the study area ranged from 11.71 to 84.83. The WQI results for groundwater in the Tiruvallur district showed that samples from 2 locations (18%), namely Thiruverkadu and Thiruvalangadu, fell into the ‘Excellent water’ category [38].
Samples from 7 locations (64%), namely Thiruthani, Thiruvallur, Madhavaram, Thiruvottriyur, Ennore, Periyapalayam, and Gummidipoondi, were classified as ‘Good’ water. The quality of water status in 2 locations, namely Redhills and Thirumullaivoiyil (18%), was categorized under the ‘Very Poor water’ category.
Results and Discussions
Hydrogen Ion Concentration (pH)
pH is the measure of acid-base equilibrium in natural water. The pH levels in the groundwater samples vary from 5.7 to 7.06, with a mean value of 6.54 in the area considered for the present study. The pH of Thirvalangadu was the highest at 7.06, and the lowest pH of 5.75 was noticed in Redhills. The comparison of results also revealed that all the locations except Thirvalangadu have a pH below 7. As the Thirvalangadu location is regarded as residential, a pH shift would have an impact on the local inhabitants. The diverse geomorphology variance within the soil composition can be attributed to Thirvalangadu’s higher pH level. Specifically, the areas with dense rocks and minerals with high alkalinity in the above region contribute to an overall increase in pH levels. The pH values of all the tested samples fall within the limits for drinking as well as irrigation (Table 4) prescribed by both BIS and WHO. The test results also indicate that a significant portion of the study region exhibits a pH value equal to or below 6.5, indicating a moderately acidic nature of the groundwater.
Total Dissolved Solids (TDS)
TDS refers to a quantification of the collective presence of both organic and inorganic compounds. It indicates aesthetic characteristics that show the existence of diverse chemical pollutants. TDS of collected samples varied between 324 and 1072 mg/l, with an average value of 634.36 mg/l. The TDS of each sample conforms to the permissible limits as per the BIS guidelines. However, samples from Thiruttani, Thiruvallur, Thiruverkadu, Thiruvottriyur, and Periyapalayam are greater than the WHO prescribed limits. It could be due to the leaching of salts from industrial effluents, the deposition of scale on the inner surface of the well, and other human-made sources like urban areas and agricultural fields. The increase in TDS due to scale formation can be minimized by regular cleaning and maintenance of the well. The analysis of TDS rate changes over a 10- year period starting from 2010 suggests that the wells in Thirvalangadu, Thiruverkadu, and Redhills (Fig. 4a) exhibit minimal variations in TDS rates and generally maintain low levels of TDS. These wells have been kept in good condition as a result of maintenance efforts, and rainfall is another element that significantly lowers TDS levels and keeps them within acceptable levels. The wells located in Thirumullaivoiyil and Gummidipoondi demonstrate a marginally higher TDS rate, surpassing the permissible limits recommended by the World Health Organization (WHO). It can be attributed to the presence of toxins and filthy water seeping into the groundwater source.
The measurement of the salinity level in groundwater is indicated by its electrical conductivity. It makes an estimate of the TDS or total dissolved solids in water. The natural conductivity of fresh water varies from very low values of 30µS/cm to very high values of 2000 µS/ cm, which is unsuitable for irrigation. The electrical conductivity varied from 540 to 1787 μs/cm with an average value of 1057 μs/cm in the selected study area. The wells in Thirumullaivoiyil, Thiruverkadu Thiruvottriyur, and Gummidipoondi exhibit notable differences in their electrical conductivity rates. However, these wells fall within the acceptable range of electrical conductivity. The electrical conductivity is lower in the areas such as Thiruvalangadu, Madhavaram, Redhills, and Ennore, and well below the permissible limit. This can primarily be attributed to the decrease in TDS within those specific regions.
Fig. 3a.
Spatial Patterns of PH Distribution. Fig. 3c. Spatial Patterns of TDS Distribution. Fig. 3b. Spatial Patterns of Electrical Conductivity Distribution. Fig. 3d. Spatial Patterns of Total Hardness Distribution. Fig. 3e. Spatial Patterns of Chlorides Distribution.
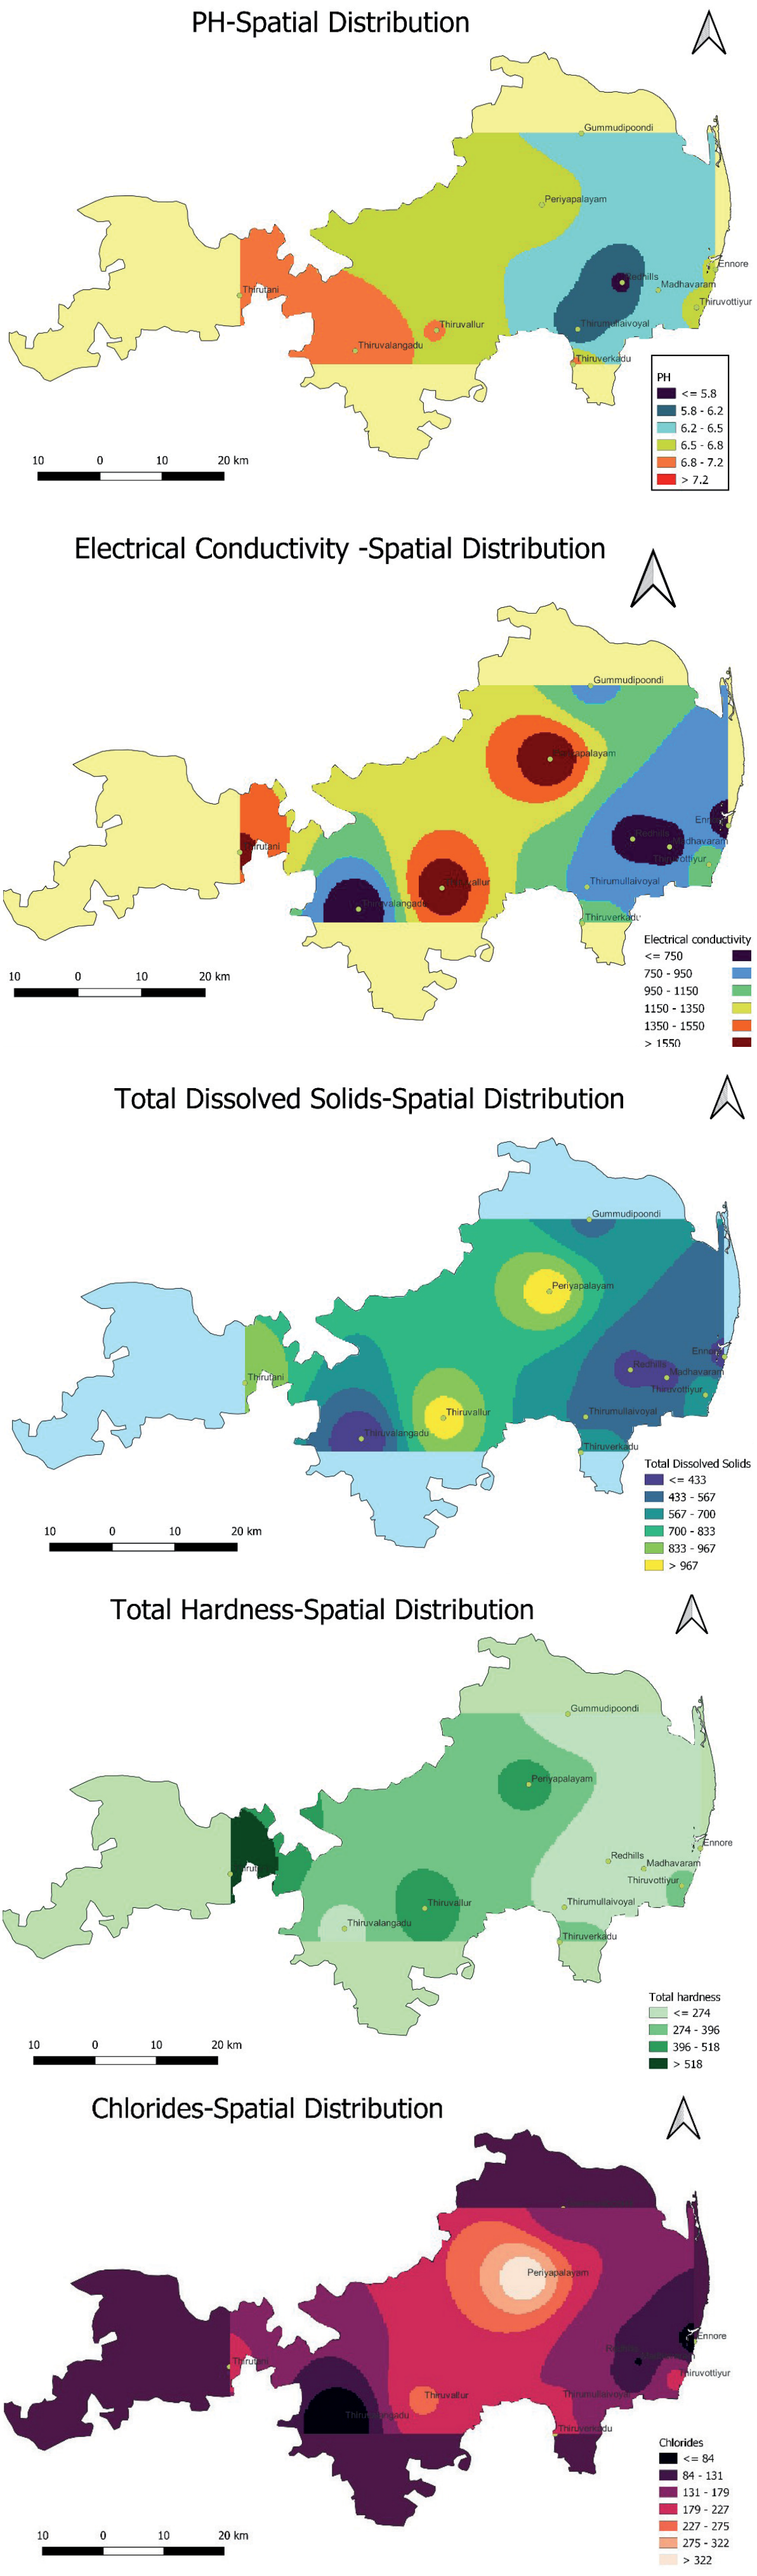
Fig. 4a.
Total Dissolved Solids Comparison in 2012 and 2022. Fig. 4b. Electrical Conductivity Comparison in 2012 and 2022. Fig. 4c. Comparison of Total Hardness in 2012 and 2022. Fig. 4d. Comparison of Chlorides in 2012 and 2022.
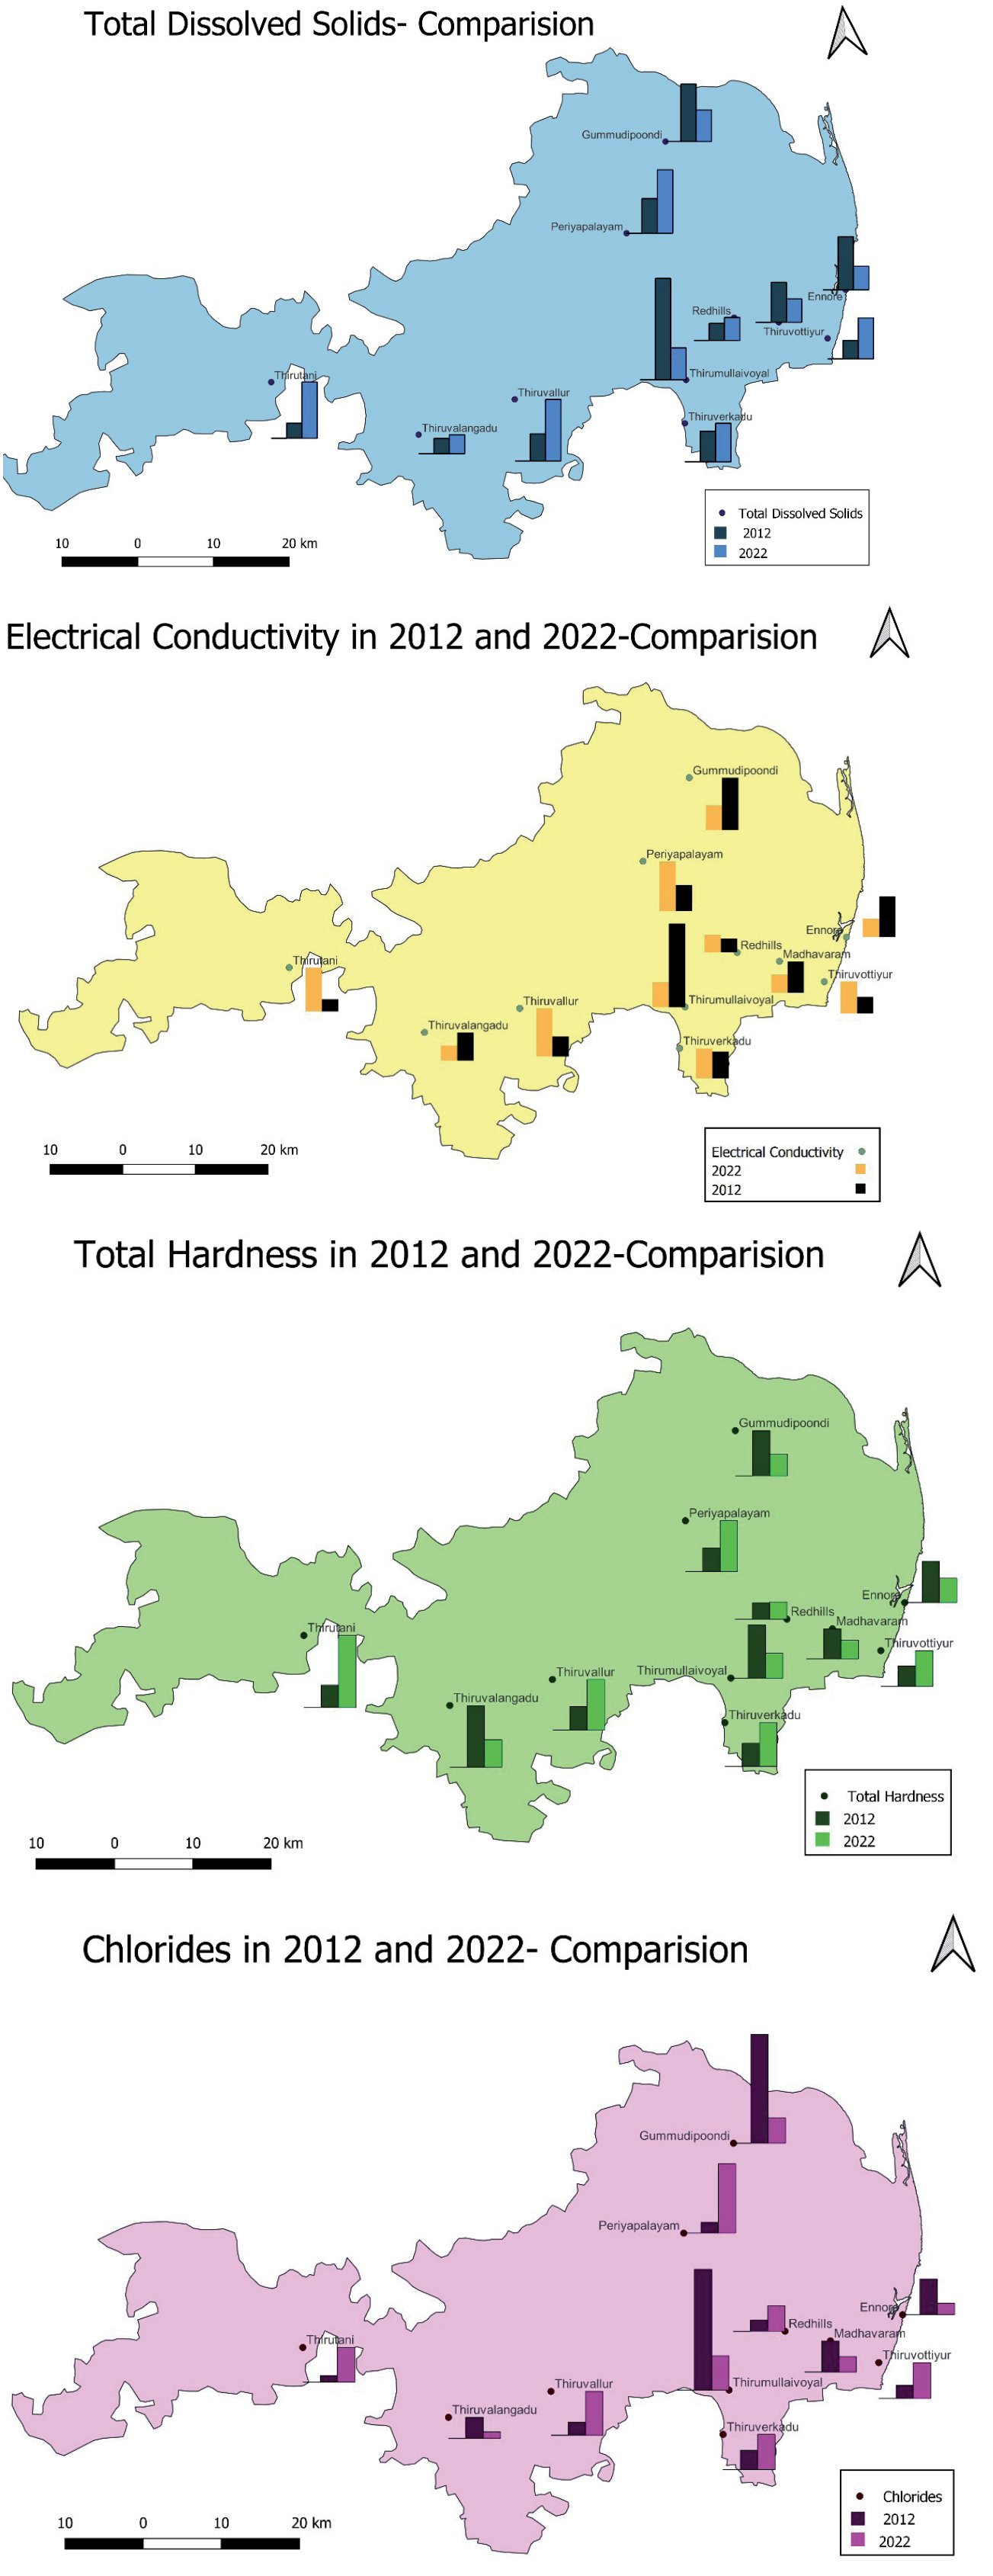
Table 5.
BIS Guidelines on Water Quality Status.
Table 6.
Computed Water Quality Index and inference of Water Quality Status.
Table 7.
Agricultural appropriateness of groundwater samples in the study area.
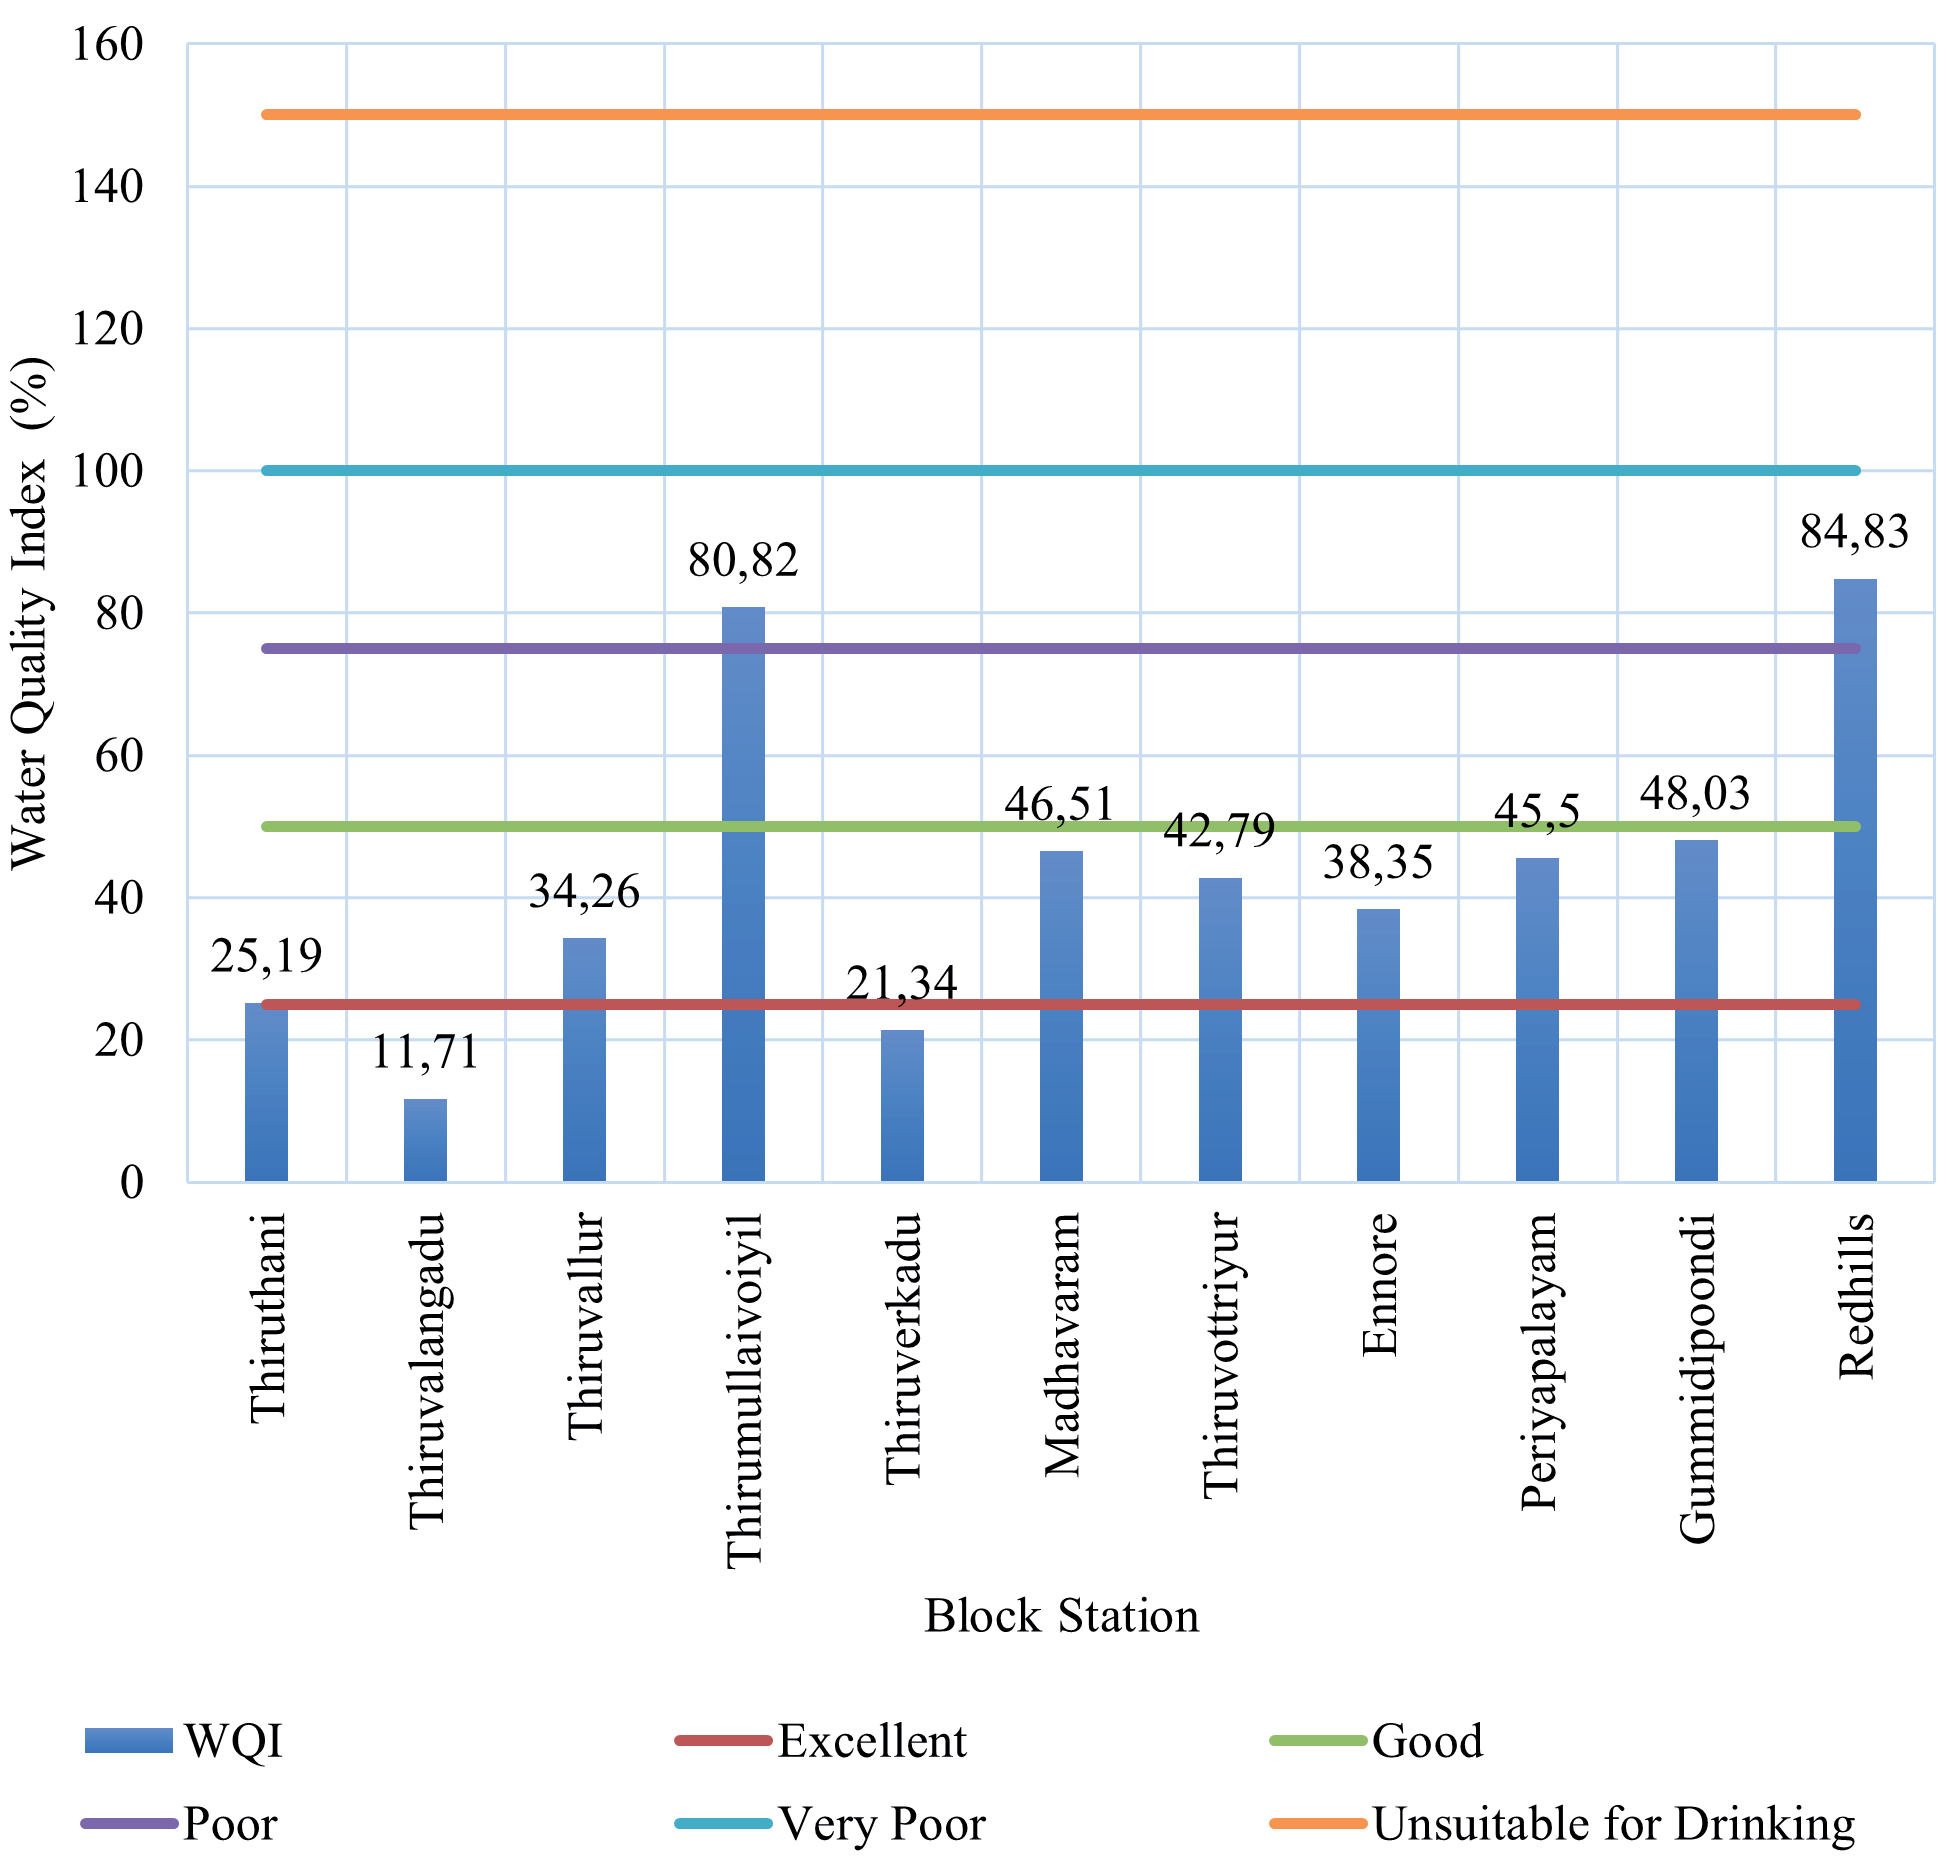
Table 8.
Comparison of land use statistics from 2011 to 2021 in the Tiruvallur district.
Table 9.
Maximum and minimum concentration of major cations and anions in groundwater across the Tiruvallur and Kancheepuram district.
Electrical Conductivity (EC)
The spatial distribution of the Electrical Conductivity rate over a period of 10 years (Fig. 4b) demonstrates a similar pattern of increment in the electrical conductivity in water as observed in TDS. There has been a marginal increase in electrical conductivity in the areas of Thiruverkadu and Redhills in the last ten years. Nevertheless, due to their increased TDS value during the previous ten years, wells in Thiruthani, Thiruvallur, and Periyapalayam exhibit a sharp increase in electrical conductivity. It also exceeds the permissible limits prescribed in BIS standards.
Total Hardness
The hardness in water is caused by the presence of dissolved salts, primarily calcium and magnesium compounds. The groundwater samples exhibit hardness levels ranging from 152 to 640 parts per million (ppm), with an average hardness of 312 ppm in the study area. The hardness of Thiruthani was highest at about 640 ppm and the lowest at 152 ppm was noticed in Redhills. The wells in all the locations except Thiruthani are having hardness values within acceptable- permissible limits of BIS standards. With the exception of Thiruthani, the wells in the remaining locations have hardness values that fall within the acceptable and permissible limits set by the Bureau of Indian Standards (BIS) standards. This may be attributed to the excessive application of non-treated chemical and mining effluents in the Thiruthani zone. There has been a significant increase in water degradation in the above-mentioned zone compared to the conditions observed in 2010. Despite an increase in the number of industries, Thirvalangadu, Thirumullaivoiyil, Madhavaram, Gummidipoondi, and Redhills are among the places where water hardness (Fig. 4c) has decreased. This observation suggests that the effluents generated by industries in the vicinity of these areas have undergone effective treatment processes. There is a marginal increase in hardness observed in Redhills, which indicates a well-maintained dug well.
Chloride (CL-)
Chloride is a prominent inorganic anion present in water. The primary source of groundwater contamination in the Thiruvallur district is the discharge of domestic sewage, with chloride concentrations ranging from 36 to 370 mg/l, as indicated in Tables 3 and 4, with a mean value of 160 mg/l in the area considered for the present study. The chloride concentration of Periyapalayam was the highest, about 370 mg/l, and the lowest value of 36 mg/l was noticed in Thirvalangadu. The Chloride levels in groundwater in the above region are safely within the BIS’s maximum desirable limit of 1000 mg/L. However, the wells in all the locations except Periyapalayam have chloride concentrations within permissible limits of WHO standards. The spatial distribution of chloride concentration rate over a period of ten years (Fig. 4d) indicates that the aforementioned parameter in water declines in places like Gummidipoondi, Thirvalangadu, Thirumullaivoiyil, Madhavaram, and Ennore. However, wells in Thiruthani, Thiruvallur, Thiruverkadu, Thiruvottriyur, and Redhills show a drastic increase in chloride concentration in groundwater in the last ten years but well below the acceptable-permissible limits of BIS and ISO Standards. The results of the computed Water Quality Index and the status of selected groundwater samples in the Tiruvallur district are presented in Table 6.
Alkalinity
The presence of carbonates, bicarbonates, and hydroxides contributes to the alkalinity of water. Alkalinity also indicates the water’s capacity to absorb hydrogen ions (H+). An excess of alkalinity in water can be detrimental to irrigation as it may lead to soil damage and a reduction in crop yields. The total alkalinity of the samples ranged from 230 mg/l to 488 mg/l, as indicated in Table 3. The Bicarbonate concentration of all the water samples in the Thiruvallur district was substantially below the permissible limits set by the Bureau of Indian Standards (BIS), as shown in Table 4. In this region, samples in the regions of Thirvalangadu, Thiruvallur, and Thirumullaivoiyil exhibit total alkalinity levels above the desirable limit set by the WHO, as illustrated in Table 4.
Calcium (Ca2+)
The calcium hardness in the groundwater of the Thiruvallur region ranged from 36 mg/L to 100 mg/L. All the groundwater samples collected from the above region fall within the permissible limits prescribed by the BIS, as shown in Table 4.
Magnesium (Mg2+)
The magnesium hardness in the groundwater of the Thiruvallur zone was measured to range from 17 mg/L to 92 mg/L. The magnesium content in all the groundwater samples falls within the BIS desirable limit, as presented in Table 4. However, the samples from Thiruthani, Thiruvallur, Thirumullaivoiyil, Thiruvarur, Madhavaram, Gummidipoondi, and Redhills have a magnesium level above the WHO acceptable limit.
Sulfates (SO4-)
All types of water naturally contain sulfates. However, significant concentrations of sulfates in water are primarily attributed to drainage wastes. An excess of sodium and magnesium sulfate can lead to cathartic effects. The sulfate content of groundwater in the Thiruvallur district ranges from 29 mg/l to 182 mg/l, as indicated in Table 4. The sulfate content of collected groundwater samples was found to be within the acceptable limit set by the BIS.
Nitrate (NO3-)
Surface water has low nitrate levels, while high concentrations of nitrate levels are observed in some groundwater sources. The primary source of nitrate is the biological oxidation of nitrogen-containing compounds from sewage. It was ascribed that the nitrate concentrations in each sample ranged from 2 mg/l to 75 mg/l. The nitrate concentration of each water sample was within the permissible BIS limit, except in the zone of Thirvalangadu, as shown in Table 4.
Sodium
The sodium concentration of all the water samples was substantially below the detectable limits set by the WHO except in the Thiruvallur region, as shown in Table 4.
Potassium
The samples exhibited potassium levels ranging from 2 mg/L to 5 mg/L, clearly indicating that they are well below the WHO permissible limit, as shown in Table 4.
Kelly Index
The Kelly index (KI) for a groundwater sample is calculated as the ratio of the sodium concentration to the sum of the concentrations of calcium and magnesium. The KI of overall samples ranges from 0.67 to 2.26. The samples collected from locations in Thiruthani, Madhavaram, Thiruvottriyur, Gummidipoondi, and Redhills have a KI value of less than 1 and can be used for irrigation. The samples from Thirvalangadu, Thiruvallur, Thirumullaivoiyil, Thiruverkadu, and Ennore locations exhibit a KI between 1 and 2, suggesting they are marginally suitable for irrigation (Table 7). However, the Kelly index in the Periyapalayam region exceeds 2, rendering it unsuitable for irrigation.
Magnesium Hazard
The ratio of sodium concentration to the total calcium and magnesium concentrations determines the magnesium hazard of a groundwater sample. Table 7 illustrates the overall investigated samples’ magnesium ratio values range from 27.78 to 57.43. The groundwater samples from three regions, namely Thiruthani, Madhavaram, and Gummidipoondi, have a magnesium ratio exceeding 50, making them unfit for irrigation. Using this water can adversely affect crop yield by increasing the soil’s alkalinity.
Permeability Index
The permeability index of groundwater is determined as follows:
PI =[(Na + √HCO3) ∕ (Ca + Mg + Na)] x 100
The majority of the groundwater samples are classified as class 1, and the other samples as class 2. Therefore, all the samples are deemed suitable for agricultural uses (Fig. 7).
Hydrochemical Facies
The identification of hydrochemical facies serves as a valuable tool for assessing water chemistry.
Piper Plot
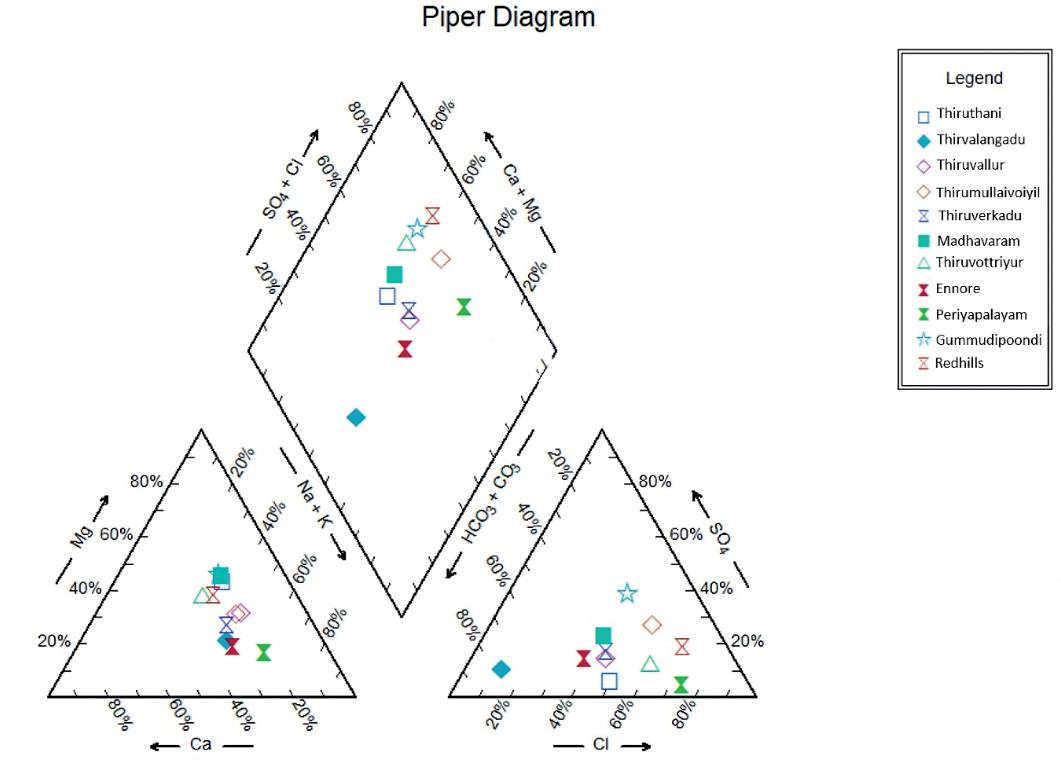
The geochemical composition of water samples, derived from surface or groundwater sources, is illustrated through graphical representations known as Piper diagrams. It also depicts the proportional composition of major ions within the solution. The water facies are categorized using the above trilinear diagram based on the dominating ions. This diagram also reveals that most water samples in these locations are characterized by calcium and magnesium dominance in cations and chloride or sulfate dominance in anions. There is a significant presence of mixed water types, suggesting complex water chemistry in this region.
The Piper Diagram (Fig 6.) consists of a geometric arrangement featuring two external triangles and a central diamondshaped quadrilateral. The diagram’s bottom left triangle represents the concentration of cations such as Calcium (Ca2+), Magnesium (Mg2+), Sodium (Na+), and Potassium (K+) in % mg/L. The total concentration of Ca2+, Mg2+, Na+, and K+ ions is represented by the width of the corresponding field in this triangle. Most of the samples are clustered towards the lower part of the triangle, indicating a higher proportion of calcium and magnesium dominance. There are fewer points in the upper part of the triangle, indicating that the cations are less dominant. The proportions of these cations can provide valuable insights into the origins of the ions and the interactions between water and rock.
Anions such as bicarbonate (HCO3-), sulfate (SO42- ), and chloride (Cl-) are displayed in the bottom right triangle of the diagram. The concentrations of anions reveal valuable information about the source of water and signify the presence of pollutants. The majority of the samples are towards the lower right part of the triangle, indicating a higher proportion of chloride. Fewer samples are in the upper part, showing these anions are less dominant.
Points obtained from the triangular plots of cations and anions are superimposed upon the inner diamond-shaped quadrilateral structure. The combined concentrations of HCO3-, SO42-, and Cl- are represented by the width of the field within this quadrilateral. Many samples are concentrated in the Upper Left Quadrant, indicating water types rich in calcium, magnesium, and sulfate. This is typical of gypsum or dolomite waters. Some points are closer to the center, indicating mixed water types with no dominant cations or anions. It can further categorize the samples into five distinct regions. The Region I (Upper Left Quadrant) is characterized by the dominance of Ca2+- Mg2+ - SO42-. It is occupied by the samples from Thiruthani, Thirumullaivoiyil, and Thiruvottriyur, indicating a slight dominance of alkaline earth metals over alkali metals and the presence of strong acidic anion compared to weak acidic anion. Region II (Upper Right Quadrant) comprises the dominance of Ca2+- Mg2+ - Cl- (Upper Right Quadrant). This category includes samples Thiruvallur, Thiruverkadu, Madhavaram, Periyapalayam, and Redhills. Region III is dominated by Na+- K+- SO4- whereas Region IV comprises Na+- K+- CL- dominance. The regions considered for the present study did not belong to both of the zones. Region V is composed of mixed water types in the central region. Ennore, Gummidipoondi, and Thiruverkadu also appear in the Ca-Mg-Cl zone. The significant intersection of the HCO3-/SO42- and Ca2+ /Mg2+ fields suggests that the water is of the bicarbonate type.
Wilcox Plot
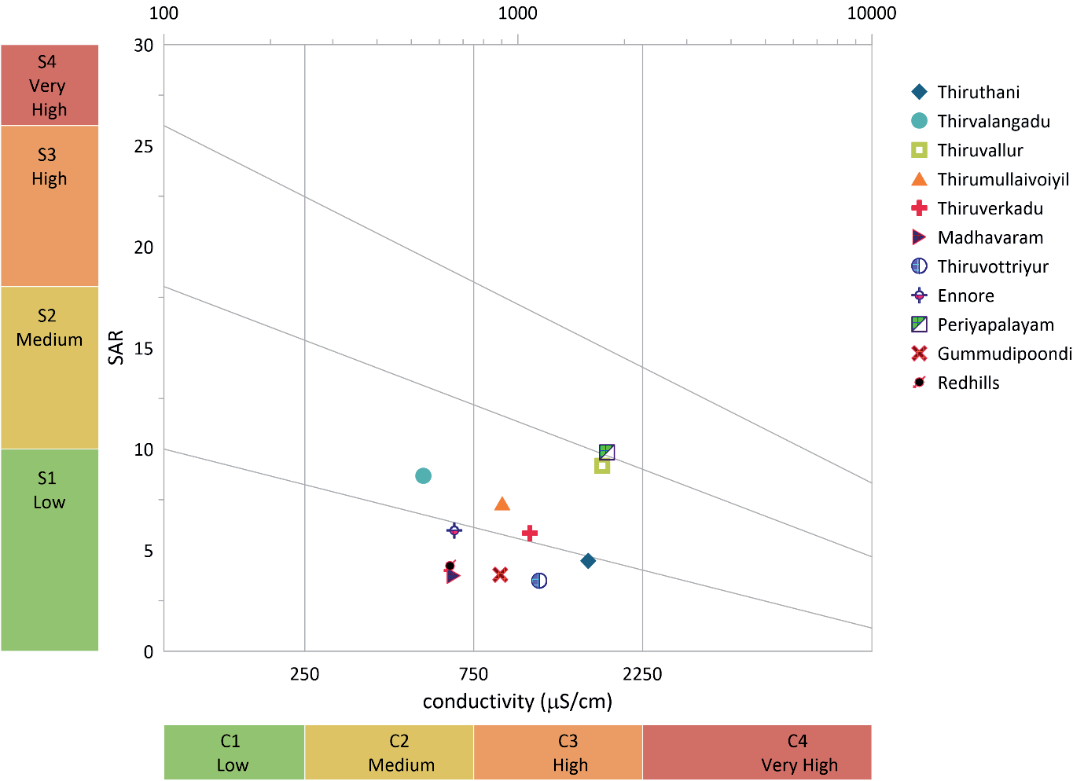
The Wilcox diagram, a valuable tool, is utilized to categorize water samples according to their levels of sodium and salinity [39]. This classification aids in the assessment of sodium hazards in irrigation water. It also helps to prevent crop damage and soil degradation caused by excessive sodium. Typically, the diagram represents sodium percentage (Na%) on the x-axis and salinity (expressed as either electrical conductivity (EC) or sodium adsorption ratio (SAR)) on the y-axis. On the graph, each water sample is depicted as a point based on its sodium percentage (Na%) and salinity levels. The zones C1, C2, C3, and C4 represent water samples categorized by low, medium, high, and very high levels of sodium hazard and salinity. The electrical conductivity of various zones, such as Thiruvalangadu, Madhavaram Red Hills, and Ennore, ranges between 540 to 662 μs/cm. These zones fall under the C2 zone, characterized by medium salinity and low sodium hazard. It is conducive for cultivating a wide range of crops. Water in regions like Gummidipoondi, Thiruvottriyur, and Thiruthani exhibits low sodium hazard but high salinity levels. This may necessitate specialized management practices for specific crops. The areas of Thiruvallur, Thirumulaivoiyil, and Thiruverkadu, fall within a medium sodium and high salinity zone. Management practices may be needed to alleviate salinity-related challenges. Almost all locations are situated in zones with low to medium sodium hazards but high salinity except Periyapalayam, where water quality exhibits both high sodium hazard and high salinity. Hence, it may be appropriate for irrigation only with minimal management. It is ascribed that this illustration can assist farmers and water managers in making informed decisions regarding irrigation practices, such as choosing crops that can withstand high sodium levels or applying soil amendments to enhance water quality.
Correlation Matrix
The trend in water quality can be determined using a correlation matrix approach. Any strong positive correlation can help reveal relationships between variables, allowing for a deeper understanding of water quality dynamics [40]. This information can then be used to develop targeted water treatment techniques and strategies to improve and maintain water quality. Python programming was employed to calculate the correlation matrix for five parameters, with the correlation coefficients presented in Fig. 8. A correlation value of less than 0.5 suggests a poor correlation, while a value greater than 0.5 is indicative of a strong correlation.
A very strong positive correlation between EC with TDS (1), Total hardness (0.86), and Cl-(0.87) except pH implies that this region is experiencing leaching of salts from groundwater, contamination due to human activities such as urbanization industrialization, overpopulation, deforestation, mining, intensification of tourism, and fishing, along with a reverse ion exchange processes.
There is a strong positive correlation between pH and total hardness in all the locations considered in the present study. The increase in total hardness has been impacted by shifts in environmental and geological conditions, such as the over-exploitation of groundwater, as well as pollution from human activities. Conversely, pH exhibits a poor correlation with Electrical Conductivity (EC) and Total Dissolved Solids (TDS). Further, it is noticed that the correlation between pH and chlorides is insignificant. This may be attributed to the lower concentration of chloride ions in groundwater in all locations.
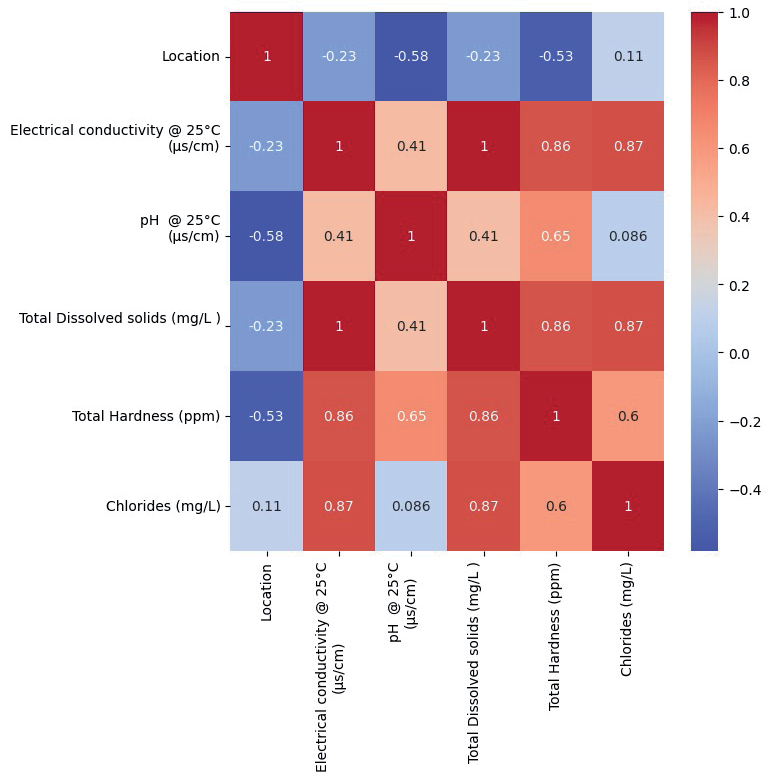
The correlation matrix also reveals a strong linear positive correlation between total dissolved solids (TDS) and electrical conductivity (EC) with a correlation coefficient equal to 1. TDS has an insignificant correlation with pH in all the places covering the region and a positive correlation with Total hardness and Cl-. It could be mainly due to manmade activities. Soil and water pollution is further intensified by agricultural practices, such as industrial metal mining, landfill waste, and the use of pesticides and herbicides in food production, along with animal and human waste and poor drainage systems.
An insignificant correlation between chloride and pH is observed, while a positive correlation with EC, Total Hardness, and TDS is seen in all the regions. This suggests the leaching of secondary salts, contamination from human activities, and the occurrence of reverse ion exchange.
Management Strategies
Rainwater harvesting (RWH) is gaining recognition as a vital part of urban water management, offering several benefits, such as increasing water supply, reducing flood risks, and enhancing environmental sustainability. To design an effective RWH system, it is crucial to select storage tanks or reservoirs that are appropriately sized based on factors like rainfall patterns, roof size, and water needs. The catchment area should be large enough and properly designed to efficiently direct rainwater to storage systems. Incorporating first-flush diverters and filters helps remove debris, dust, and contaminants before the water enters the storage system. Moreover, designing overflow systems is also essential. Prioritizing water usage is key, especially in areas with limited rainfall. In such regions, combining rainwater with other sources, such as treated wastewater or municipal water, can provide a more reliable water supply. Additionally, rainwater can be used for groundwater recharge by constructing infiltration wells, trenches, or percolation pits, which is particularly useful in areas with declining groundwater levels. Analyzing local rainfall patterns and historical data can optimize RWH system designs and help predict water availability. RWH management can be further enhanced by using rainfall data analysis and remote monitoring systems to track performance. By integrating these strategies, communities, industries, and governments can develop sustainable rainwater harvesting systems that conserve water, reduce reliance on traditional water sources, and promote environmental sustainability.
Land Use Statistics
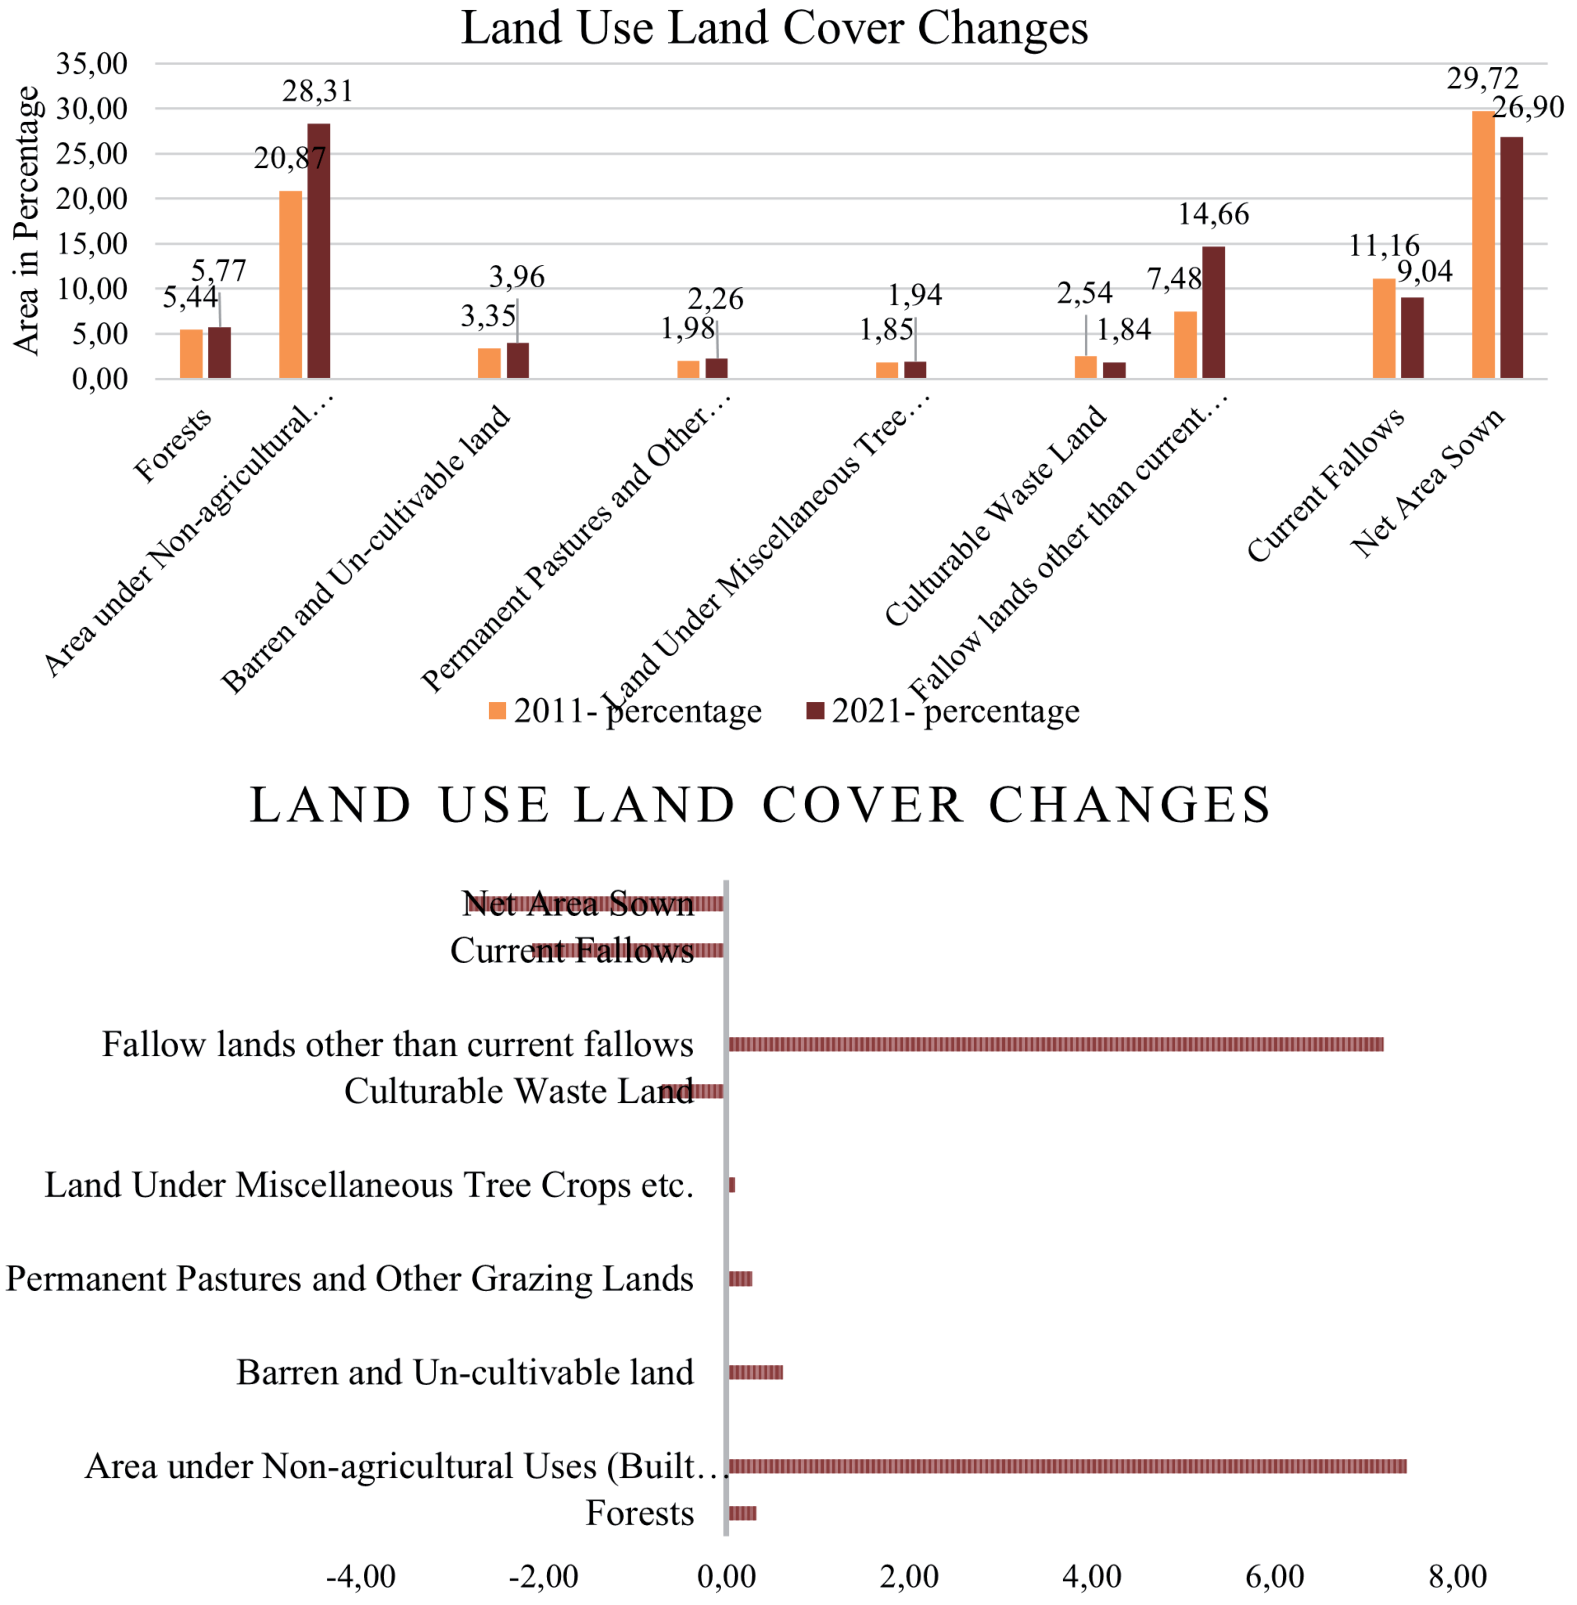
The comparison of land use statistics in 2011 and 2021 as per the data provided by the revenue authorities during data collection is presented in Table 8. It is observed that the forest land coverage increased to 197.36 km² (5.77%), followed by expansions in barren land (135.69 km², 3.96%), Permanent Pastures and Other Grazing Lands (77.41 km², 2.26%), and Land Under Miscellaneous Tree Crops (66.31 km², 1.94%). These statistics highlight a rapid urban sprawl in the study area, driven by the growth of built-up areas (7.44%) and fallow land (7.19%). Conversely, there is a decline in agricultural growth, with Net Area Sown decreasing (Fig. 9) by 2.82%, Current Fallows by 2.13%, and Culturable Waste Land by 0.71% [41-42].
The increase in Forest land by 0.32% contributes positively by filtering runoff, preserving water clarity, and stabilizing dissolved oxygen (DO) levels. The expansion of non-agricultural land, such as a built-up area of about 7.44% over the past decade, is likely to impact TDS and chloride levels due to increased sewage discharge and stormwater runoff. A marginal increase in barren land can affect water quality parameters such as increased Total Dissolved Solids due to the leaching of minerals and salts, which may, in turn, indirectly affect chloride and hardness levels in groundwater. The reduction in agricultural land can lead to increased runoff of pollutants like oil, heavy metals, and other urban contaminants. This results in modification in Hardness, TDS, nitrates, phosphates, and chloride levels, impacting water clarity and quality. It also contributes to nutrient loading in water bodies. This analysis indicates that effective strategies for maintaining chloride and hardness levels within acceptable limits in the Tiruvallur district include managing agricultural runoff, implementing erosion control measures on barren lands, and implementing urban runoff treatment.
Comparison of Groundwater Quality in the Tiruvallur and Kancheepuram Districts
Table 9 presents the maximum and minimum concentrations of major cations and anions found in the groundwater of both the Tiruvallur and Kancheepuram districts. The TDS values range from 175 to 1453 mg/L in the Kancheepuram region [43], while in the Tiruvallur district, they vary between 324 and 1072 mg/L. Alkalinity levels in the Tiruvallur region range from 230 to 488 mg/L, while in the Kancheepuram region, they vary between 61 and 604 mg/L. Higher HCO₃ concentrations suggest contributions from silicate and carbonate weathering processes.
The cations follow an order of abundance as Na > Ca > Mg > K in both districts. The concentrations of calcium and magnesium in the study area are likely influenced by rock weathering processes. Magnesium might be originated from the dissolution of magnesium calcite, gypsum, and dolomite. The anions follow an order of abundance as SO₄ > Cl > HCO₃ in the Tiruvallur district and SO₄ > HCO₃ > Cl in the Kancheepuram district. The higher chloride content in groundwater in the Kancheepuram district may be attributed to soluble chloride from rock sources and saline water intrusion from the Bay of Bengal. The correlation results indicated a strong relationship between major anions and cations, suggesting that the samples originated from similar geological settings in both districts.
Fig. 9a.
Land use and land cover changes across the Tiruvallur district between 2011 and 2021. Fig. 9b. Variation in land use and land cover in the Tiruvallur district from 2011 to 2021.
Conclusions
The study conducted an analysis of 11 specific physicochemical parameters, which were spatially assessed using IDW interpolation. The pH values of all the water samples are within the WHO’s acceptable level. Based on TDS, around 60% of the samples are within the WHO’s permitted levels, indicating its utilization for drinking purposes. Results also revealed that certain areas within the Thiruvallur district have significantly high levels of Conductivity, Total Hardness, Chloride, and Nitrate in the groundwater. Consequently, the groundwater quality in these areas is deemed to be inadequate, failing to meet the established standards and guidelines set by BIS for both drinking and domestic use. The pollution in groundwater samples can be minimized by various remedial measures such as effective quantification of the domestic sewage entering from diverse water bodies, enhancing natural replenishment capacity and increasing the percolation of surface fluids into aquifers arrived from the GIS tool, preventing leakage of sewage from broken sewers and line sewer drains, collecting and supplementing groundwater with rainwater through the use of rainwater harvesting. Conducting continuous monitoring of groundwater table levels, in conjunction with a study of groundwater quality, can help minimize the likelihood of further deterioration. To summarize, the spatial evaluation of groundwater quality plays a pivotal role in comprehensively assessing water management concerns within a specific region.
The Wilcox diagram has been used to assess the suitability of groundwater for irrigation, revealing the necessity of monitoring groundwater chemistry. The outcome of the Wilcox plot reveals that most of the regions in the study area fall under low to medium sodium hazards but high salinity in groundwater. As a result, it may be suitable for irrigation with careful management practices.
From the segregation of zones in the Piper diagram, it is clear that the majority of the water samples fall into the Ca2+- Mg2+- Cl- type and mixed water types, with fewer samples in the Ca2+- Mg2+ - SO42- type. There are no significant representations of Na+- K+- SO4- or Na+- K+- CL- types in the given diagram. The indication of a strong positive correlation between EC TDS and total hardness obtained from correlation analysis suggests that the groundwater in this region is experiencing an ion exchange process due to man-made activities.
Based on the determination of various indices and ratios frequently employed in research to evaluate groundwater suitability for agricultural purposes, it can be ascribed that almost all the samples are deemed safe for agricultural use. The results of this study will be useful in identifying the groundwater quality conditions for effective groundwater resource management and consumption for irrigation and drinking. Further, it can also offer insightful information for creating the formulation of a comprehensive water management plan encompassing the entire study area. Hence, it can help decision-makers to inform administrative decisions and guide effective water management strategies.

