


Introduction
Saudi Arabia globally has one of the highest freshwater stresses, which leads the country to adopt the sustainability use of freshwater strategy [1]. The country's freshwater demands in 2021 were about 15.6 billion cubic meters (BCM), according to the KSA statistical book, which was prepared by the Ministry of Environment, Water and Agriculture (MEWA) [2]. These demands were distributed as following: 73.2% for agricultural demands, 22.8% for domestic demands and 4% for industrial demands. The freshwater resources of domestic demands consisted of about 64.8% desalinated water, 32% groundwater [GW] (treated and untreated) and 3.2% surface water (treated and untreated) [2]. This situation forced MEWA to set a directive of providing about 90% of the national urban supply by desalinated water by 2030 [1].
Al-Baha province is located on the southwestern border of Saudi Arabia. It is considered as the smallest KSA provinces. It has an area of about 10362 Km2 and a population of about 412,000 [3]. It is raised by 2,500 m AMSL [4], which enables it to receive rainfall of about 200 to 600 mm/year, which is much higher than the KSA average rainfall [5]. Actually, this rate was decreased in the last years; in 2020 the total rainfall recorded about 139 mm [2]. The urban water demands of A-Baha province was about 39.7 BCM in 2020, which represents about 1% of the total KSA urban water supply, and were covered by about 49.6% from surface water, 38.5% from desalinated water and 11.9% from GW. This indicates the importance of surface water for Al-Baha province, which represented about 13% of the KSA surface water resources in 2021 [5.7% treated surface water and 7.3% are not treated]. Al-Baha province has 52 dams’ reservoirs with a total storage of about 105 MCM; four of them are mainly used for urban water supply, namely: Al-aqiq Dam, Al-Janaben Dam, Thurad Dam and Urda Dam. Al-aqiq Dam production rate of treated water was about 11,500 CM/day in 2019, which represented about 36% of the four reservoirs total capacity [2].
Water protection measures were discussed in limited studies [6-13] as following, according to Cvejic et al. [11], sustainable water use is based on long-term protection of available water resources Dobricic and Marjanovic [10] considered water protection as an obligatory segment of all planning documents, while Bruni [12] stated that water source protection is considered as the most suitable and cost-effective method to limit pollution of drinking water and reduce beautification measures as much as possible. Water sources protection plans should be prepared and implemented for each water use such as agriculture to increase protection and productivity. Water protection plan may be a stand-alone plan or a mitigation plan within the overall framework of the Environment Impact Assessment (EIA) [13]. Đorđević and Dašić [9] stated that water quality protection is one of the primary objectives of an organized society. The authors reported the importance of water protection measures as became crucial protection measures for water resources to accomplish high quality levels. While Walcher and Bormann [8] discussed the concept of drinking water protection zones for surface and groundwater. The authors reported that establishment of protection zones for drinking water resources is feasible in accordance with water and environmental laws, which reduces the effort of raw water treatment and contributes to water use sustainability. For example, establishing indirect (in larger spatial scale) and direct protection zones for water intakes is a common practice. For agriculture, as many fields as possible should be converted into grassland near the water palace to work as a filter, which should purify agricultural drainage water before discharging into the water body.
Using treated/untreated GW and surface water for urban water supply, makes water quality assessment of water resources is essential. Taking into consideration the sanitary conditions, groundwater is particularly subjected to bacterial contaminations. Therefore, biological assessment of groundwater should be regularly applied. Water quality assessment can be done using different approaches, one of them is water quality index (WQI) approach [14]. WQI is a mathematical method, which WQ records are combined into a single value represents the WQ conditions. Water quality index state-of-the-art were discussed in some studies as follow. According to Sutadian et al. [15], the Canadian water quality index (CCME-WQI) was ranked as the first, out of 30 used WQIs for rivers (1987-2014). This ranking of CCME-WQI returns to selection of WQ variables and considered standards [16]. Recently, WQI approach were applied for numerous water quality studies in Saudi Arabia [17-30]. However, CCME-WQI was not applied for any of these studies, most of the previous studies applied weight WQI. CCME-WQI index was developed based on the Saudi standards for unbottled drinking water [31], which are used for this study. WQ assessment of water resources was studied in several publications in Saudi Arabia. Table 1 highlights the most related studies to the current work. About two thirds of these studies assessed the untreated GW usage, mainly for drinking and agriculture, based on SASO, WHO and FAO standards – microbial activity is considered the main water contaminant. Regarding the presented studies, it can be noticed that assessing of WQ conditions of surface water (dams’ reservoirs) or assessing the efficiency of water treatment plants (WTP) are still very limited. In addition, there are no previous studies focused on the assessment of the water treatment plants efficiency in Al-Baha region.
This study mainly aims to assess the WQ conditions of Al-Aqiq reservoir (raw untreated water) and the treated produced water of Al-Lahyan WTP. Water quality assessment was done statistically and by applying WQI approach [32], based on the Saudi water quality standards [31].
Materials and Methods
Study Area
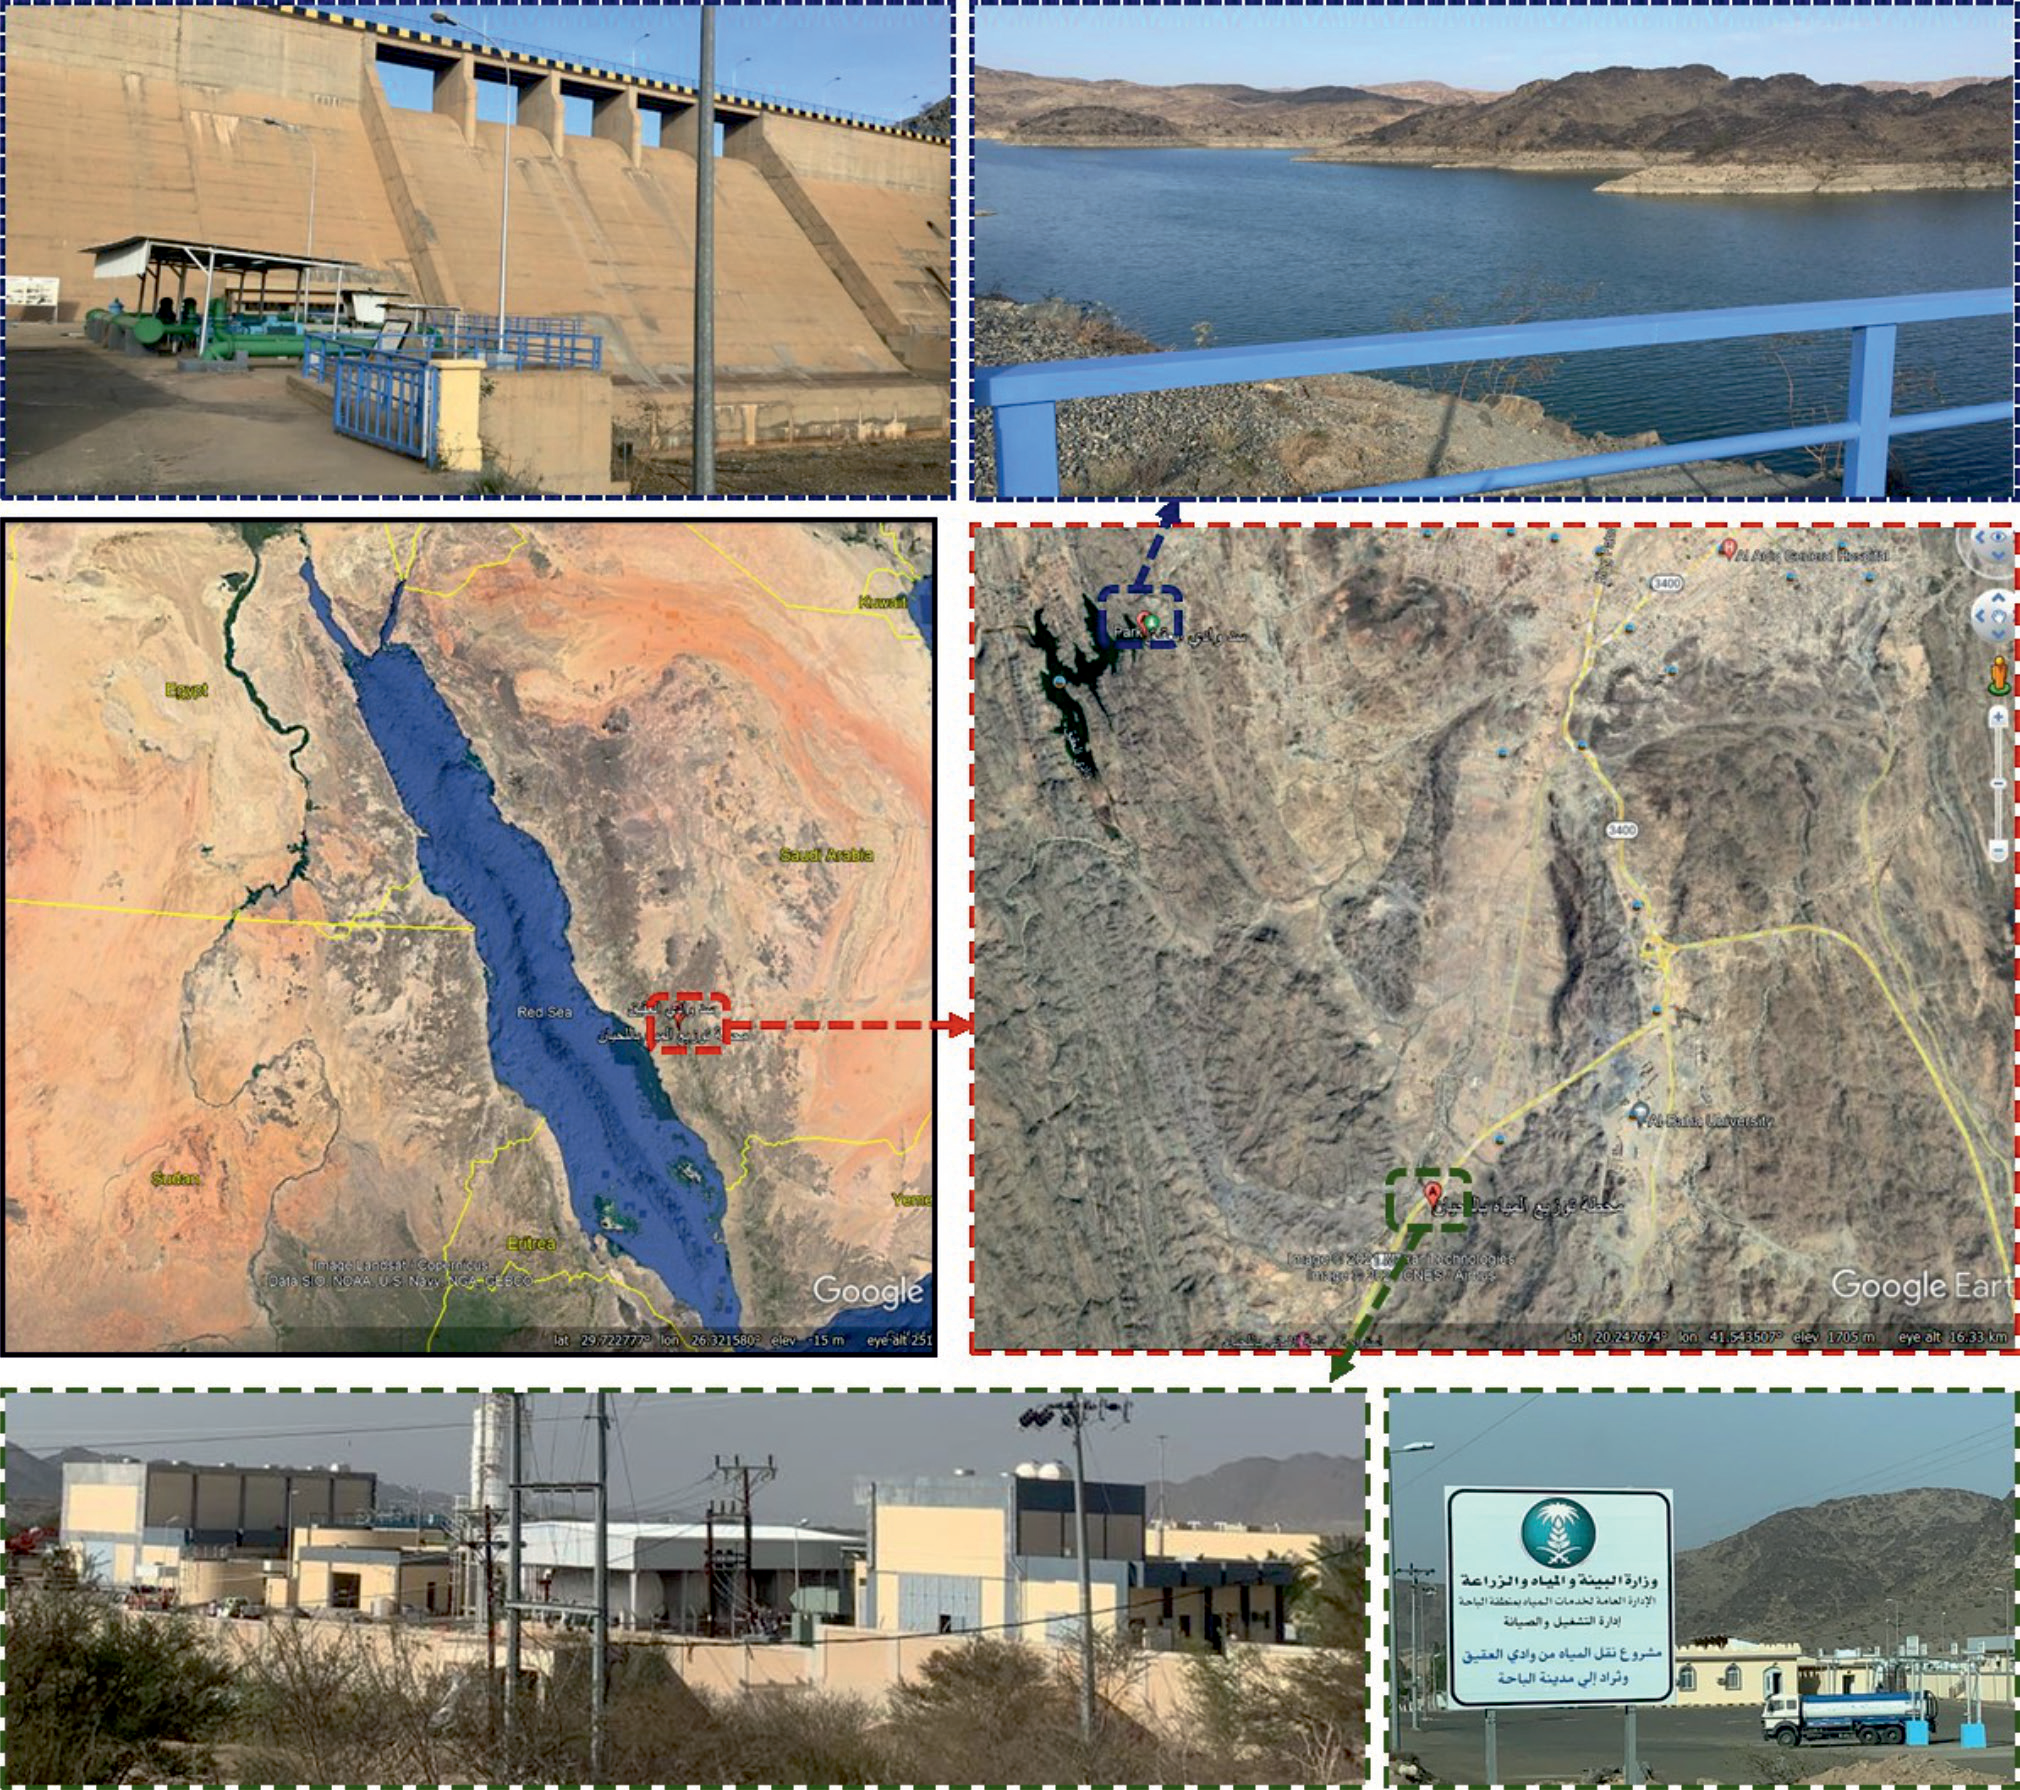
Al-Lahyan water treatment plant for treatment and distribution drinking water lies southern to Al-Aqiq city, Al-Baha region (Long. 41.608672o and Lat. 20.167644o). The station receives raw freshwater from Al-Aqiq Dam (Long. 41.570840o and Lat. 20.236919o). Produced treated water is distributed through the station to Al-Baha region. Fig. 1 shows the location of Al-Lahyan drinking water distribution, Al-Aqiq Dam and the distribution system.
Collected Data and Statistical Description
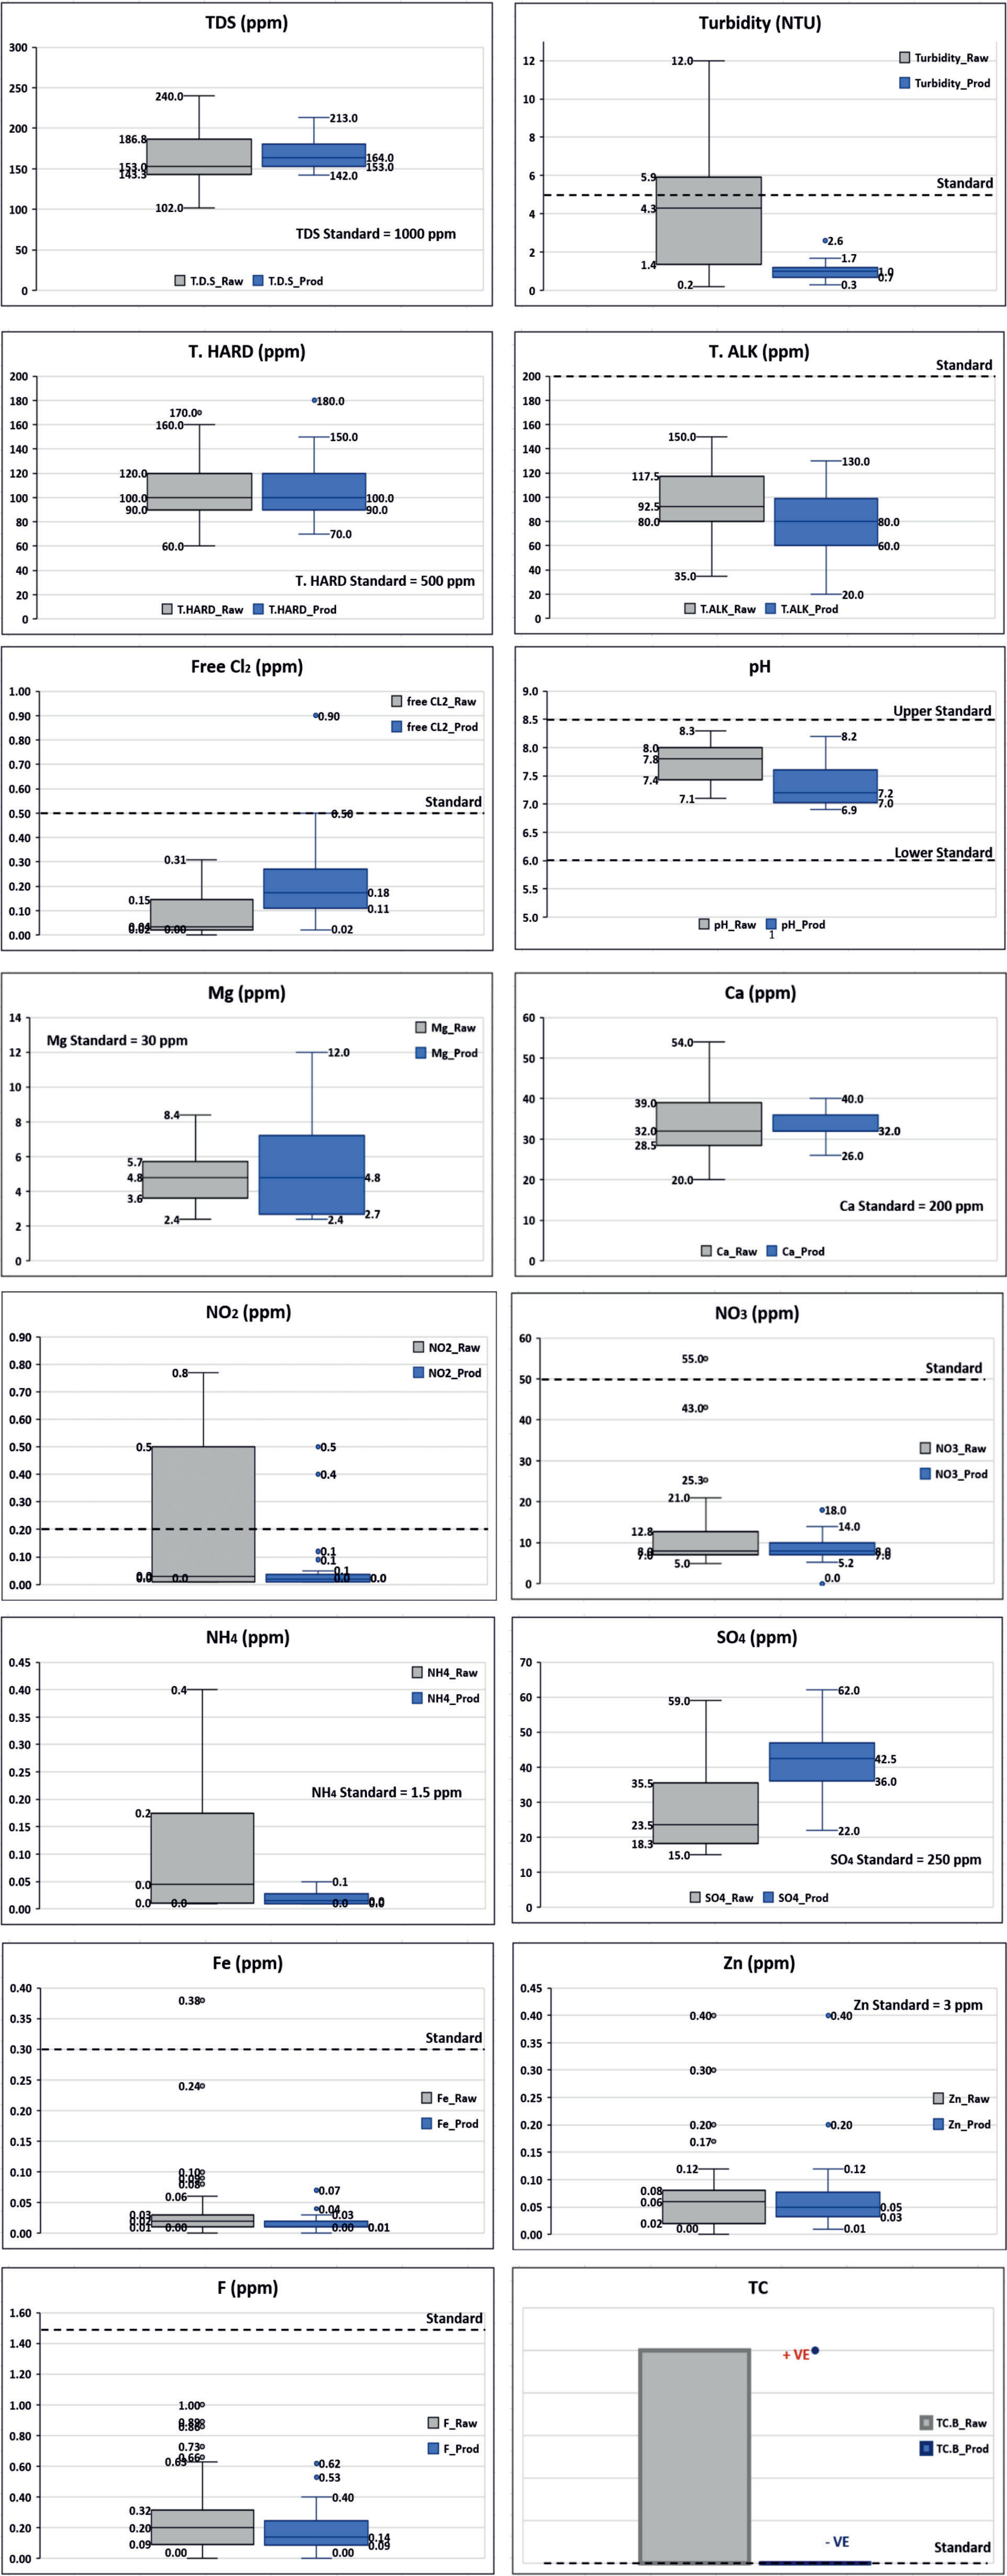
Physical, chemical and biological records were collected and analyzed (laboratory work) by the Ministry of Environment, Water and Agriculture (MEWA, Al-Baha branch) at the treatment station; before treatment process (inflow raw water) and after the treatment process (outflow produced water). Sixteen water quality parameters were considered for this study (June – September 2020). These parameters are: potential of hydrogen (pH), total dissolved solids (T.D.S), turbidity (Tur), free chlorine (Cl2), total alkalinity (T. ALK), total hardness (T. HARD), ammonium ion (NH4+), nitrite (NO2-), nitrate (NO3-), sulphate ion (SO4--), calcium (Ca), magnesium (Mg), ferrous ion (Fe++), zinc (Zn++), fluoride (F-) and total coliform bacteria (TC). Descriptive statistics can be seen in Tables 2 and 3, for the inflow raw water and the outflow treated drinking water, respectively. Box Plot charts are developed for considered WQ parameters as can be seen in Fig. 2.
Table 1.
Summary of the water quality studies in KSA (2008-2022).
CCME-WQI
CCME-WQI (Canadian Council of Ministers of the Environment WQI) was developed as an assessment water quality tool [32]. This index can be calculated as follows [32]:
Where factors F1 (scope), F2 (frequency) and F3 (amplitude) are sub-factors which are described in CCME guide [32]. WQ conditions are classified into five categories, based on CCME-WQI score; 0-44 (Poor), 45-64 (Marginal), 65-79 (Fair), 80-94 (Good) and 95-100 (Excellent) [32]. For this work, 16 WQ variables and their corresponding Saudi standards for unbottled drinking water [31] are considered. The maximum standards for considered water quality parameters can be seen in Tables 2 and 3 and in Fig. 2(a, b).
Results and Discussion
Statistical Analysis
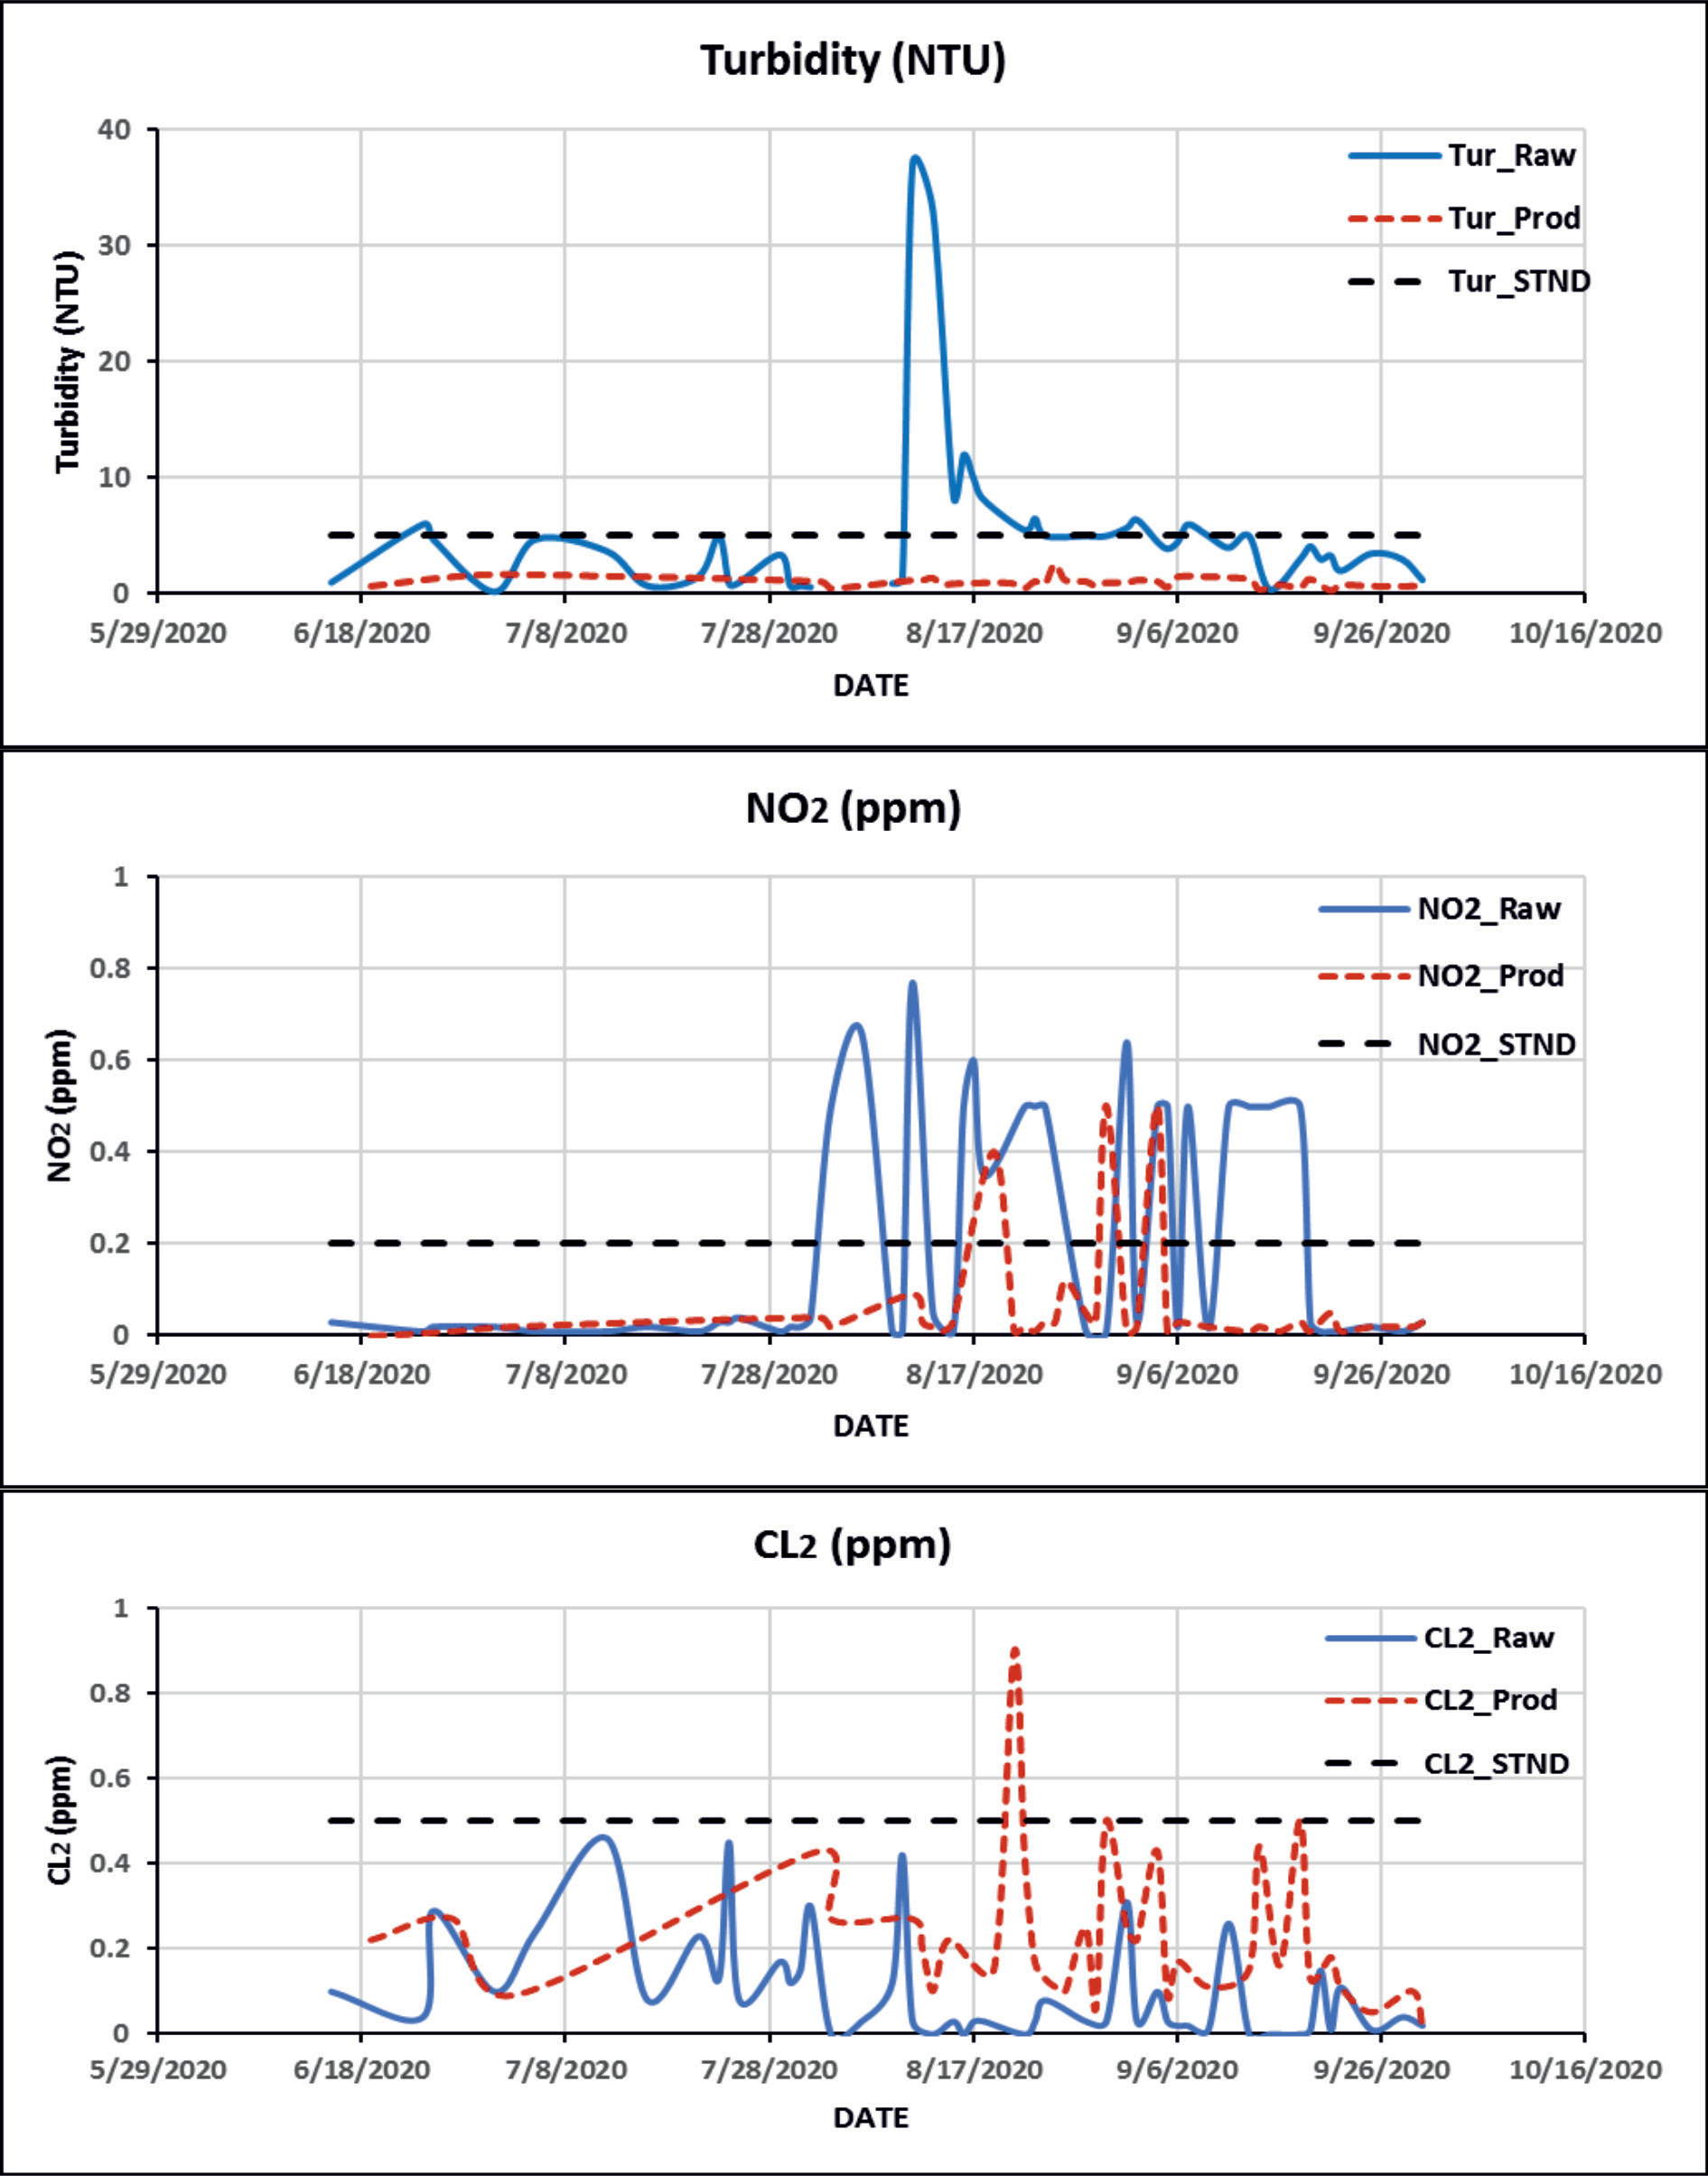
Descriptive statistics (Min, Max, Mean and SD) for WQ variables of the considered WTP (raw and produced waters) are shown in Tables 2 and 3. In addition to Tables 2 and 3, Boxplot charts (Figs 2(a,b)) for the considered parameters, showing a graphical comparison between the raw and produced water quality parameters, includes Min, Max, Mean, quartiles and outliers’ values. Moreover, the Saudi standards for drinking unbottled water are shown on the Boxplot charts. Clearly, the difference between raw and produced waters can be noticed; turbidity, nitrite and total coliform bacteria records of the raw water exceeded the permissible limits of the Saudi standards, in addition to limited records of nitrate and ferrous ion. While for produced water very limited records of nitrite (8% of total records), free chlorine and total coliform (2% of total records) exceeded the permissible limits of the Saudi standards. Detailed time series for turbidity, nitrite and free chlorine records for raw and produced waters are shown in Fig. 3. It can be noticed that for raw water, turbidity, and total coliforms exceeded the Saudi standards during August 2020, which may return to the agricultural activities and municipal waste which may be conveyed to the reservoir via rainfall and flash floods. These results are coincide with the study of Albaggar [33], where the author investigated the bacterial water quality status of eight reservoirs in Al-Baha region, includes Al-Aqiq reservoir. Regarding total bacteria, it is the common contaminant in most water quality studies in Saudi Arabia, due to special sanitary conditions of mountains topography, check Table 1. Free chlorine is used in WTPs for drinking water treatment, so it is a little bit usual to detect it in treated water with concentrations higher than the standards (Fig. 3).
Table 2.
Summary of descriptive statistic of water quality inflow data (raw water).
Table 3.
Summary of descriptive statistic of water quality outflow data (produced treated water).
Water Quality Index
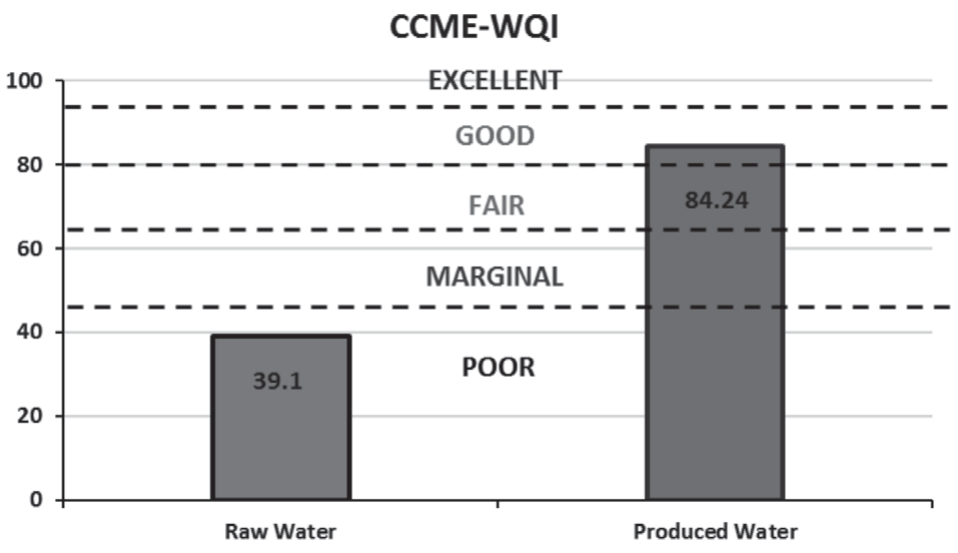
The CCME-WQI for untreated (Raw) and treated (produced) waters are presented in Fig 4. The WQI of untreated and treated waters during the study period were 39.1 and 84.24, respectively, which are ranked as “Poor” and “Good” according to CCME-WQI ranking and based on the Saudi standards for unbottled drinking water. Exceeding of turbidity, nitrite and total coliform to the water quality standards, caused the “Poor” rank of untreated raw water. Converting the water quality status of raw water from “Poor” to “Good” returns to the high efficiency of Al-Lahyan WTP. Due to very limited failed records for nitrite, chlorine (used for drinking water treatment process at WTPs) and total coliform, produced treated water didn’t reach to “Excellent” rank.
Fig. 2a).
Statistical representation (Box plot) of Al-Lahyan WTP water quality parameters (untreated and treated waters), compared to Saudi standards. Fig. 2b). Statistical representation (Box plot) of Al-Lahyan WTP water quality parameters (untreated and treated waters), compared to Saudi standards.
Conclusions
The water quality status of untreated inflow raw water (Al-Aqiq reservoir) and treated outflow produced water at Al-Lahyan WTP, Al-Baha, were assessed using statistical and WQI approaches, according to the Saudi standards for unbottled drinking water, for the period June – September 2020. The records of 16 water quality parameters for inflow and outflow water were collected and statistically analyzed. The results revealed that, untreated raw water was ranked as a “Poor” WQ, according to the modified CCME-WQI (Saudi standards). While the treated produced water was ranked as a “Good” water quality for drinking. These results reflect the WTP efficiency for controlling and managing untreated raw water. This efficiency can be clearly noticed through the presented Boxplot charts for the investigated water quality parameters, particularly for turbidity and total coliform, which is considered as the main water quality contaminant for surface and ground water. Special attention should be assigned to the bacterial contamination of drinking water resources. The modified WQI of this study should be applied at WTPs to clearly reflect the treatment efficiency. Water quality protection plan for the reservoir, including water quality measures for drinking and agricultural uses, should be designed and implemented as soon as possible to reduce the efforts and the cost of water treatment and to enhance the used untreated water.

