

Introduction
When constructing power transmission projects, it is necessary to study the geological conditions of the project area, analyze the impact of geological conditions on the power transmission project, select excellent engineering construction sites, and take relevant prevention and control measures for potential disasters to avoid causing harm to the power transmission and transformation project during construction and operation. The research on the impact of disasters in power transmission projects in China mainly focuses on meteorological disasters, while there is relatively little research on the geological environment and geological disasters of power transmission projects. Cheng et al. 2015 found that 75% of accidents in power transmission systems are caused by geological and meteorological disasters according to statistics [1], with landslides being the most common type of geological disaster in power transmission systems. Chen et al. 2015 found that the main types of geological disasters are landslides, mudslides, and unstable slopes based on the investigation of the Sichuan Tibet networking project route [2]. Liu 2018 identified and interpreted large-scale geological disasters in the Sichuan Tibet networking engineering [3], and a total of 101 geological disaster points were identified, including 70 landslides, 12 collapses, and 19 debris flows. Conducting an evaluation of the landslide susceptibility in power transmission projects has important theoretical and practical significance for the selection of power transmission channels and station sites, as well as for landslide monitoring and prevention in western mountainous areas.
At present, the common models for geological hazard susceptibility assessment mainly include analytic hierarchy process model, information model, weights of evidence model, logistic regression model and support vector machine model [4-15], etc. These models can be generally classified into two categories: statistical analysis models and mathematical models. Among them, the information model belongs to a type of statistical analysis model. Due to its clear physical meaning and simple operation, this evaluation method is widely used in the evaluation of geological hazard susceptibility. Das et al. 2022 aimed toward the landslide susceptibility zonation (LSZ) mapping in and around the Kalimpong region by applying Analytic Hierarchy Process (AHP) method [16]. Eventually the AUC ROC shows SRC method (m = 0.9) yields the highest result, achieving a prediction accuracy of 79.5% and, therefore, is considered the most promising LSZ form for the present study area. Liu et al. 2023 proposes a landslide susceptibility evaluation method based on the combination of an information model and machine learning in traditional mathematical statistics. The results indicate that the evaluation effect of the IV-ML models (IV-LR, IV-RF, IV-SVM, IV-ANN) on landslide susceptibility is significantly higher [17]. Chen proposed a weights-of-evidence model and cluster analysis method for landslide susceptibility assessment along the highways in the Hubei section of the Three Gorges Reservoir Area [18]. Pandey et al. 2020 produced landslide susceptibility zones using maximum entropy (MaxEnt) and support vector machine (SVM) data-driven models along the Tipari to Ghuttu highway corridors in the Garhwal Himalaya [19]. The result produced using MaxEnt and SVM model were subsequently validated using receiver operating characteristics curve (ROC) with test sets of landslide dataset. Both the models have good prediction capabilities. MaxEnt has ROC value of 0.78 while SVM has the highest prediction rate of 0.85.
In this paper, Erlang Mountain – Zheduo Mountain Power Transmission Project is taken as the study area, and grid unit is selected as the evaluation unit in combination with the geological conditions such as topography and the characteristics of disaster characteristics in the area [20]. By combining Pearson correlation coefficient method, CRITIC weight method, and independence weight coefficient method with traditional information model, an evaluation of landslide susceptibility (DJIV) based on weighted information model method is proposed. The ROC characteristic curve is selected to validate the model of landslide susceptibility assessment, and a method of landslide susceptibility assessment suitable for transmission project is proposed.
Method
Geological Setting of the Study Area
Erlang Mountain – Zheduo Mountain power transmission is located in Ganzi Prefecture, Sichuan Province, with the geographical coordinates of longitude of 101°4′~102°45′E, and latitude of 30°~31°43′N. The length of power transmission line in the research area is 322.2 km, and the area is 1961.7 km2. The research area starts from the Zheduo Mountains in the east, passing through Kangding City, Luding County and Erlang Mountain along National Highway 318 (Fig. 1). The research area is mainly located in the high mountain and canyon area, with strong terrain cutting. There are Dadu River, Kangding River and Yarra River in the area. Along both sides of the river valley, there is a deep canyon landform, mainly consisting of deep cut middle to high mountains.
Landslide disasters are mainly developed in Xujiahe Formation – Baitianba Formation, Pingyipu Formation – Guanwushan Formation, Hongshiya Formation – Huixingshao Formation and other strata. The formation lithology is very complex, mainly distributed with extrusive rock and metamorphic rock, as well as intrusive rock and sedimentary rock. The lithology is mainly sandstone, Siltstone with mudstone, Marl, which is a soft and hard interbedded rock. Quaternary strata are developed on both banks of the river valley. The structures are mainly northwest trending, including Xianshui River fault, Moxi fault, Dadu River fault and Longmenshan fault. The types of groundwater in the area are mainly divided into two types: loose rock pore water and bedrock fissure water. The human engineering activities mainly include building houses and roads, constructing water conservancy facilities, and constructing power transmission projects.
According to the remote sensing interpretation and field survey of geological disasters along the Erlang Mountain – Zheduo Mountain transmission line corridor, the study area has the most landslide disasters, with a total of 61 landslide disasters developed, accounting for 40.94% of the total disasters.
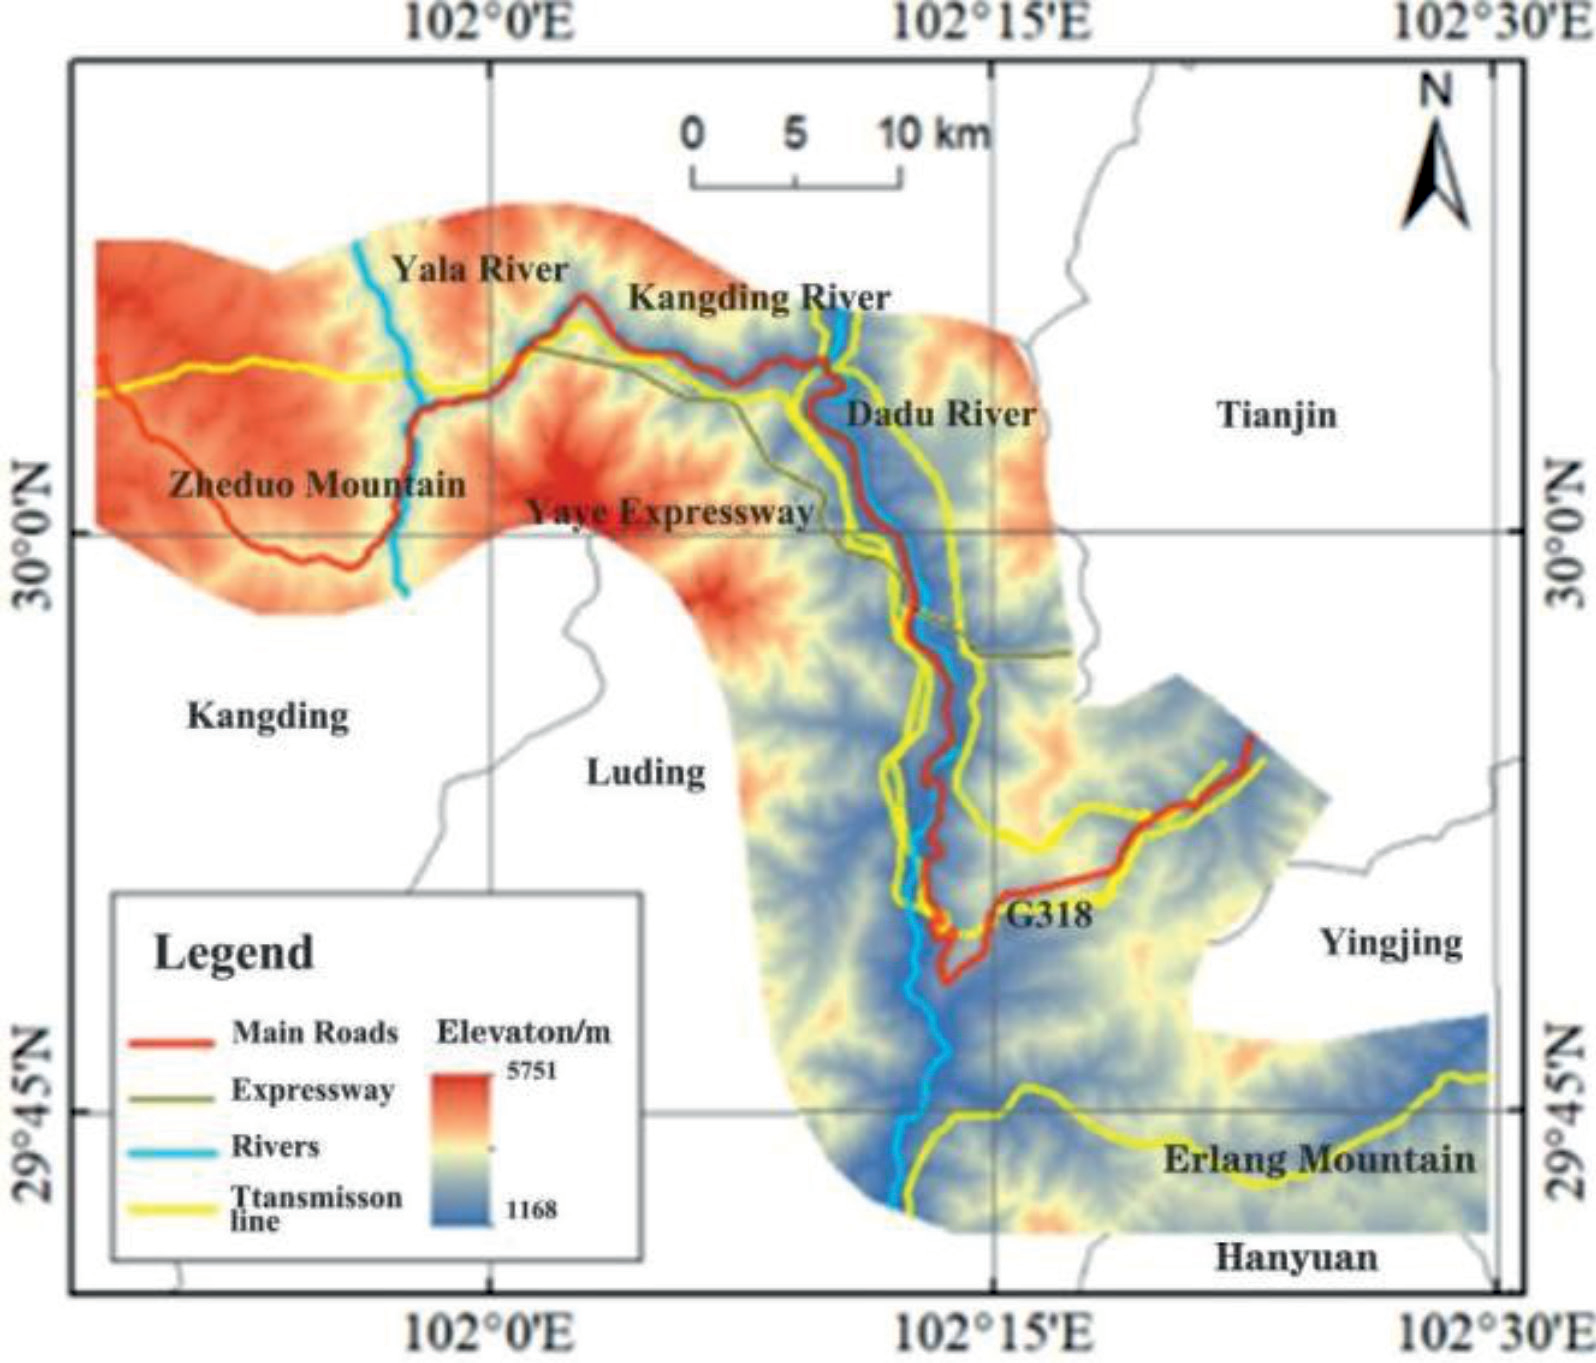
Data Source
The data used for evaluation of landslide susceptibility along the Erlang Mountain – Zheduo Mountain transmission line corridor are as follows:
1) Stratum lithology data is from the "ChuanYu (Sichuan, Chongqing) 1:500000 Geologic map" of the National Geological Data Center, which is used to extract rock and soil types, geological structure information, 2) The Digital Elevation Model (DEM) is sourced from the ALOS satellite’s publicly available 12.5 m resolution data; 3) The annual precipitation is sourced from the "1 km resolution annual precipitation dataset of China (2001-2020)" issued by the National Earth Systems science Data Center, in which the average data of 2001-2020 is used; 4) The project team has systematically collected the results of detailed geological disaster surveys in various counties and cities in western Sichuan in recent years, and constructed a geological disaster database for the research area, which includes detailed information of over 20000 geological disaster points.
Evaluation Index Factors
The development of landslide disasters is controlled by both internal and external factors; the internal factors mainly include topography, lithology, geological structure, and hydrogeological conditions, while external factors mainly include rainfall, and human engineering activities. In this paper, nine evaluation index factors are selected to evaluate the landslide susceptibility in Erlang Mountain – Zheduo Mountain transmission line corridor.
Layers of Evaluation Factors
The elevation layer is obtained by resampling to 30 m on the basis of ALOS satellite public version 12.5 m resolution DEM data; the gradient and aspect layers are obtained from the elevation layer through to the Surface analysis tool of Spatial analysis. The layers of distance to fault, distance to road and distance to river are obtained from the corresponding source data (fault, road and river) through the Euclidean distance tool of Spatial analysis; the annual precipitation is directly sourced from the database of the National Qinghai Tibet Plateau Scientific Data Center. The rock formation layer is obtained based on the 1:500000 Geologic map of Sichuan and Chongqing.
Establishment of Weighted Information Model
Information Model
The information model is mainly based on statistical models and information quantity, and used to measure the probability of geological disasters by comparing the size of the information quantity in the evaluation unit. The information model first calculates the information quantity of each evaluation factor separately, and then adds up the information quantity of each factor. The larger the total information quantity, the more likely geological disasters are to occur. The calculation method for information quantity is as follows:
Where I (ij) is the information quantity value of the jth class of evaluation factor i; Nij is the number of geological hazard points distributed within the jth category of evaluation factor i; N is the total number of geological hazard points in the study area; Nij/N is the disaster ratio; Sij is the number of grids that contain the jth class of evaluation factor i; S is the total number of grids; Sij/S is the grid ratio; IF is the total information value of the grid unit; N is the number of evaluation factors.
Weighted Information Model
In this paper, a weighted information quantity model is proposed by combining Pearson correlation coefficient method, CRITIC weight method, and independence weight coefficient method with traditional information quantity models, as shown in Fig. 2. When the traditional information model is superimposed, the information quantity of each factor is directly added. In order to make the weighted information quantity comparable to the original information quantity, the formula for calculating the weighted information quantity is as follows:
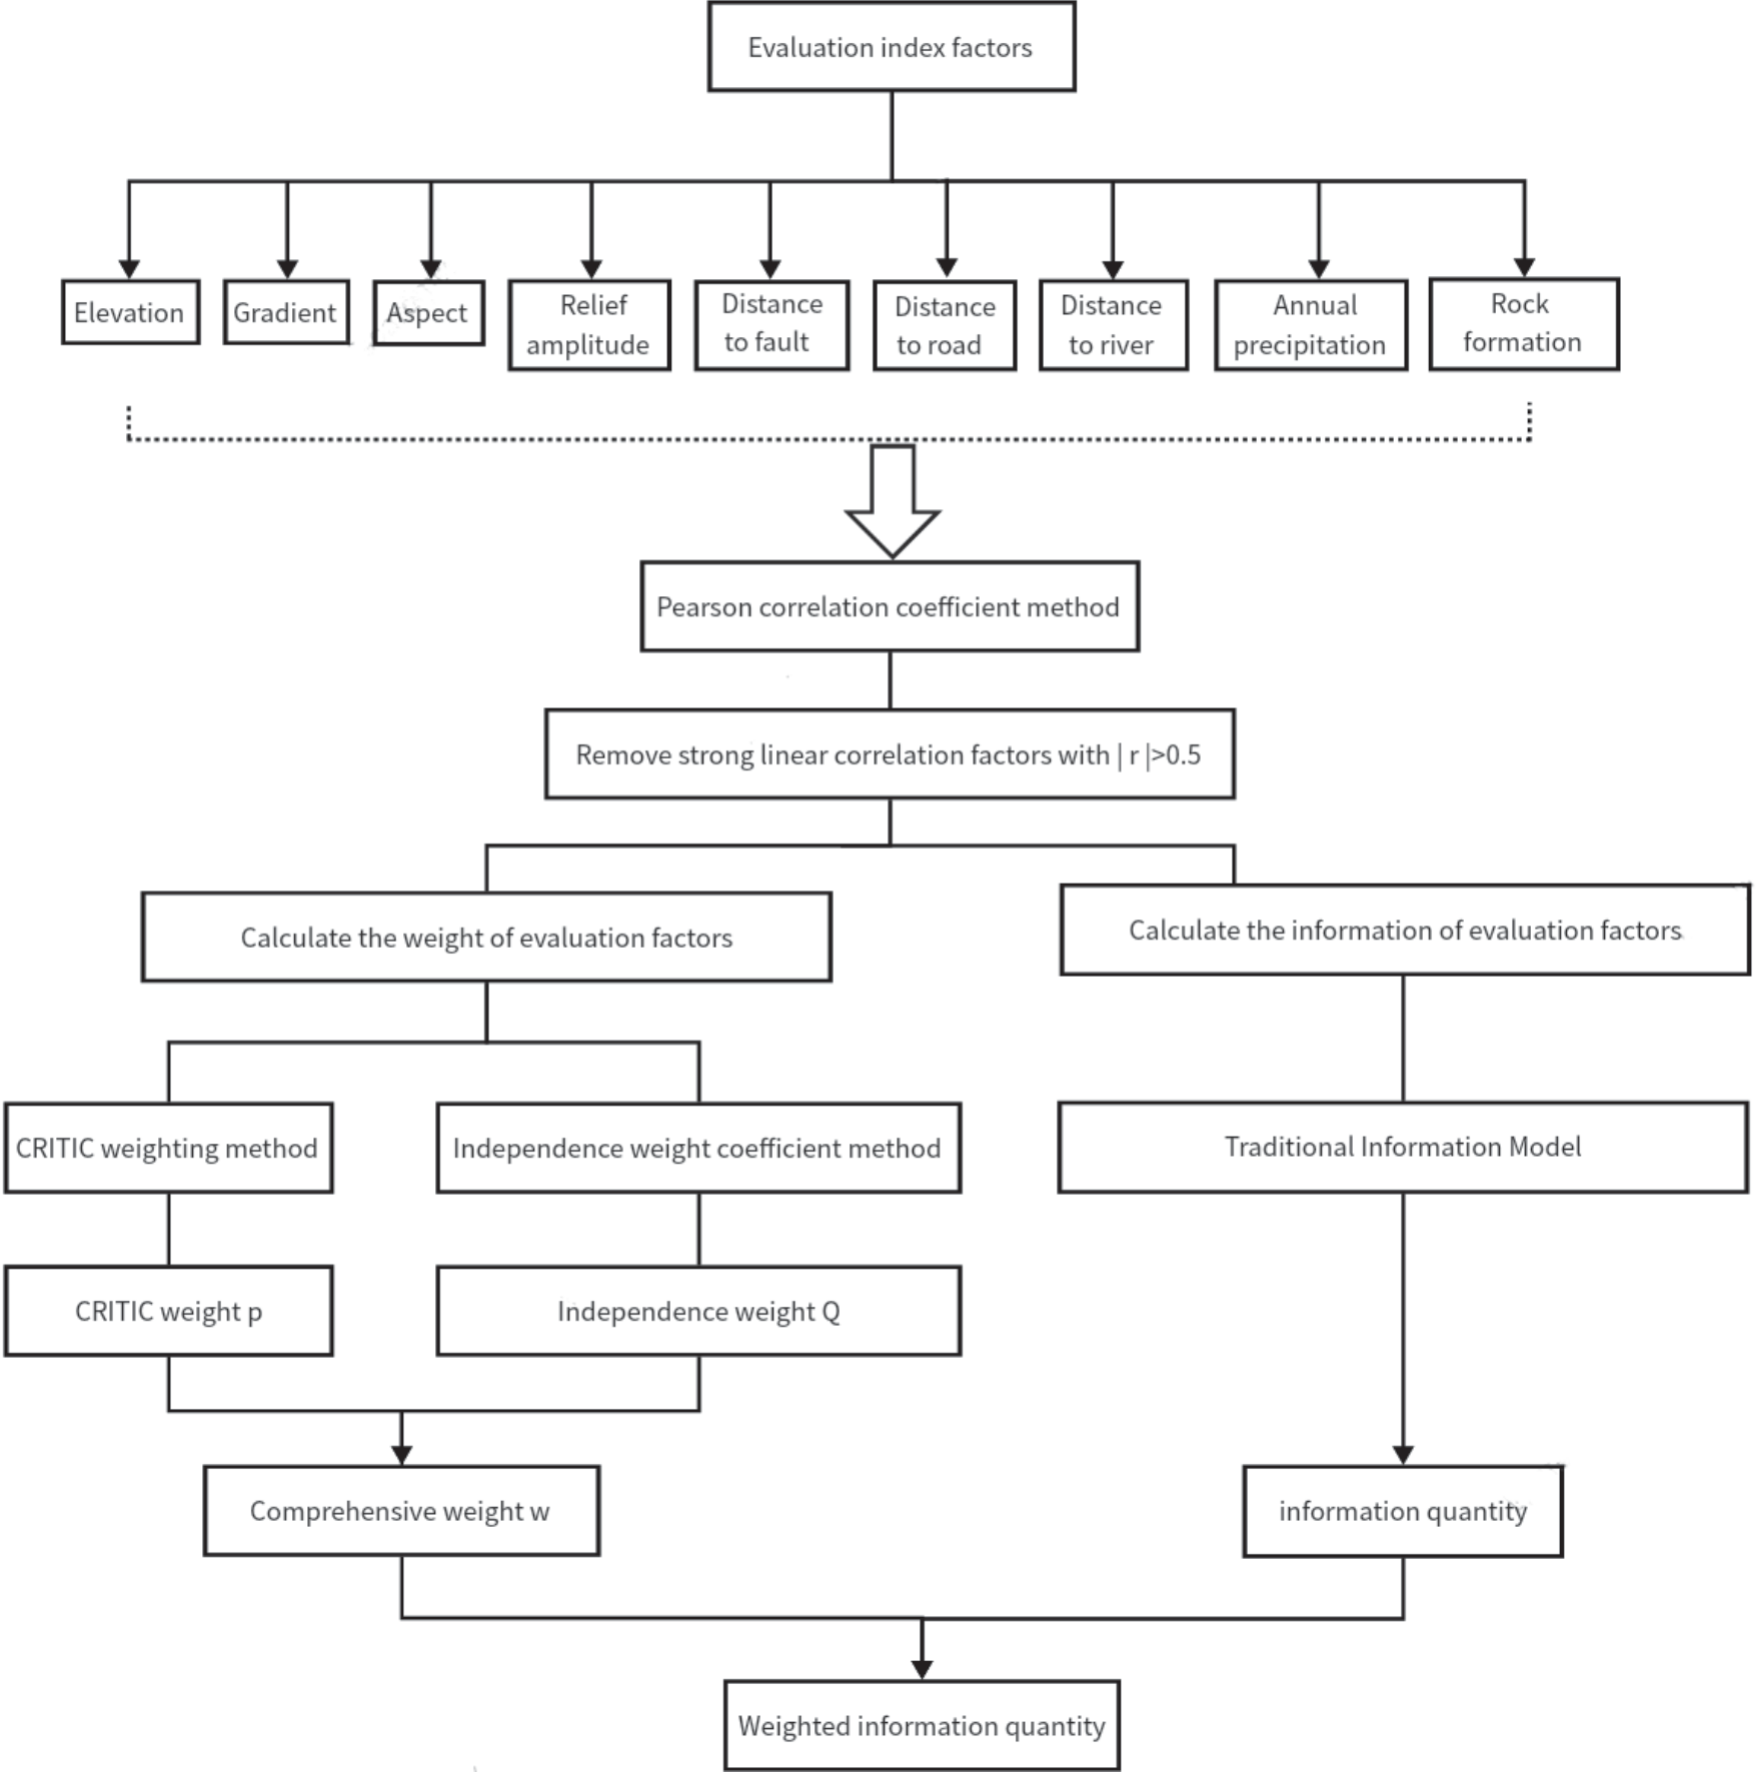
Where, MIFj is the weighted information value of factor j; IFj is the original information value of factor j; Wj is the comprehensive weight of factor j, Unit: %.
After obtaining the weighted information, the weighted information model should also be divided into intervals to obtain the susceptibility zonation.
The interval division method used in this article is the natural breakpoint method, which is divided into five susceptibility levels based on the size of weighted information from high to low, including extremely high susceptibility area, high susceptibility area, medium susceptibility area, low susceptibility area, and extremely low susceptibility area.
Results
Landslide Susceptibility
Collinearity Analysis
The calculated Pearson correlation coefficient is shown in Table 1. The linear correlation coefficients between elevation and distance to river, elevation and annual rainfall are 0.54 and -0.78, respectively. The linear correlation coefficient between fault distance and distance to river is 0.55; The linear correlation coefficient between distance to river and rock formation is -0.57.
Weighted Information Calculation
Based on the results of collinearity analysis, the calculated information quantity and weighted information quantity are shown in Table 2.
Prediction Results of Landslide Susceptibility
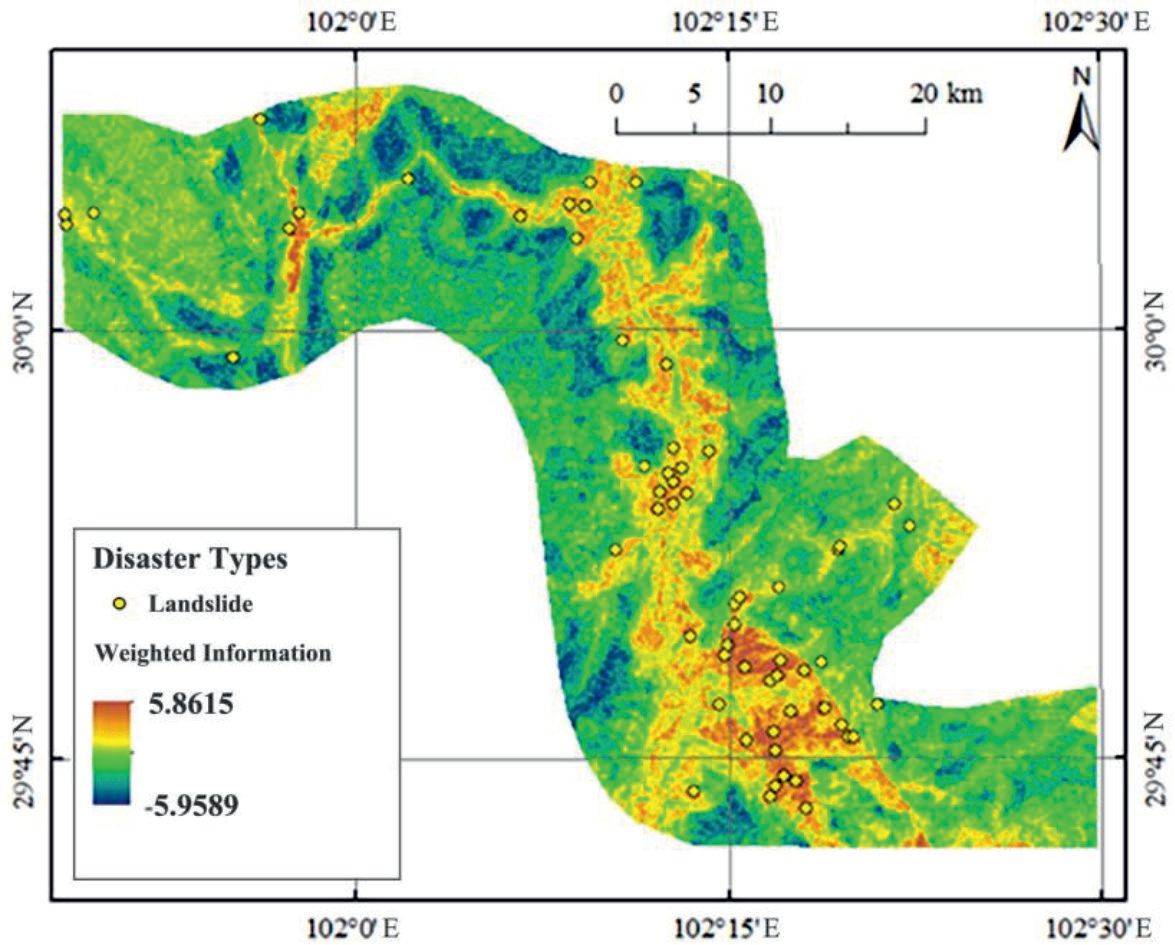
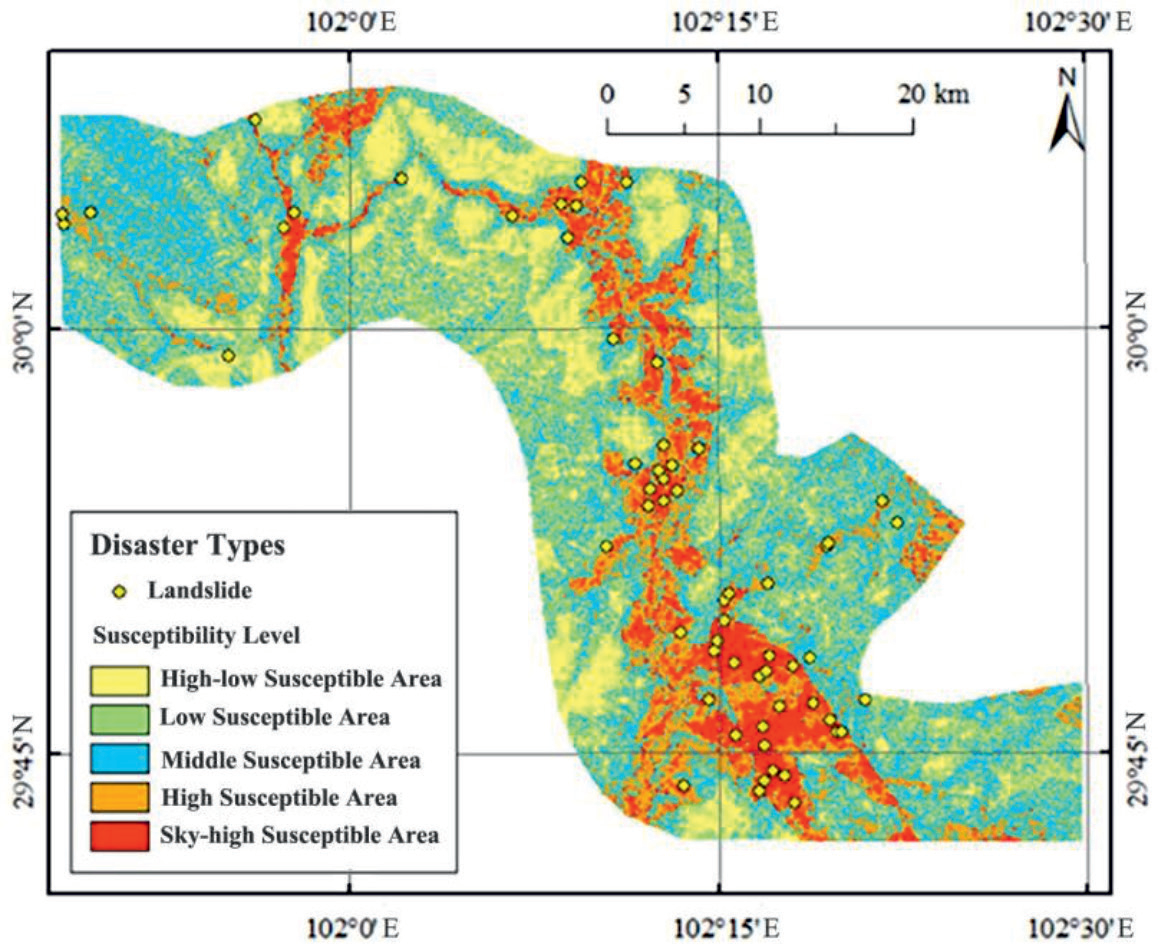
The HPIV weighted information map is divided into five sections based on the natural breakpoint method (Fig. 3 and Table 3), and the HPIV landslide susceptibility zoning map is obtained (Fig. 4). It can be seen that the landslides prone to occur along the bank of Dadu River and near the Luding exit of the Old Mount Erlang Tunnel.
Discussion
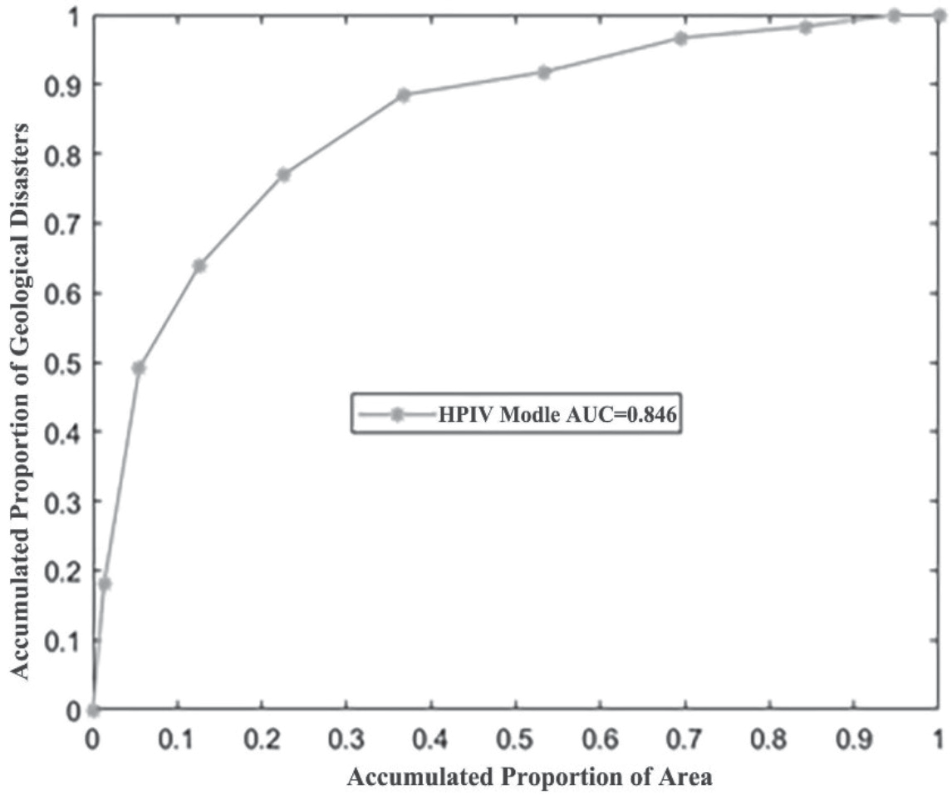
The number of landslide disasters of each susceptibility level indicates (Table 3) that the HPIV model predicts a extremely high susceptibility area accounting for only 8.2%, with 36 landslide disasters distributed, accounting for 59.02% of the total disaster, and with a disaster density of 0.297 per kilometer²; the high susceptibility area accounts for 17.94%, with 15 landslides distributed, accounting for 24.59% of the total disaster, and with a disaster density of 0.057 per kilometer². Figure 5 shows the ROC curve of the HPIV model, with an AUC value of 0.866>0.5, indicating that the HPIV model has a good predictive effect on landslide disasters.
In addition, the information quantity calculation of various evaluation factors in traditional information models is independent of each other [21-23]. The total amount of information can be obtained by adding the information of each factor, that is to say, the weight of each evaluation factor is 1. However, the impact of various evaluation factors on the development of geological hazards varies, and there are also significant differences in different regions [24-25]. It is reasonable to use CRITIC weight method and independence weight coefficient method to determine the weight of evaluation factors in this paper.
Table 1.
The calculated Pearson correlation coefficient.
Table 2.
The weighted information quantity calculation.
Table 3.
Prediction results of landslides susceptibility level based on HPIV model.
Conclusions
Based on remote sensing interpretation and geological hazard survey, nine factors, including elevation, slope aspect, slope gradient, relief amplitude, distance to fault, distance to road, distance to river, annual precipitation, and rock formation were selected as the evaluation index; and a weighted information model was proposed based on the Pearson correlation coefficient method, CRITIC weight method, and independent weight coefficient method for landslide susceptibility assessment in Erlang Mountain - Zheduo Mountain transmission line corridor. The following conclusions were drawn:
1) The geological disasters prone to occur along the bank of Yala River, Kangding River, Dadu River and the exit of the old Mount Erlang Tunnel near Luding. The study area has the most landslide disasters, with a total of 61 landslide disasters developed, accounting for 40.94% of the total disasters. Landslide disasters are mainly developed in Xujiahe Formation – Baitianba Formation, Pingyipu Formation – Guanwushan Formation, Hongshiya Formation – Huixingshao Formation and other strata. The lithology is mainly sandstone, Siltstone with mudstone, Marl, which is a soft and hard interbedded rock.
2) The HPIV model predicts that the area of extremely high susceptible areas accounts for only 8.2%, with 36 landslide disasters distributed, accounting for 59.02% of the total disaster, and a disaster density of 0.297/km²; The area of high susceptible areas accounts for 17.94%, with 15 landslides distributed, accounting for 24.59% of the total disaster, and a disaster density of 0.057/km².
3) The ROC curve and AUC value were used to verify the effect of HPIV model, and its AUC value is 0.866, indicating that HPIV model has a good prediction effect on landslide disasters.

