

Introduction
Landslides are common in mountainous regions and have become more frequent because of climate change, frequent human engineering activities, and rapid urbanization. These changes pose significant risks to human life and property, and hinder such regions’ economic development [1-5]. A landslide is a physical and geological phenomenon in which unstable soil and rock flow downward onto a soft surface (or sliding area) under the influence of gravity. Factors inducing landslides are categorized as natural or anthropogenic natural factors [6, 7], such as rainfall, vegetation, and river erosion, can lead to a decrease in shear strength and an increase in slope shear stress, which ultimately induces landslides [8, 9]. The construction of roads and bridges, and changes in land use can also trigger landslides; furthermore, if they are not adequately constructed, they may result in more significant and dangerous landslides [8-10]. Geological hazards in China, especially landslides, are prevalent in the Yunnan, Guizhou, and Sichuan Provinces, where the Chishui River flows, as well as a small area in the southwest of Chongqing Municipality. Conducting a landslide susceptibility assessment is a critical step in pre-disaster warning and post-disaster relief. Through vulnerability assessment, landslide-susceptible areas can be identified and a corresponding disaster prevention system can be set up. Further, through vulnerability zone mapping, a post-disaster rescue program can be quickly formulated. Therefore, it is necessary to conduct landslide susceptibility assessments in the Chishui River Basin.
In 1984, Brabb et al. introduced the concept of landslide sensitivity to characterize the likelihood of landslides under the control of regional environmental variables. Susceptibility analysis methods can be classified into two broad categories: knowledge-driven strategies (e.g., the frequency–ratio method, analytic hierarchy process, fuzzy comprehensive appraisal, and information volume model) and data-driven approaches (e.g., artificial neural networks). Knowledge-driven schemes, some of the earliest methods used for landslide susceptibility assessment, rely on the experience of experts, to a certain extent; therefore, they have more stringent requirements for the expertise of experimenters [11]. With increasing access to data, however, landslide assessment has evolved to include more complex knowledge areas. To compensate for the shortcomings of knowledge-driven methods, such as a large workload, high subjectivity, and low accuracy of prediction results, landslide susceptibility evaluation using traditional machine learning methods has gradually become a mainstream method with wide application. However, owing to the shallow structure of traditional machine learning methods, these methods are limited in their ability to extract in-depth information; meanwhile, neural network models have a more complex structure, leading to better generalization ability than general algorithmic models. They also have an advantage in handling voluminous data sets and can quickly obtain global information [12]. For example, Shahri et al. accurately predicted landslide susceptibility in Sweden using artificial neural network modeling [13]. Han et al. trained and validated a landslide susceptibility model for the Boshan District of Zibo City using a convolutional neural network (CNN) optimized for the region [14]. Azarafza et al. proposed combining CNN and deep neural networks (DNNs) for landslide susceptibility assessment in Isfahan province, Iran [12]. Zhang et al. used a CNN to analyze landslide susceptibility and compared it with logistic regression (LR), support vector machine (SVM), and random forest (RF) models [14]. The CNN outperformed the other models in feature extraction and multidimensional data processing. Ghorbanzadeh et al. focused on exploring the interrelationships among landslide factors when assessing landslide susceptibility based on CNNs, which resulted in better model performance [15].
The accuracy of landslide susceptibility analysis is closely related to the quality of the selection of non-landslide points [16]. According to existing data, there are four main ways to select non-landslide points at home and abroad.
(1) Random method: With this method, researchers randomly select points from outside the known landslide area; the points identified may be similar to the geological background of the landslide area [17], and, therefore, be areas of potential landslides;
(2) Buffer method: Researchers randomly select points outside the appropriate buffer distance from the historical landslide site; however, determining the buffer distance is highly subjective [18];
(3) Slope method: Points are randomly selected from non-landslide areas with slopes below a certain threshold [19]; the points selected by the susceptibility and slope methods in particular are insufficient to reflect the overall characteristics of points.
(4) Susceptibility method: Random selection of points from the initial very-low-susceptibility area can help to reduce the limitations imposed by anthropogenic factors [20].
Therefore, despite these different approaches, the accurate selection of high-quality non-landslide points remains a significant problem that must be solved for landslide susceptibility modeling using neural networks. Landslides have become an obstacle to sustainable social development, causing irreversible damage to daily life, road network construction, and economic development [21, 22]. Landslide susceptibility analysis is particularly important for pre-disaster prevention and relief.
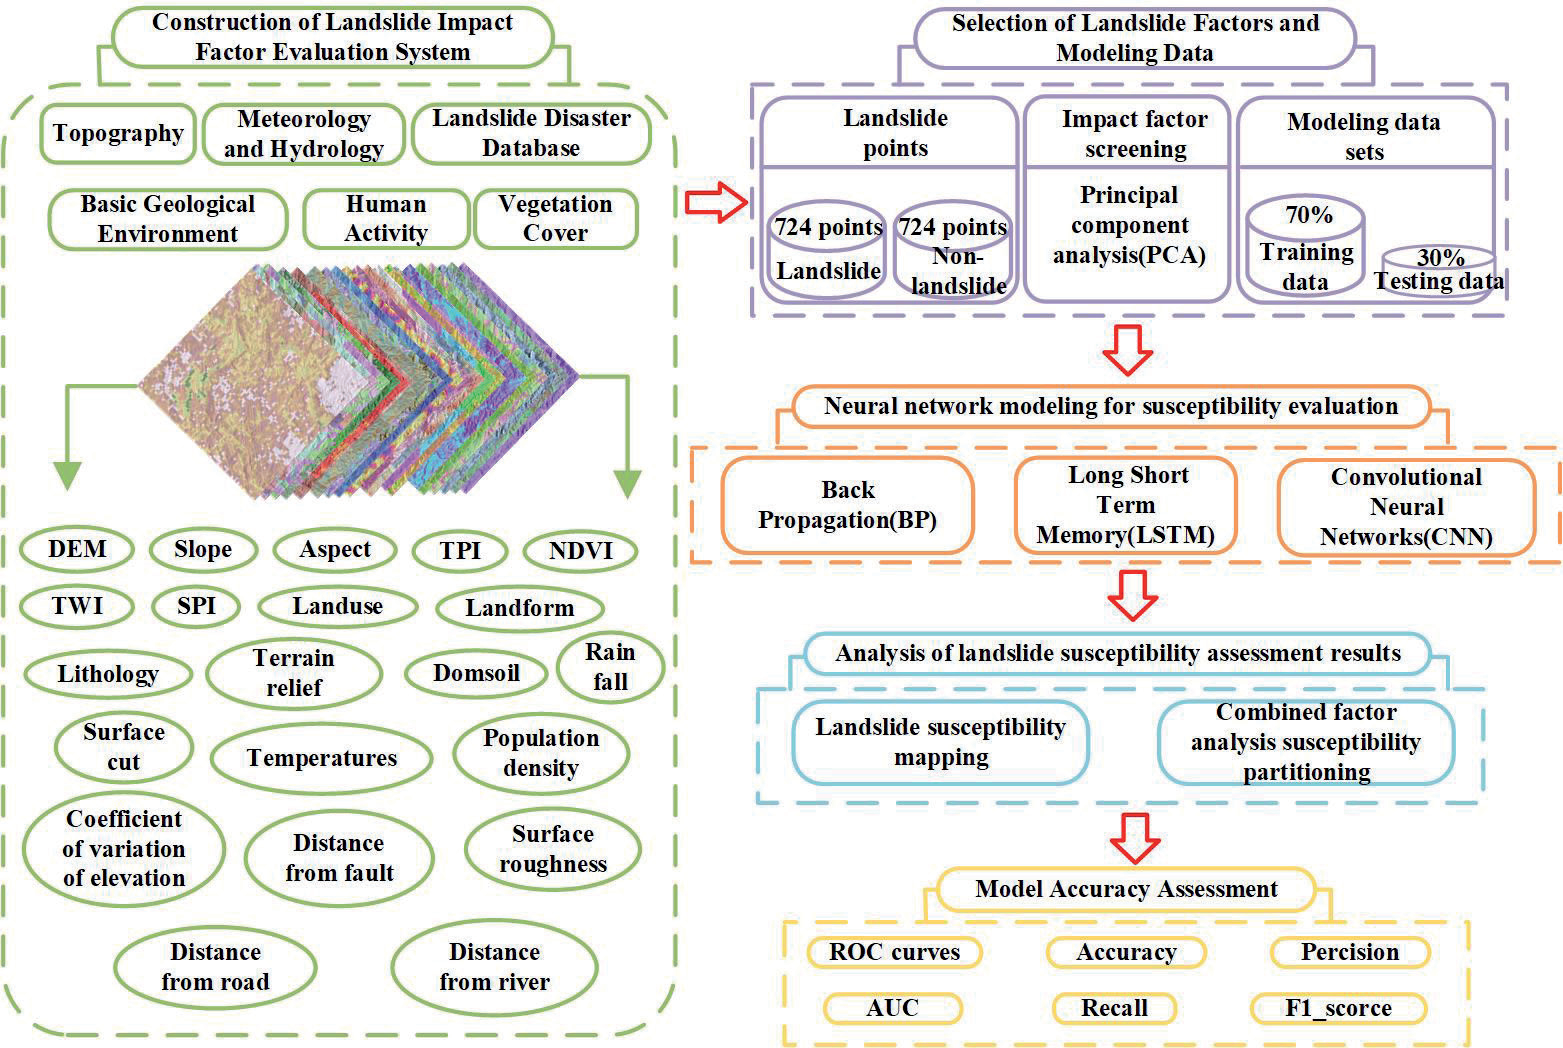
In this study, we used the Chishui River Basin as the study area and aimed to: (1) analyze the corresponding landslide conditioning factors based on principal component analysis (PCA); (2) conduct preliminary landslide susceptibility zoning using the information degree model and randomly select 724 non-landslide points in the very low susceptibility zone; (3) perform landslide susceptibility prediction in the study area using the back-propagation model (BP), long- and short-term memory (LSTM) model, and CNN, and prepare a corresponding landslide susceptibility zoning map (Fig. 1). The methodology of this study is not the same as that when using other single models, aiming to analyze the landslide susceptibility assessment by combining an informative model of the selected non-landslide sites with a neural network model, and to provide an important scientific basis for the establishment of a landslide prevention and control system in the Chishui River Basin.
Study Area and Data
Study Area
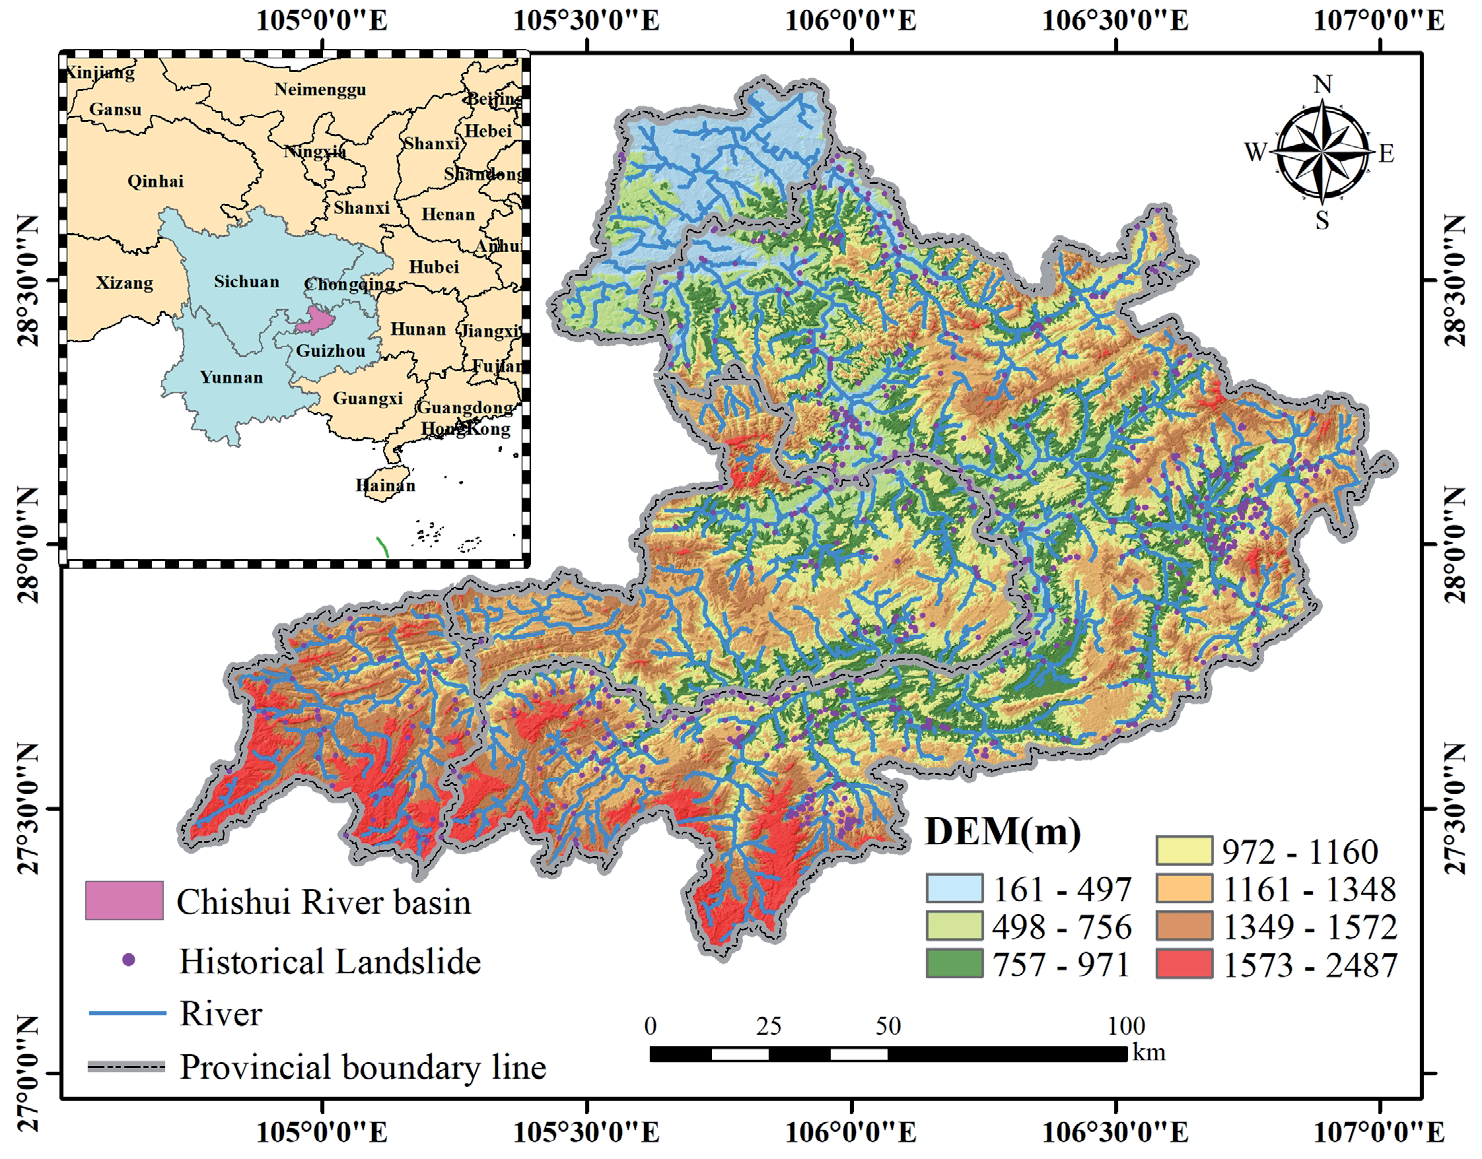
The study area is located in the border region of the Yunnan, Guizhou, and Sichuan Provinces, in addition to a minimal number of rivers flowing through Chongqing Municipality (Fig. 2). The Chishui River Basin originates in Fangba Township, southwestern Zhenxiong County, Yunnan Province. Its main tributaries are the Erdao, Tongzi, and Xishui Rivers, with the rest spread over many counties and cities, including Zhenxiong and Weixin in Yunnan Province; Bijie, Dafang, Jinsha, Zunyi, Rhenhuai, Chishui, Xishui, and Tongzi in Guizhou Province; and Xuyong, Gulin, and Hejiang in Sichuan Province. The Chishui River Basin is located at 104°45′–106°51′E, 27°20′–28°50′N. The basin has a total area of 20,440 km2. The terrain of the Chishui River Basin is higher in the northeast and is on the slope from the Yunnan–Guizhou Plateau to the Sichuan Basin. In the Chishui River Basin, the Paleozoic stratum dominates the section above Taipingdu and Sandy Beach, with widely distributed limestone interspersed with shale and coal; meanwhile, the Mesozoic stratum, with sandstone, mudstone, conglomerate, and coal, dominates the section below Sandy Beach. The basin experiences southeastern Gulin area mountain tectonics along with regional tectonics. The section of the river below Unk Indu crosses the shield of the mountain tectonic plate, and the inconspicuous spine part is composed mainly of a series of broad and gentle east– west comb folds with fewer ruptures, where regional tectonic plates are single and stable. The Chishui River Basin is adjacent to a plateau and valley, characterized by a continental climate. Most of the basin is dry and cold in winter, and wet and hot in summer, with an average temperature of 15–20ºC. The atmosphere in the middle and lower reaches of the basin shows a pattern of hot summers and mild winters. The rainy season is from June to September, and the annual rainfall is 900-1000 mm in the upper part of the Basin and 1000-1500 mm in the middle and lower parts.
Data
Landslide Survey
As the first step in producing a landslide susceptibility zone map, a landslide survey is necessary for modeling [23]. We used the China Disaster Database of the Global Disaster Data Platform as a data source, which is a landslide catalog that includes 724 landslides in the Chishui River Basin, including the latitude and longitude locations, geographic locations, scale size, and area attributes of each landslide site. Fig. 2 illustrates the layout of historical landslide sites in the Chishui River Basin.
Data Sources
Landslide susceptibility analysis predicts the magnitude of the likelihood of landslides in a study area based on historical landslide point data and the geo-environmental background of the site [23-26]. In this landslide susceptibility assessment of the Chishui River Basin, we used elevation data, introductory geology, climate and hydrology, geomorphology and topography, human engineering activities, and historical landslide points to select appropriate factors that induce landslides [27, 28]. The Sentinel-2 data have a resolution of up to 10 m, include 13 bands, and are primarily based on Sentinel-2 images. Remote sensing image data were extracted from the Normalized Difference Vegetation Index (NDVI) using ENVI software, and road and river data were obtained from the Open Street Map website. Land use types were obtained from LandGloble30, and fault distances were obtained from a 1:250,000 geological map in the National Geological Database. Digital elevation model (DEM) data were obtained from ASTER GDEM digital elevation data, with a ground resolution of 30 m, and the slope direction, slope gradient, Stream Power Index (SPI), Topographic Wetness Index (TWI), Topographic Position Index (TPI), surface cut, surface roughness, terrain relief, and elevation coefficient of variation were extracted using ArcGIS software. Temperature and precipitation data were obtained from the National Earth System Science Data Center, and lithology, soil, and geomorphology data were obtained from the ISRIC database. The population distribution density was obtained from data from the Seventh National Census. The raster size of each influencing factor was uniformly 30 m.
Research Method
Selection and Analysis of Evaluation Factors
Initial Selection of Evaluation Factors
Landslides can be caused by both natural and human factors. Natural factors include the geological characteristics of the area, the amount of vegetation, temperature, and rainfall. On the other hand, human factors include land use practices such as deforestation, farming, road and river construction, and population density.
Therefore, in the study of landslide susceptibility in the Chishui River Basin, reference was made to historical literature and the analysis of the geological environment characterization of the basin area. Preliminarily, we selected 17 natural factors of landslide susceptibility in the Chishui River Basin area, such as elevation, slope, slope direction, topographic relief, surface roughness, surface incision, coefficient of variation of elevation, landform, lithology, soil, TPI, TWI, SPI, NDVI, air temperature, rainfall, and distance from faults, etc.; in addition to the 4 variables of landslide occurrence due to human behaviors: distance from rivers, distance from roads, land use type, and population density. distance, distance to roads, land use type, and population density.
Analysis of Conditioning Factors
While there is no uniform standard for the number of factors to include, the inclusion of too many factors can lead to an increase in the amount of data and the running time for the evaluation becomes longer; the selection of fewer factors may be inadequate to reveal potential correlations with landslide-triggering factors. Therefore, it is crucial to conduct a preliminary investigation and analysis of the mechanisms that trigger landslides in the study area. The correct selection of applicable evaluation factors can significantly improve the accuracy of vulnerability evaluations for effective disaster prevention and mitigation in disaster-affected areas.
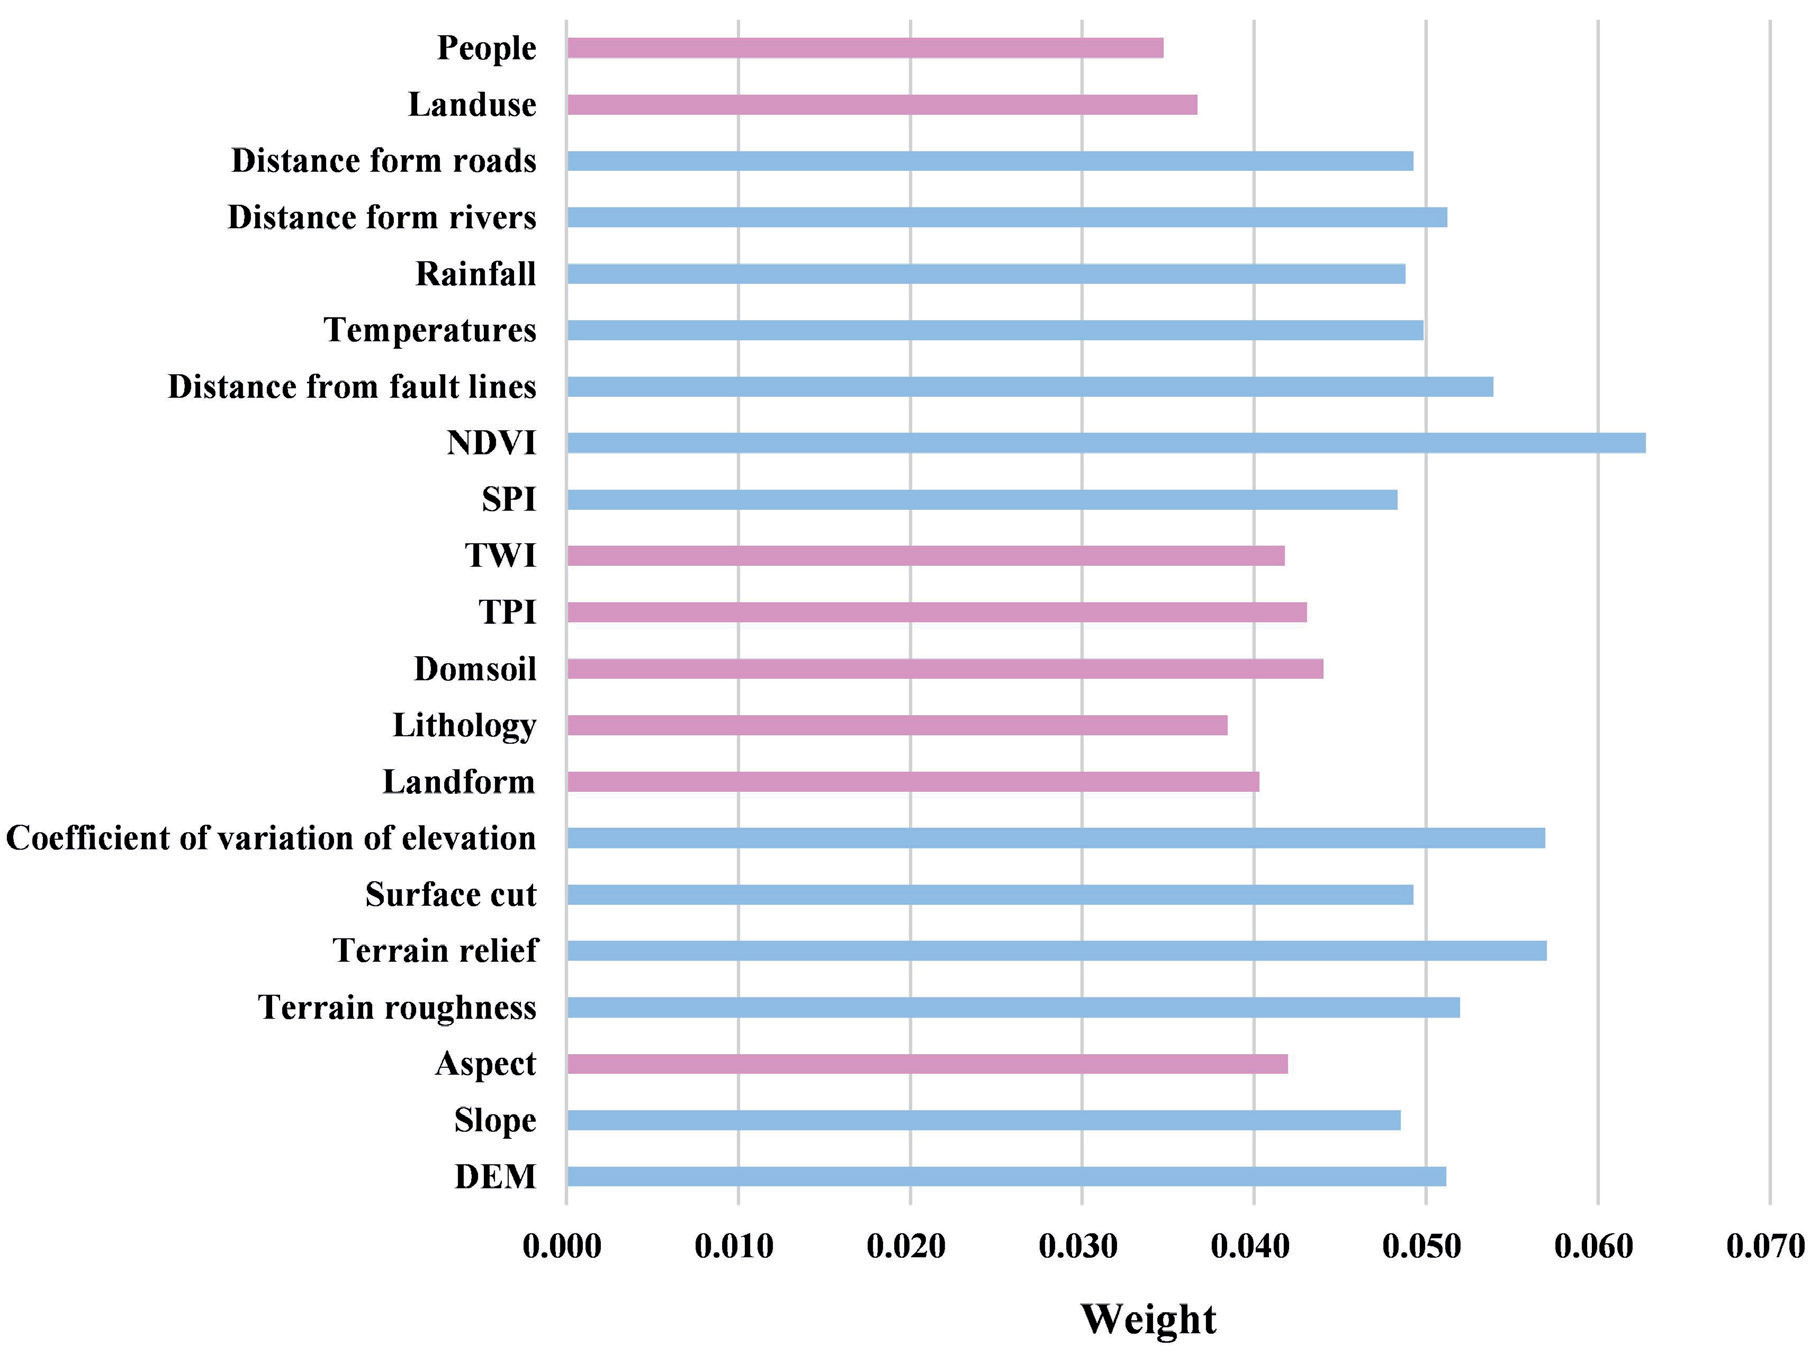
This study used PCA to screen for landslide conditioning factors in the Chishui River Basin. The attribute data of landslide evaluation factors were extracted based on field investigations and a review of the literature, and a landslide attribute database was established. The attribute database of historical landslides was used as the primary dataset for evaluating landslide conditioning factors. The PCA conducted in SPSS software was used to evaluate the weights and correlations of the factors. The weights of the factors were used to screen appropriate landslide conditioning factors so that the results of landslide susceptibility zoning were as accurate as possible.
The relationships between the weights of the 21 evaluation factors are shown in Fig. 3. The weights of the slope direction, geomorphological type, lithology, soil, TPI, TWI, land use type, and population were 0.042, 0.040, 0.038, 0.044, 0.043, 0.042, 0.037, and 0.035, respectively, with a weight value below 0.045. Therefore, the remaining 13 landslide evaluation factors (DEM; slope; NDVI; temperature; precipitation; distance from roads, rivers, and faults; SPI; surface cut; surface roughness; terrain relief; and elevation coefficient of variation) were applied to landslide susceptibility evaluation and susceptibility mapping in the Chishui River Basin.
Methods for Selecting Non-Landslide Points
To avoid errors caused by anthropogenic factors when selecting non-landslide points, we used the information volume model to take the historical landslide points as the dataset and used the 13 landslide conditioning factors identified by PCA to calculate the information quantity of each factor (Table 1).
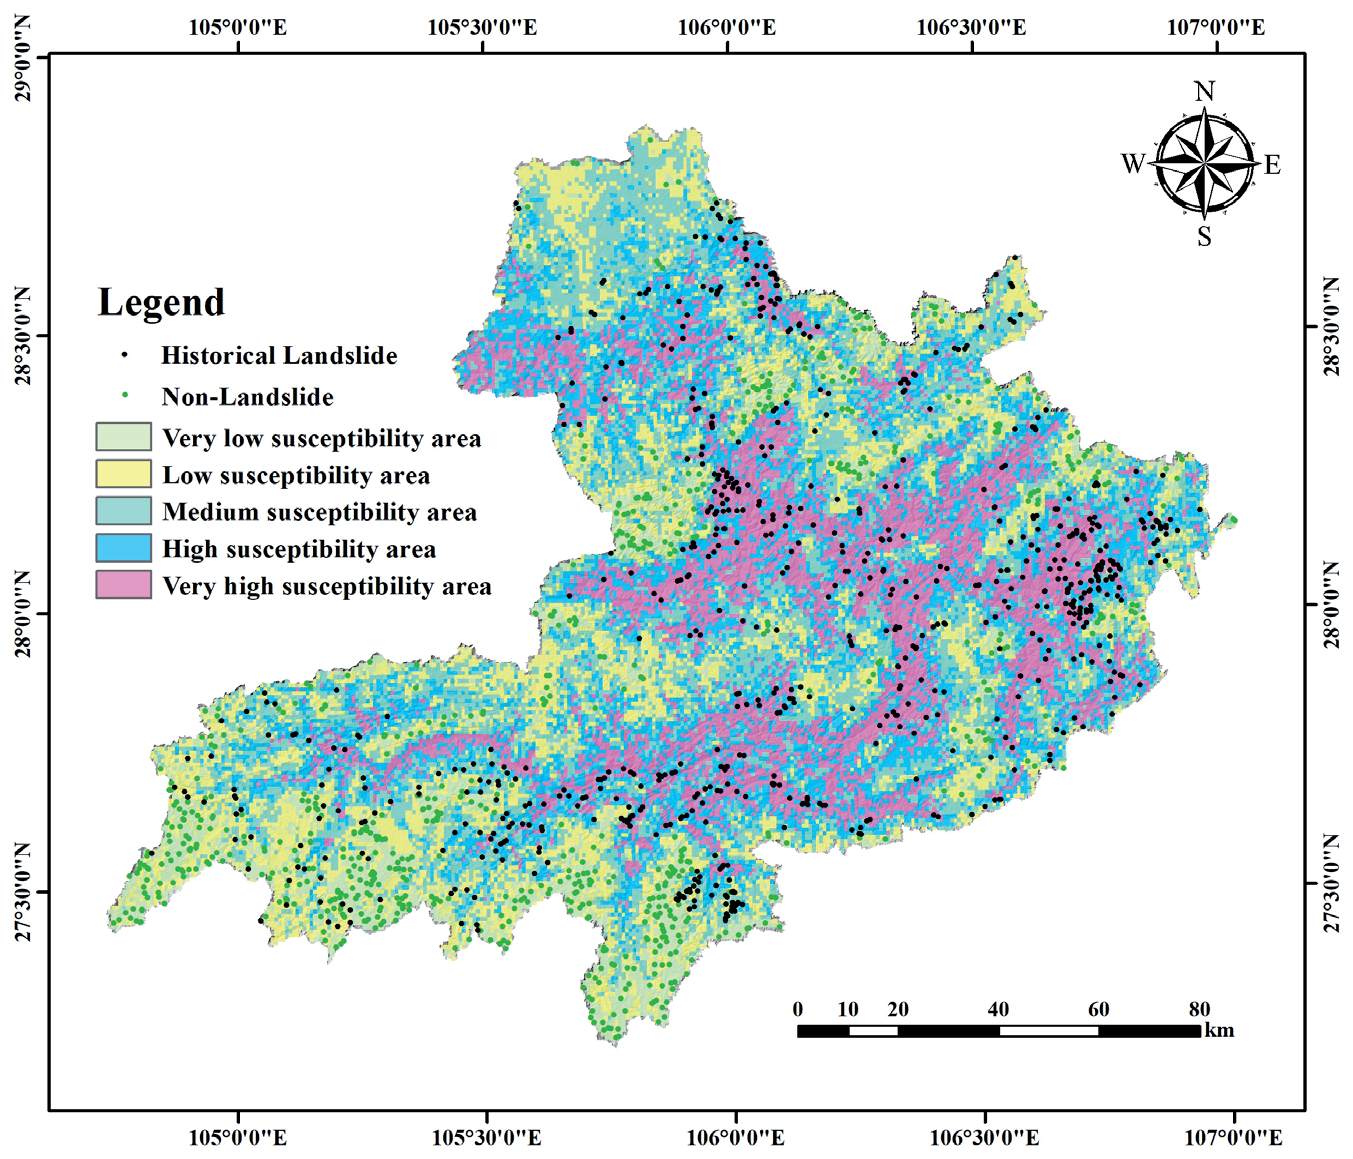
Utilizing the natural breakpoint method through the raster superposition value of the 13 information quantities to divide the landslide susceptibility zones into five grades: very low, low, medium, high, and very high susceptibility (Fig 4). In this study, we used an information volume model to predict landslide susceptibility zones and select 724 non-landslide points in very-low-susceptibility zones.
Neural Network Models
(1) BP model
The BP model is a multi-layer feedforward neural network model similar to human neurons for signaling; it consists of an input layer–implicit layer–output layer structure, which has a remarkable ability to process nonlinear data [29]. The construction of the BP model first requires determining the number of neuron nodes in the input layer (n), the number of neuron nodes in the implicit layer (wij), and the number of neuron nodes in the output layer (m). Next, the hidden layer threshold (aj), output layer threshold (bk), learning rate, number of training iterations, minimum error of training objectives, and excitation function were determined, where the input layer was connected to the hidden layer with weight wi, and the hidden layer was connected to the output layer with weight wjk.
Table 1.
Number of rasters, number of landslides, and amount of information for each category of the landslide impact factor.
In this study, a BP neural network with the structure of “13-6-2” was constructed in MATLAB. The number of neuron nodes in the input layer was 13, the number of neuron nodes in the hidden layer was 6, and the number of neuron nodes in the output layer was 2. The excitation function of the hidden layer was tansig, the function of the output layer was pure-line, and the training function was trainlm, with randomly determined wij, wjk, aj, bk. The number of training times was 1000, the learning rate was 0.01, and the minimum error of the training target was 0.000001.
(2) LSTM model
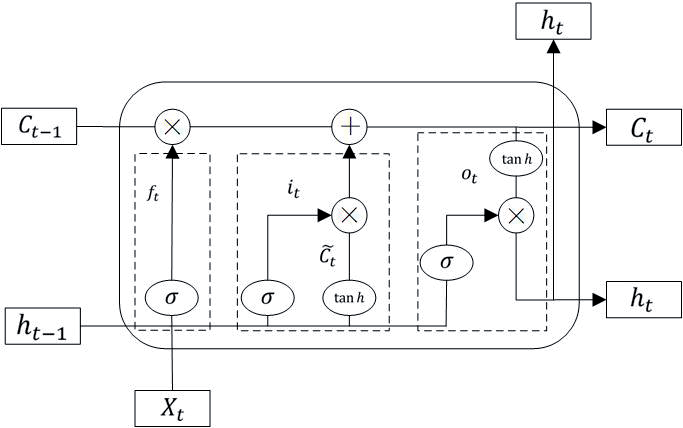
The LSTM model is a deep learning model optimized for RNN models that effectively overcomes the vanishing gradient problem and achieves long-and short-term information memory [30]. With these advantages, scholars in various countries have begun to gradually apply LSTM models to regional landslide susceptibility predictions, allowing information to flow continuously through the point nodes of the model [31]. The structure of LSTM is shown in Fig 5.
The input gate (it) determines whether the new input landslide information features are allowed to be updated and saved to memory, the forget gate (ft) controls whether the memory remembers or forgets the previous landslide information features, the output gate (Ot) determines whether the landslide feature information is allowed to be output, the cellular state (Ct) stores the long-term landslide displacement information, memristors (ht) is responsible for storing the short-term landslide displacement information, and the candidate state (C˜ t ) represents the new displacements of landslides summarized by the recurrent neural network [32].
In this research work an LSTM model was constructed using MATLAB software, its specific network structure contains an input layer with 13 dimensions, six hidden units, a ReLu layer, a fully connected layer, a Softmax function layer, and finally a binary classification layer. To optimize the prediction accuracy of this model, the MaxEpochs were set to 1000, and the MiniBatchSize parameter was also added with a value of 100, as well as the Adam gradient descent algorithm, which resulted in a learning rate of 0.0001 after 700 training sessions.
(3) CNN model
The CNN model is a neural network model initially proposed by LeCun for digital recognition. It differs from other models mainly in its convolutional operation, and has been widely used for image extraction and classification processing [33, 34]. CNN mainly comprises feed-forward neural networks consisting of one or more convolutional, pooling, and fully connected layers [35, 36]. Their local perceptions and weight sharing make it easy to optimize and reduce model complexity [34, 37-41] The convolutional layer extracts the features of the data, and the convolutional kernel performs convolutional computations to obtain the feature layer of the input image. Assuming that the output layer is an M × 2D image, the convolution formula is:
In Equation (1), ymn is the output feature map of the convolutional layer, f is the activation function, w is the convolutional kernel of j × i, and b is the bias [34]. Assuming that there are n landslide conditioning factors in the input data and that the convolutional layer filters m convolutional kernels, the layer has n-m+1 feature vectors. Regularization prevents overfitting, which is followed by classification learning using a fully connected layer. The last layer outputs the probability of landslide category a from the normalized exponential function, also known as the softmax function, assuming that there is an array V. Vi denotes the ith element in Vi, then the softmax value of Vi is
In Equation (2), ε is a natural constant and Si denotes the ratio of index I to the sum of the indices of Vi.
In this study, a CNN was built using MATLAB software, and the specific network model structure was analyzed, which contains a 13 × 1 × 1 input layer, two convolutional layers, two maximal pooling layers, two ReLu layers, a Softmax’s function layer, and finally a binary classification layer. In addition, based on the results of multiple training and prediction, MaxEpochs was set to 500. Moreover, to make model prediction more accurate, the parameter MiniBatchSize was added, with a value of 128. To avoid overfitting, the regularization parameter 1e-04 was used, and the learning rate was 0.0005.
Results and Discussion
Landslide Susceptibility Zoning Results
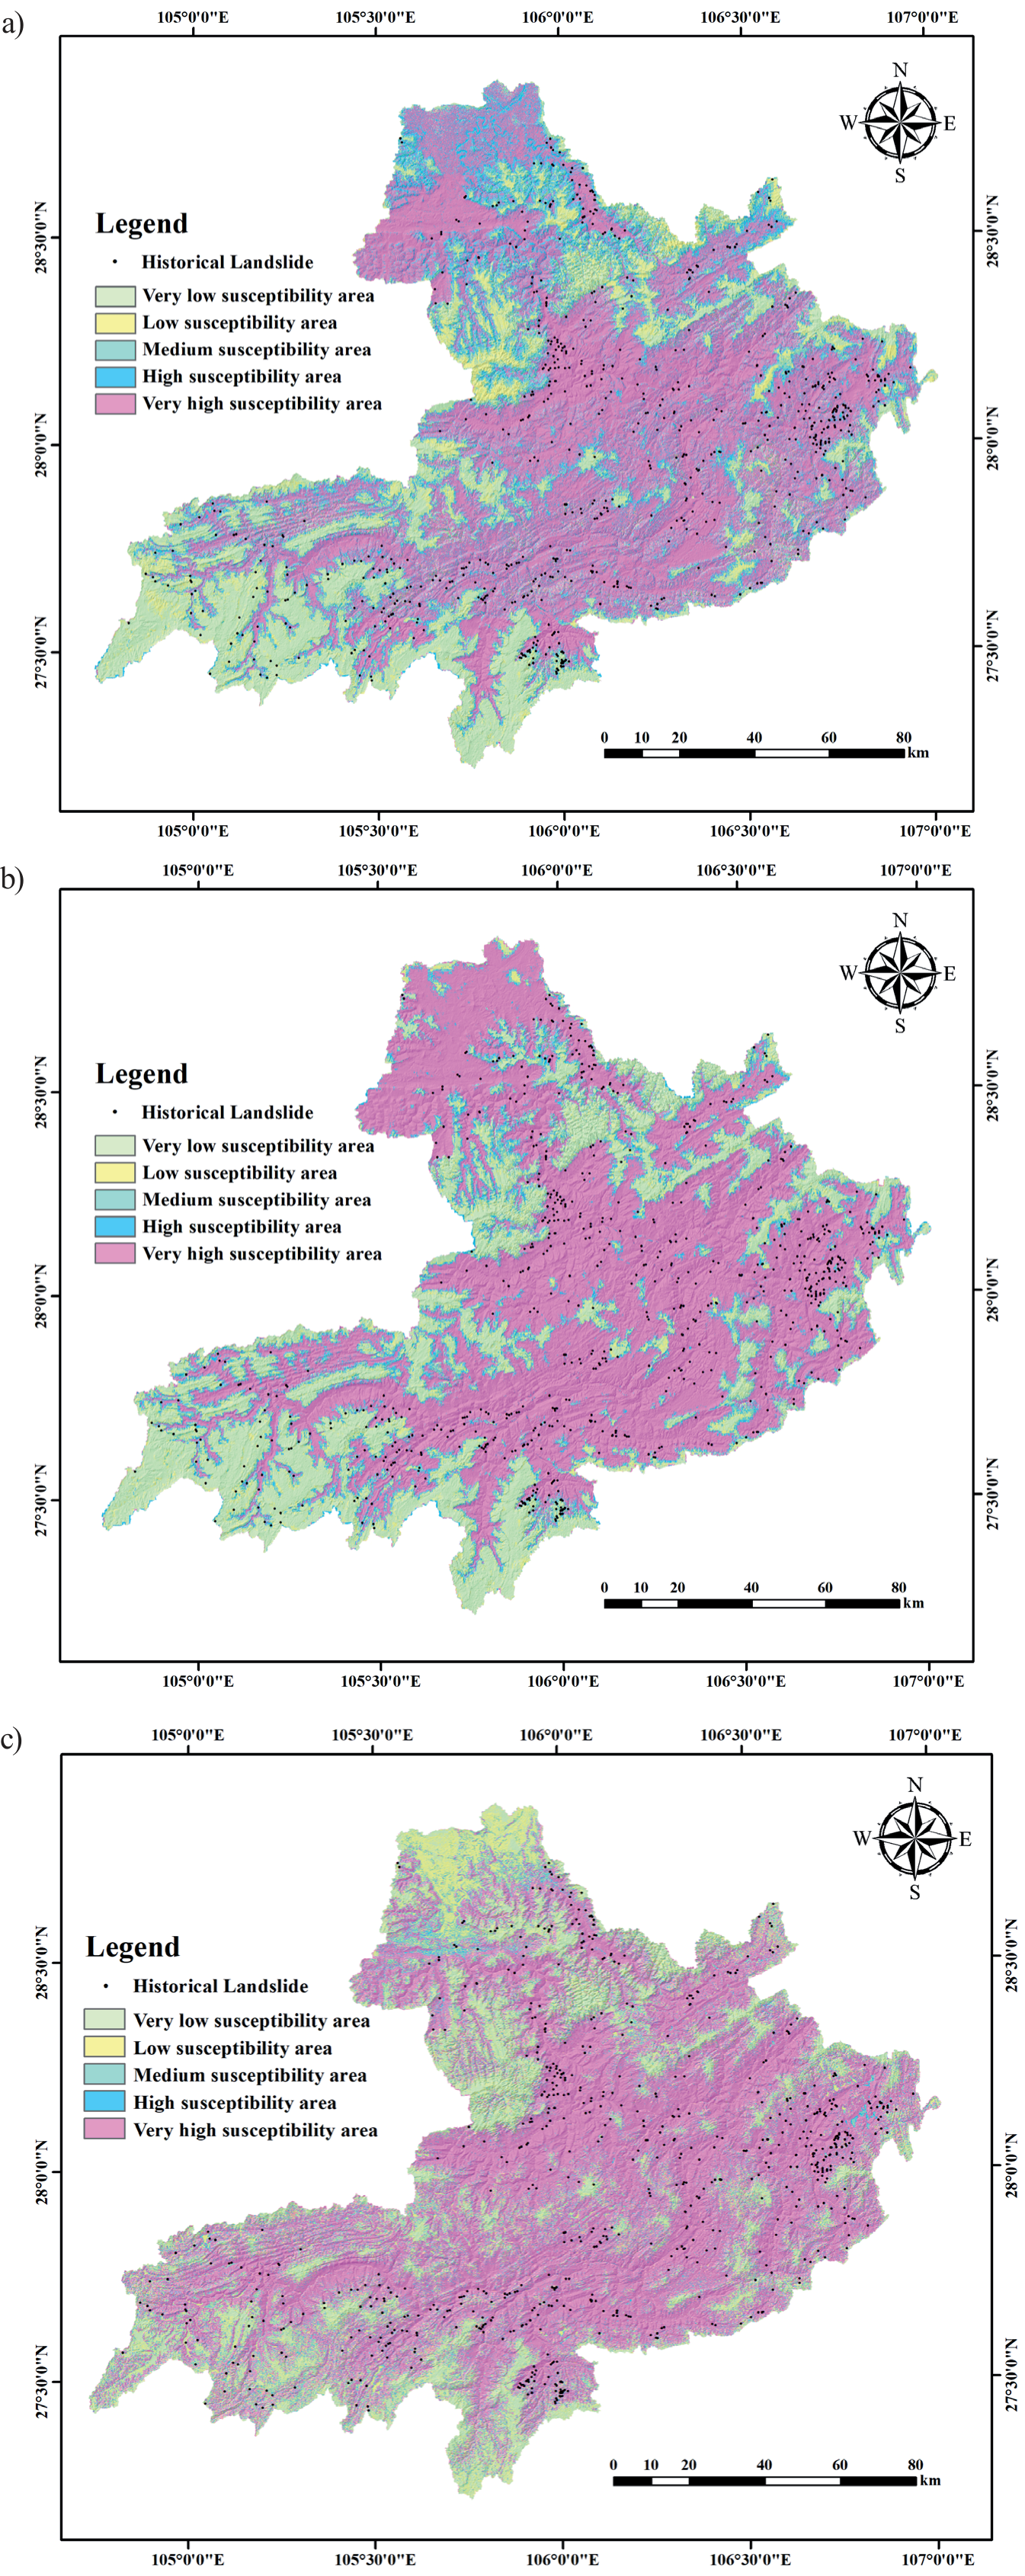
The ArcGIS application randomly generated 724 non-landslide points with a proportion of 1:1 to the number of landslide points in the very-low-susceptibility zone under the information quantity model and constructed a point dataset with 724 historical landslide points. The study area was separated into 20604472 rasters, and ArcGIS was utilized for the raster-to-point operation using a tool for multi-value extraction to points in ArcGIS and extracting the values of the 13 landslide conditioning factors for all raster points in the study area. We randomly selected 70% of the dataset as a training set and the remainder as a test set, and imported the divided training set and test set into MATLAB software to complete the training and testing of BP, LSTM, and CNN. The three trained neural network models predicted the probability of a landslide occurring at all grid points in the study area.
After training the neural network models (i.e., BP, LSTM, and CNN), each raster point resulted in a corresponding landslide susceptibility probability value, and the same natural breakpoint method was used to classify the landslide susceptibility probability value into five categories of susceptibility zones (Fig. 6). According to the susceptibility results of BP, LSTM, and CNN models, the historical landslide point map was “spatially connected” in ArcGIS, and the partitioned area of each susceptibility partition and the distribution of historical landslides were obtained respectively (Table 2). The distribution of historical landslide points in landslide susceptibility zones predicted by different models shows that there are 520 historical landslide points in the very high susceptibility zone predicted by the BP model, and there are 20 historical landslide points in the very low susceptibility zone; there are 599 historical landslide points in the very high susceptibility zone predicted by the LSTM model, and there are 25 historical landslide points in the very low susceptibility zone; the number of historical landslide points distributed in the very high susceptibility zone predicted by the CNN model is the number of historical landslides distributed in the very high susceptibility zone predicted by the CNN model is 604, accounting for 83.43% of the total number of historical landslides, and the number of historical landslides distributed in the very low susceptibility zone predicted by the CNN model is 16, which is only 2.21% of the number of historical landslides. Therefore, the prediction result of the CNN model is closest to the actual situation of the number of landslides in the Chishui River Basin and is effective.
Table 2.
The size of landslide-prone areas and the distribution of historical landslide sites in the prone areas under different models.
Model Accuracy Evaluation
Model accuracy assessment is crucial for landslide susceptibility evaluation. A confusion matrix is commonly used for the prediction accuracy analysis of classification problems. The accuracy, precision, recall, and F1 scores obtained from this matrix are important quantitative metrics for assessing classification results [42-45]. As shown in Table 5, the evaluation indices of the three neural network models were all greater than 0.9, indicating that the evaluation results of these three models had a certain degree of credibility.
Fig. 6.
Landslide susceptibility zoning map under a) BP; b) LSTM; c) CNN models. Fig. 6. Landslide susceptibility zoning map under c) CNN models.
In landslide susceptibility evaluation, previous authors have often used a receiver operating characteristic (ROC) curve in combination with the first four test indicators to validate the susceptibility zoning results and then evaluated the accuracy of the zoning results by calculating the area under the curve (AUC) value [43-45].
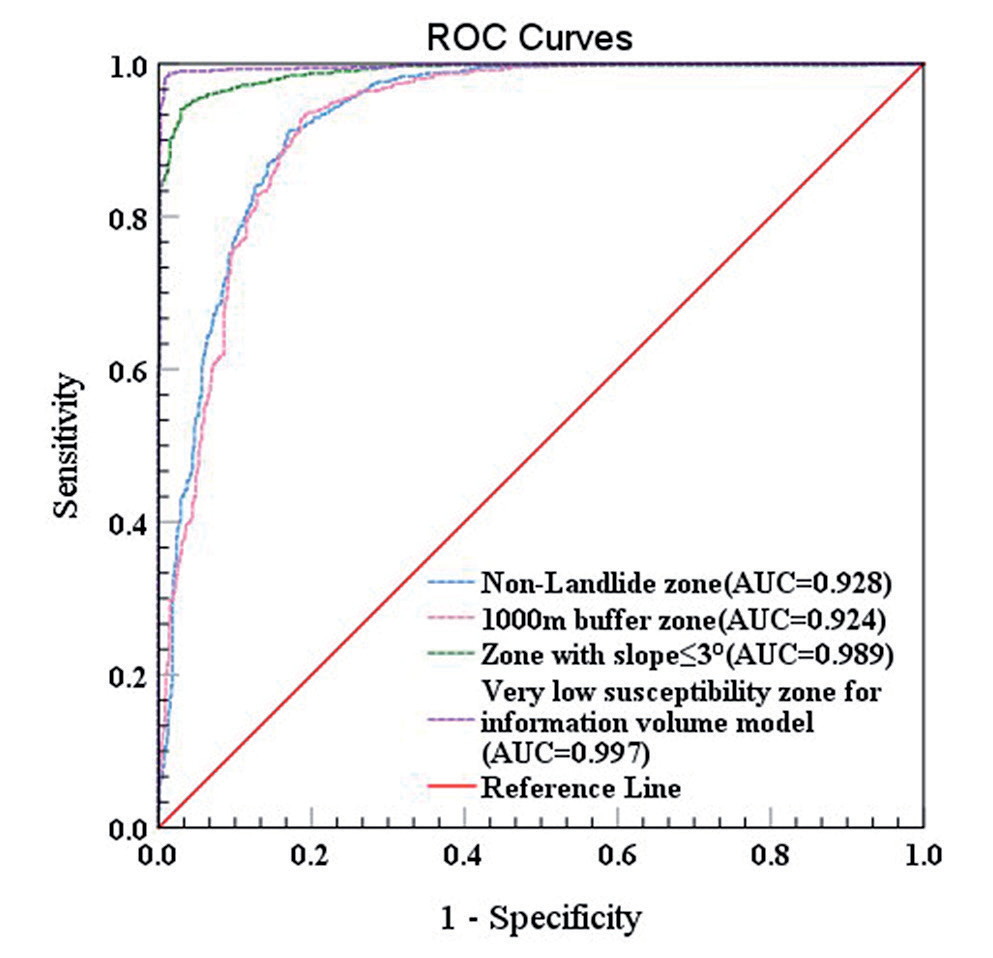
Based on the prediction results obtained from training the three neural network models, SPSS was used to generate the ROC curves. As shown in Fig. 7, the AUC values of BP, LSTM, and CNN were all greater than 0.9. In particular, the AUC value of 0.997 for CNN was significantly greater than that of BP (AUC=0.981) and LSTM (AUC =0.984), indicating that this model had the best fitting and prediction ability for this study area.
Validity of the Information Model for Selecting Non-Landslide Points
In landslide susceptibility assessments, the importance of the correct selection of non-landslide points cannot be underestimated. In addition to the informative model used in this study to select non-landslide points, most recent studies have relied on randomly selected non-landslide sites in areas where no landslides have occurred [46, 47]. In general, the possibility of landslides occurring in low-slope areas, such as rivers and gullies, is slight [19, 48], so low-slope areas derived from the DEM data can be utilized to randomly select non-landslide sites within the area. A buffer zone was established at a certain distance from the historical landslide point, and non-landslide points were selected outside the buffer zone [49-52]. To verify the reasonableness of selecting non-landslide points with the information volume model in this study, four non-landslide point-selection methods were used: random selection of non-landslide areas [44], random selection of low-slope areas with slopes less than 3°, random selection of landslide sites outside the buffer of 1000 m [51], and selection of very-low-landslide-susceptibility zones with the informative model [52]. The selected non-landslide points were input into the CNN model with the best-known susceptibility zoning effect.
Table 3.
Comparison of evaluation indicators of different models.
| Model | Accuracy | Precision | Recall | F1_Score |
|---|---|---|---|---|
| BP | 0.922 | 0.908 | 0.941 | 0.924 |
| LSTM | 0.933 | 0.915 | 0.960 | 0.937 |
| CNN | 0.956 | 0.941 | 0.943 | 0.960 |
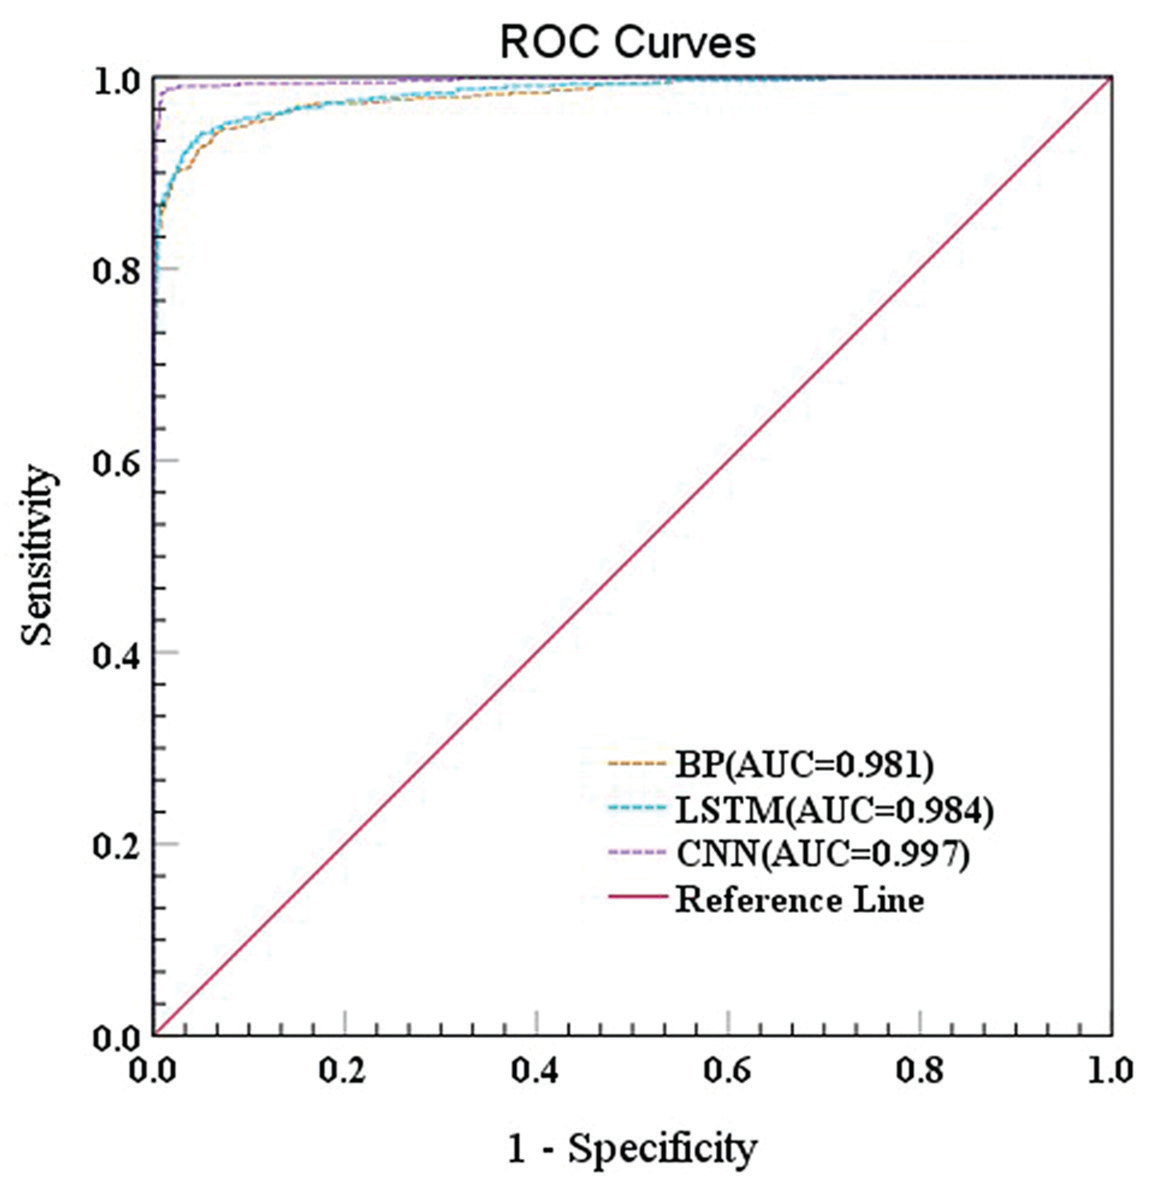
Moreover, based on the ROC curves (Fig. 8), the AUC value of selecting non-landslide points in non-landslide areas was 0.928 and that of selecting non-landslide points in buffer zones 1000 m away from historical landslide sites was 0.924. Setting the slope equal to 3° as a threshold, the AUC value of selecting non-landslide points in areas with ≤3° was 0.989; using the information volume model for the landslide susceptibility zoning, the AUC value of non-landslide points selected in the very-low-susceptibility zone was 0.997, which was the highest AUC value of those found with the four methods. It is clear, feasible, and practical to analyze the landslide susceptibility of the entire Chishui River Basin by randomly selecting the same number of non-landslide points in the very low susceptibility zones of landslides using the information volume model.
In this study, we discarded the previous traditional models and successfully utilized CNN, LSTM, BP, and other neural network models to predict the landslide-prone zones in the Chishui River Basin. Although these three neural network models are more advanced than traditional machine learning models, they may not be able to solve the difficulty when using a large sample size in future research, because the network structure level is not yet deep. Basic neural networks can easily result in lower efficiency of models when training a large amount of data, so we could optimize the model by combining a basic neural network model with an attention module, which only focuses attention on the region of interest and can disregard the unimportant information, which would significantly improve the efficiency of the whole model.
Conclusions
The Chishui River Basin was considered as the study area in this research. We selected 21 influencing factors related to topography and geomorphology, including the essential geological environment, meteorology and hydrology, anthropogenic activities, and vegetation cover to construct a landslide susceptibility evaluation system after field investigation and data collection. In total, 13 landslide factors were used for training and prediction after PCA and ranking factor weights, non-landslide points were selected based on the information volume model, and BP, LSTM, CNN, and other models were employed to evaluate landslide susceptibility and produce landslide susceptibility zoning maps for the study area. These results led to the following important conclusions:
(1) The results of CNN susceptibility zoning showed that the areas of very-high, high-, medium-, low-, and very-low-susceptibility areas of landslides in the Chishui River Basin were 2034.0180 km2, 2838.4950 km2, 1251.0520 km2, 1338.1200 km2, and 11082.3400 km2, respectively. The very-high- and high-susceptibility areas of landslides were mainly located in hilly and mountainous regions that were at a short distance from roads, rivers, and faults, and where the air temperature, precipitation, and soil moisture content were suitable.
(2) The accuracy of the evaluation indices of the BP, LSTM, and CNN models was greater than 0.9, with specific AUC values of 0.981, 0.984, and 0.997, respectively. The evaluation accuracy of the CNN model was better, with better landslide prediction ability, than those of the other two models. These methods showed a significant advantage when dealing with multidimensional factor data from large areas and landslide disaster data.
(3) Of the four methods for selecting non-landslide points in non-landslide areas, 1000-m buffer zones, low-slope zones with slopes below 3°, and very-low-susceptibility zones from the information volume model, the information volume model selected non-slip points as the optimal method with an AUC of 0.997.
(4) The top six landslide conditioning factors were NDVI, elevation coefficient of variation, terrain relief, distance from faults, DEM, and distance from the river, reflecting the extensive landslides in the Chishui River Basin. The complexity and variety of causes were closely related to the geological structure, topography, vegetation cover, meteorology, and hydrology.
In conclusion, this study demonstrated the reliability of CNN in analyzing landslide susceptibility and explored an effective way to select high-quality non-landslide points using an information volume model. The research presented in this study can provide engineers and technicians with a basis for landslide susceptibility evaluations, which can be used to develop appropriate pre-disaster prevention and post-disaster relief programs to reduce the threats posed by existing or future landslides.

