

Introduction
The expansion of built-up land has become a significant component of land use change due to population growth and socio-economic development [1]. Nevertheless, this transition has also given rise to a myriad of issues, including ecological and environmental damages, heightened land incongruity, supplementary land allocation for construction purposes, and the degradation and contamination of land [2]. The extensive and haphazard expansion of built-up land has resulted in suboptimal land utilization [3]. Therefore, strategic land expansion holds significant importance for promoting efficient land use in the region and for the spatial planning of the entire nation [4].
The assessment of the suitability of expanding built-up land involves a thorough evaluation that considers the natural, social, and economic factors of the city. This evaluation is conducted in accordance with ecological protection and construction requirements [5]. Its purpose is to determine the optimal direction for future expansion of built-up land. The selection of indicators and the determination of weights are crucial steps in assessing the suitability of built-up land expansion [6]. In previous research, indicators have predominantly been chosen from the realms of the natural environment and socio-economic circumstances. The inclusion of multiple criteria with varying weights in the evaluation process introduces complexity to the assessment procedure. Various methods can be employed to determine weights, such as factor analysis [7, 8], principal component analysis [9], Analytic Hierarchy Process (AHP) [10, 11], entropy method [12, 13], and gray correlation analysis [14, 15]. The Analytic Hierarchy Process (AHP) is widely acknowledged as a highly effective approach for multi-criteria decision-making. It utilizes a hierarchical structure to depict the relative significance of factors and the relationships within a multi-criteria decision-making framework [16]. Nevertheless, this approach is hindered by its incapacity to address the undisclosed certainty inherent in the decision-making procedure, resulting in imprecise outcomes. The proposed method, known as the entropy method-gray correlation analysis method, offers a more objective approach to calculating assigned weights. This is achieved by substituting the subjective results obtained from the entropy method with the traditional approach of utilizing the value of the discriminant coefficient in gray correlation analysis.
Several established dynamic models have been developed in the field of future land use simulation. These models include logistic regression [17], Markov [9, 10], meta-cellular automata (CA) [18-20], conversion of land use and its effects (CLUE) [21-23], the Future Land Use Simulation (FLUS) model [24, 25], and the Patch Generated Land Use Simulation (PLUS) model [26-29]. The utilization of cellular automaton (CA) models has yielded favorable outcomes in urban area modeling in both local and cross-national investigations. In a study conducted by Li et al. [30], the authors employed a combination of the MCR model and the CA-Markov model to simulate the projected growth of the Wuhan metropolitan area. Their findings indicate that the MCR-modified CA-Markov model holds promise for facilitating environmentally sustainable urban expansion. In their study, Sai Hu et al. [31] employed the gray early warning GM(1,1) model and FLUS model to simulate the anticipated characteristics of land use change in Anhui Province under an ecological optimization scenario. The PLUS model was initially proposed by Xun Liang et al. [32]. This model combines a land expansion analysis strategy with a cellular automaton (CA) model that utilizes various types of stochastic patch seeds. It has the capability to simulate the generation and evolution of multiple types of land patches in a spatio-temporal and dynamic manner. Furthermore, the model can uncover the underlying mechanisms of land use change during the simulation process.
This study focuses on Sanmenxia City as the subject of investigation and assesses the suitability of built-up land expansion by considering constraints related to obstacle factors, drawing upon existing research. The extraction of obstacles to built-up land expansion was conducted based on the natural geography of the study area and the requirements of built-up land development. These obstacles were then categorized into three groups: obstacles related to land resource suitability, obstacles related to ecological service value, and obstacles related to ecological security. The entropy value-gray correlation method is employed to determine the weight of each index for assessing the suitability of expanding built-up land. This allows for the identification of suitable areas for built-up land expansion. Subsequently, the PLUS model is utilized to simulate the prospective land use spatial pattern, taking into account the suitability of expanding built-up land. The findings of this study will serve as a fundamental framework for informing decision-making processes pertaining to land space planning, ecological construction, and urban development in Sanmenxia City.
Overview of the Study Area and Data Sources
Overview of the Study Area
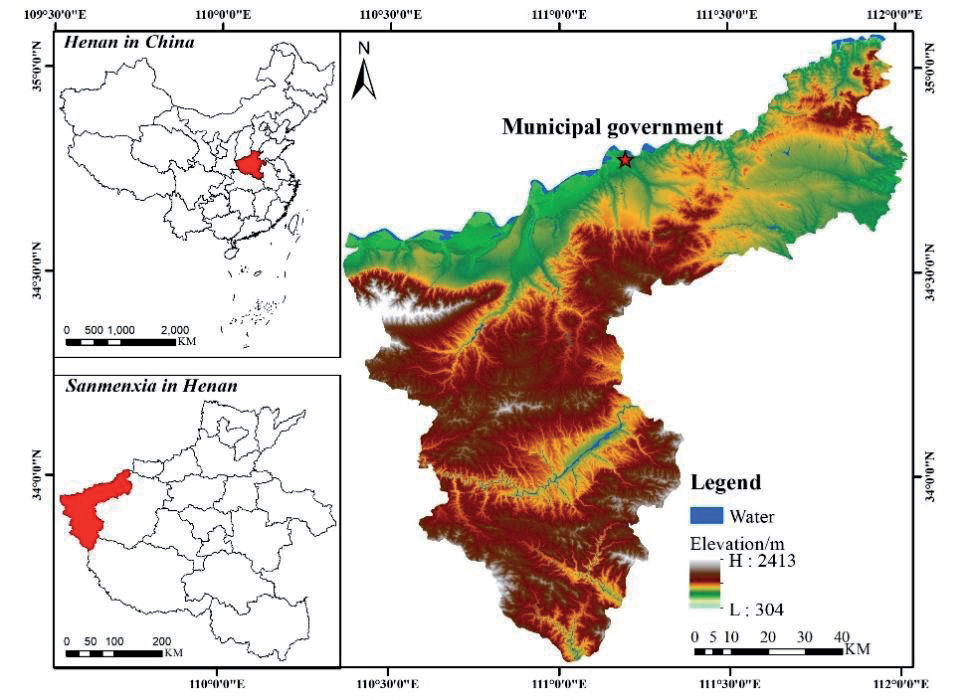
Sanmenxia City is situated in the western region of Henan Province, at the confluence of Henan, Jin, and Shaanxi Provinces. It is positioned between the latitudes of 33°31′24″~35°05′48″N and longitudes of 110°21′42″~112°01′24″E (Fig. 1). The region’s topography is characterized by a prevalence of mountains, hills, and the Sichuan Plateau. It spans a land area of 9936.65 km2, with 5421 km2 designated as mountainous area, 3250 km2 as hilly terrain, and 965 km2 as plains. The area falls within a semi-arid climate, specifically the warm-temperate continental monsoon climate. The average annual temperature is recorded at 14.2℃, and the region typically experiences annual rainfall ranging from 400-700 mm. By the year 2021, it is projected that the overall population of the city will reach 2038 thousand individuals. Among this population, approximately 1182.7 thousand individuals are expected to reside in urban areas, while the remaining 855.3 thousand individuals are anticipated to reside in rural areas. Consequently, the urbanization rate of the resident population is estimated to be 58.03%. The gross domestic product (GDP) of the city amounted to $158.254 billion. The cultivated land area for grain in the city measures 163.93 thousand hm2. The wheat planting area encompasses 75.17 thousand hm2, while the corn planting area spans 60.27 thousand hm2. Additionally, the oilseed planting area covers 13.35 thousand hm2, and the vegetable planting area extends to 32.85 thousand hm2. The urban area exhibits a combined yearly grain yield of 730.6 thousand tons, comprising 359.7 thousand tons of summer grain, 370.9 thousand tons of autumn grain, and 40.1 thousand tons of roasted tobacco. The oilseed production amounted to 38.1 thousand tons. The combined production of vegetables and edible fungi amounts to 1,271,700 tons. The total production of garden fruits amounted to 2682.7 thousand tons.
Data Sources
The dataset used in this study consists of the evaluation indicator system dataset and the driver dataset. The primary datasets encompass land use/land cover data, digital elevation models, meteorological data, and socio-economic data. (1) Raster images of land use in 2010 and 2020 based on the LUCC system reclassified into six categories: cropland, forest land, grass, watershed, built-up land and bare land were provided by the Center for Resource and Environmental Science and Data of the Chinese Academy of Sciences (CRESD); (2) National Aeronautics and Space Administration (NASA) provided 30M resolution digital elevation data and indirectly slope and aspect data; (3) data on railroads and highways was obtained from the National Geographic Information Resources Catalog Service System data;
(4) National meteorological science data sharing service platform provided precipitation and temperature data;
Table 1.
Source of data for the study area.
Table 2.
Evaluation index system for suitability of spatial expansion of construction land.
(5) The Center for Resource and Environmental Sciences and Data of the Chinese Academy of Sciences (CRESD) provided 2019 GDP data in lieu of 2020 data; (6) The 2000-2020 Statistical Yearbook were used to elivit the data on energy consumption and agricultural resources in Sanmenxia City for the corresponding years; (7) Population data were obtained from the Open Space Population Data (WorldPop). Please refer to Table 1 for further information.
Research Methodology
Evaluation of Suitability for Spatial Expansion of Built-Up Land
The adaptability evaluation of built-up land refers to the process of establishing a scientific and reasonable evaluation system based on the natural, economic, social, and policy conditions of construction land, using scientific methods to determine the most suitable planning use of a certain area or a certain plot of construction land.
Establishment of the Evaluation Indicator System
The prevailing body of research primarily focuses on investigating the factors that contribute to the expansion of built-up land, with particular emphasis on the natural environment and socio-economic data. The examination of obstacle factors associated with the driving force theory pertains to the analysis of factors that hinder the expansion of urban built-up land from an alternative standpoint. This entails investigating the factors that exert an obstructive influence on the development of a specific entity, with each driving factor in the process also being subject to scrutiny as an obstacle factor [33]. When selecting indicators, it is important to consider the principle of combining systematicity and hierarchy, comprehensiveness, and generalization. Incorporating the land’s natural resources and the socio-economic status of Sanmenxia City, this research opted for the obstacle factors of land resource suitability, ecological service value, and ecological security. These factors were utilized to establish the suitability of spatial expansion of built-up land, considering the constraints imposed by the obstacle factors. Subsequently, an indicator system was developed to evaluate this expansion, as depicted in Table 2.
The slope data were acquired from the digital elevation model (DEM) through the utilization of the Slope tool in ArcGIS 10.7. The categorization of ecosystem services into supporting services, regulating services, provisioning services, and cultural services is derived from the ecosystem service valuation system proposed by Costanza et al. [34]. This classification is further informed by the table of equivalent factors for the value of China’s terrestrial ecosystem services established by Xie Gao Di et al. [35]. The economic value of a unit of ecosystem services is accurately determined by applying equations (1) and (2) and subsequently revised using equation (3). The calculation of patch density and Shannonville index was performed using Fragstats 4.2 software, utilizing land use classification raster images. The Elastic Ecosystem (ECO) was determined by quantifying land use types using equation (4).
where ESV is ecosystem services value; i is the land use type; j is the type of ecosystem service; Ai is the area of land use type i; VCi is the value of ecosystem services per unit area of land use type i; and ECi is the equivalent value of ecosystem services for a given land use type.
where Ea is the economic value per unit of ecosystem service; i is the type of food crop; mi is the national average price of the ith food crop; and pi is the yields of the ith food crop; Ea is the economic value per unit of ecosystem service; i is the type of food crop; mi is the national average price of the ith food crop (yuan/kg); and pi is the yields of the ith food crop.
where S1 is the area of cultivated land, S2 is the area of forested land, S3 is the area of grass, S4 is the area of water, S5 is the area of built-up land, S6 is the area of unutilized land, and S is the total area.
Standardization of Indicators
Indicators can be categorized into positive and negative indicators based on their influence on ecological vulnerability, and these indicators undergo a process of standardization. Positive indicators suggest a positive correlation between the magnitude of the indicator and the severity of ecological degradation and vulnerability. Conversely, negative indicators suggest an inverse relationship, where higher values of the indicator correspond to improved ecological conditions and reduced vulnerability. Based on the inherent characteristics of the evaluation indicators, the indicators exhibiting a positive correlation with vulnerability were subjected to standardization using formula (5), while the indicators displaying a negative correlation with vulnerability were subjected to standardization using formula (6).
where is the normalized value of the positive indicator and is the normalized value of the negative indicator.
Entropy Method-Gray Correlation Analysis to Determine Indicator Weights
This study utilizes the concept of gray correlation and its mathematical model to replace the subjective results obtained from the entropy method. Instead, it employs the traditional discrimination coefficient ρ in the gray correlation analysis to calculate the indicator weights in a more objective manner. The entropy method is calculated based on formulas (7)-(9), whereas the weight calculation results are derived by combining formulas (10) and (11).
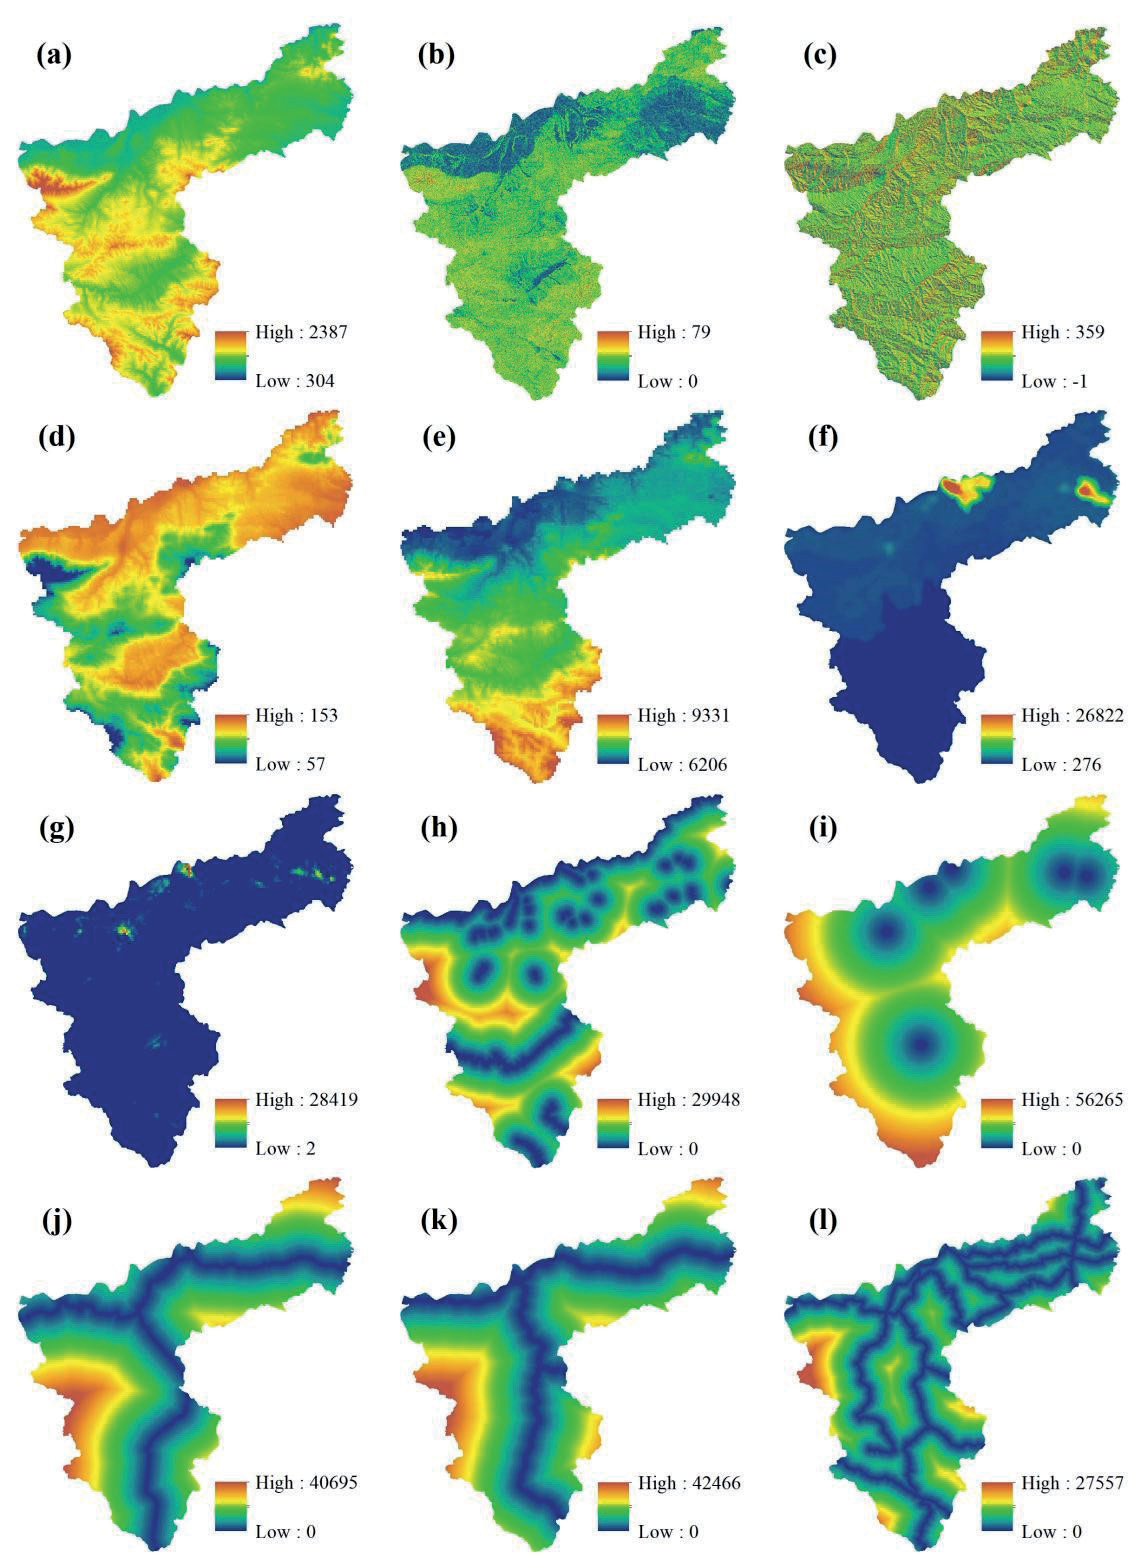
Fig. 2.
The main driving factors of land use change in Sanmenxia (a is DEM, b is Slope, c is Aspect, d is Temperature, e is precipitation, f is GDP, g is population density, h is distance to river, i is distance to administrative area, j is distance to railway, k is Distance to high speed, and l is distance to road).
Where , when , let; ρ is the resolution factor, which takes values in the range of [0,1]; is the minimum difference between two levels; is the maximum difference between the two levels. as the weights of indicators.
Markov Model-Based Land Use Demand Forecasting
The Markov model was employed to forecast the future magnitude of demand for each land use category within the research region. In land use change research, the Markov model is employed to simulate the impact of time phase t on the land use pattern at time phase t+1. The precise computations are illustrated in equation (12):
Table 3.
Parameters of domain weights.
| Land use type | Cultivated land | Forestry | Grass | Water | Build-up land | Unused land |
|---|---|---|---|---|---|---|
| Domain weighting | 0.268 | 0.351 | 0.144 | 0.052 | 0.177 | 0.007 |
where St and St+1 denote the state of the land at time-phase t and time-phase t+1, respectively; t is the year; Pij is the state transfer probability matrix, which denotes the probability of the transfer of land type i to land type j.
Spatial Simulation of Land Use Based on the PLUS Model
The PLUS model is a novel model built upon metacellular automata, utilizing a novel technique to analyze the expansion of land use, resulting in a more comprehensive understanding of the mechanism behind land use change. The model combines the Land Expansion Analysis Strategy (LEAS) rule mining method with the multi-class random patch seeds (CARS) metacellular automata model, which identifies changes in land use types over two periods and investigates the correlation between these changes and the driving factors using the Random Forest algorithm. The LEAS method was employed to determine the growth probability for each land use category within the research area. This information was then combined with the number of image elements, transformation matrix, and domain weights assigned to distinct land use types. Using the CARS model, these factors were used to simulate the future spatial distribution of land use. The procedure consists of the following steps:
Identification of driving factors: Based on the current conditions of the study area and taking into account relevant research findings, 12 driving factors were chosen. These factors include elevation, slope, slope direction, average annual temperature, average annual precipitation, GDP, population density, proximity to rivers, proximity to administrative centers, proximity to railroads, proximity to highways, and proximity to highways (Fig. 2).
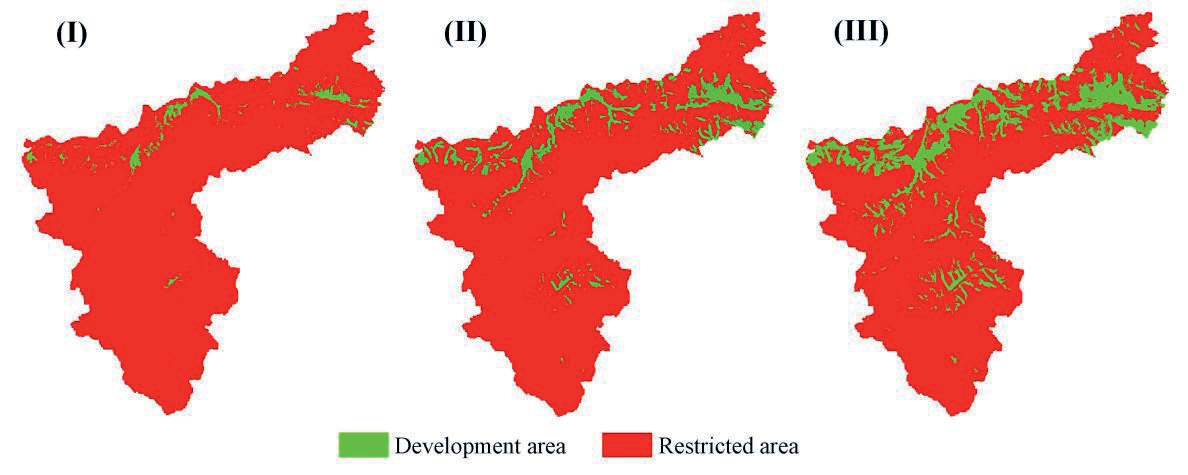
(2) Setting of restrictive areas: The process of determining restrictive areas involves selecting the top 30% of evaluated areas as suitable for built-up land. These areas are further divided into three categories (I, II, and III) using the natural breakpoint method. In ARCGIS 10.7, the areas unsuitable for conversion are assigned a value of 0, while the areas suitable for conversion are assigned a value of 1. These values are used to define the restrictive areas for built-up land (Fig. 4).
(3) Simulation process: The simulation process involves several steps. Firstly, we select land use images from 2010 and 2020. Then, we use the Extract Land Expansion tool to identify the expansion portion of each type of land use between these two periods. Secondly, we combine the land use expansion images with the driving factors and analyze them using the Land Expansion Analysis Strategies (LEAS) module. We use the Random Forest Classification (RFC) method to determine the size of the drivers, the development probability of each land use type, and the degree of influence of each driver on each land use type. Next, we simulate the 2020 land use map using the CA model of multi-class random patch seeds (CARS). Finally, we verify the accuracy of the simulation using the Validation module.
(4) Neighborhood weight parameter setting: The neighborhood weight parameter is determined by calculating the expansion intensity of land use based on the land use images from 2010 and 2020. The values are standardized to a range of 0-1, where a higher value indicates a stronger expansion ability of the land category, the specific neighborhood weight parameters are shown in Table 3.
(5) Accuracy verification: The accuracy verification of the 2020 simulation image and the 2020 real land use image yielded an overall accuracy of 89.42%, a Kappa coefficient of 90.21%, and a FOM value of 0.26. These results indicate that the simulation accuracy is high and it can be reliably used for the 2030 land use simulation.
Land Use Type Transfer Trajectories
Transfer Matrix
The land use type transfer matrix provides an accurate representation of the number of conversions between different land use types during the study period. This matrix is useful for analyzing the quantitative structural characteristics of different types, as well as the direction and quantity of mutual conversions. The mathematical expression for the transfer matrix is shown in equation (13).
where S denotes the transfer matrix during the study period; Sij denotes the area (km²) of the ith land use type converted to the jth type during the study period and n denotes the number of land use types.
Inward and Outward Transfer Rates
The transfer-in and transfer-out rates of land use types quantify the proportion of area that is transferred into and out of a specific type, indicating the level of stability of that type during the study period. The transfer-in and transfer-out rates are computed using a transfer matrix, as depicted in equations (14) and (15).
where Rini and Routi denote the rate of transitions into and out of the ith land use type during the study time period, respectively, and Sij denotes the area of the ith land use type that remained unchanged during the study time period.
Results and Analysis
Characteristics of Suitability for Expansion of Construction Land
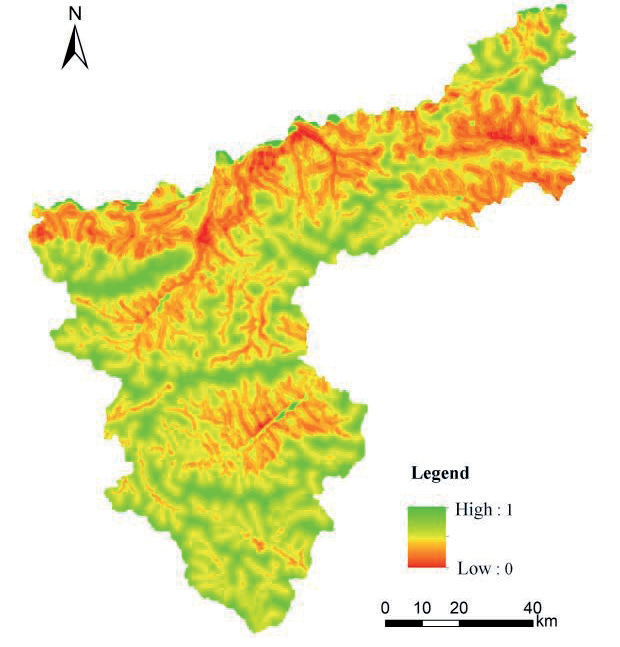
Based on the findings from the suitability evaluation results of built-up land expansion (as shown in Fig. 3 and Fig. 4), it has been determined that the majority of future build-up land expansion in Sanmenxia City will primarily occur in low-lying and gradually sloping areas. These areas are mainly located in the northern plains near the Yellow River, surrounding the central urban area, and alongside the main roads of the city. The expansions primarily consist of the northeastward growth of Lingbao City along Kaiyuan Avenue, the southeastward growth of Sanmenxia City’s central urban area adjacent to the southwestern Shanzhou District and along the inner side of the Lianhuo Expressway and the Lianxiang Line, and the northward growth of Mianchi County bordering Yima City and along the Hengmian Expressway. The distribution tendency primarily follows an east-west orientation, resulting in a pattern of built-up land development concentrated around the central urban area of Sanmenxia City. This development extends outwards on both sides in a strip expansion fashion.
Table 4.
Prediction results of land use area.
Characteristics of Future Land Use Simulation Results and Spatial and Temporal Changes
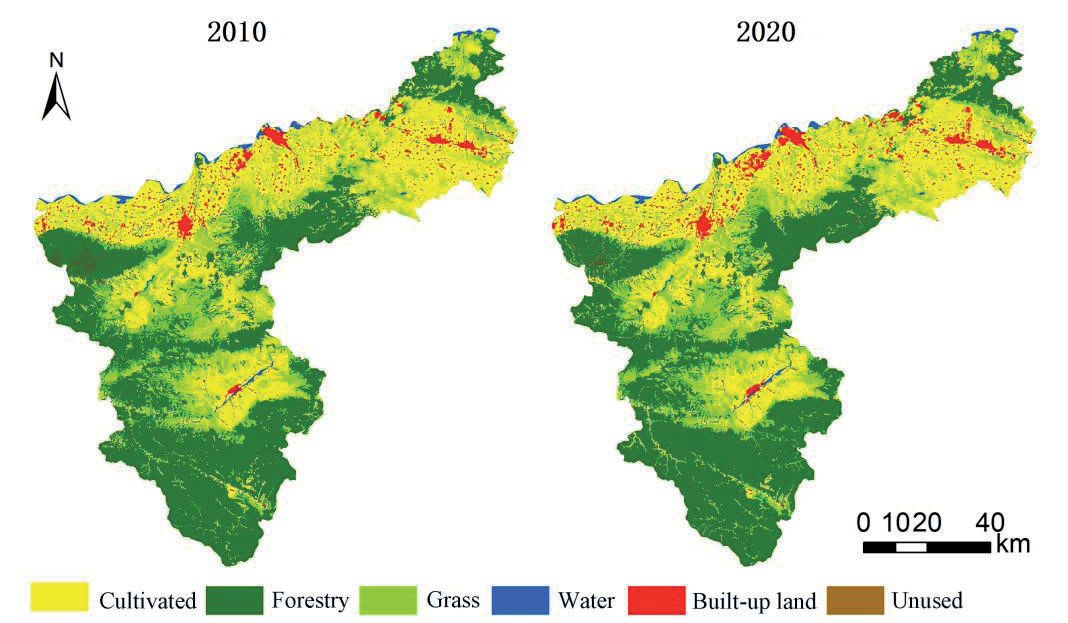
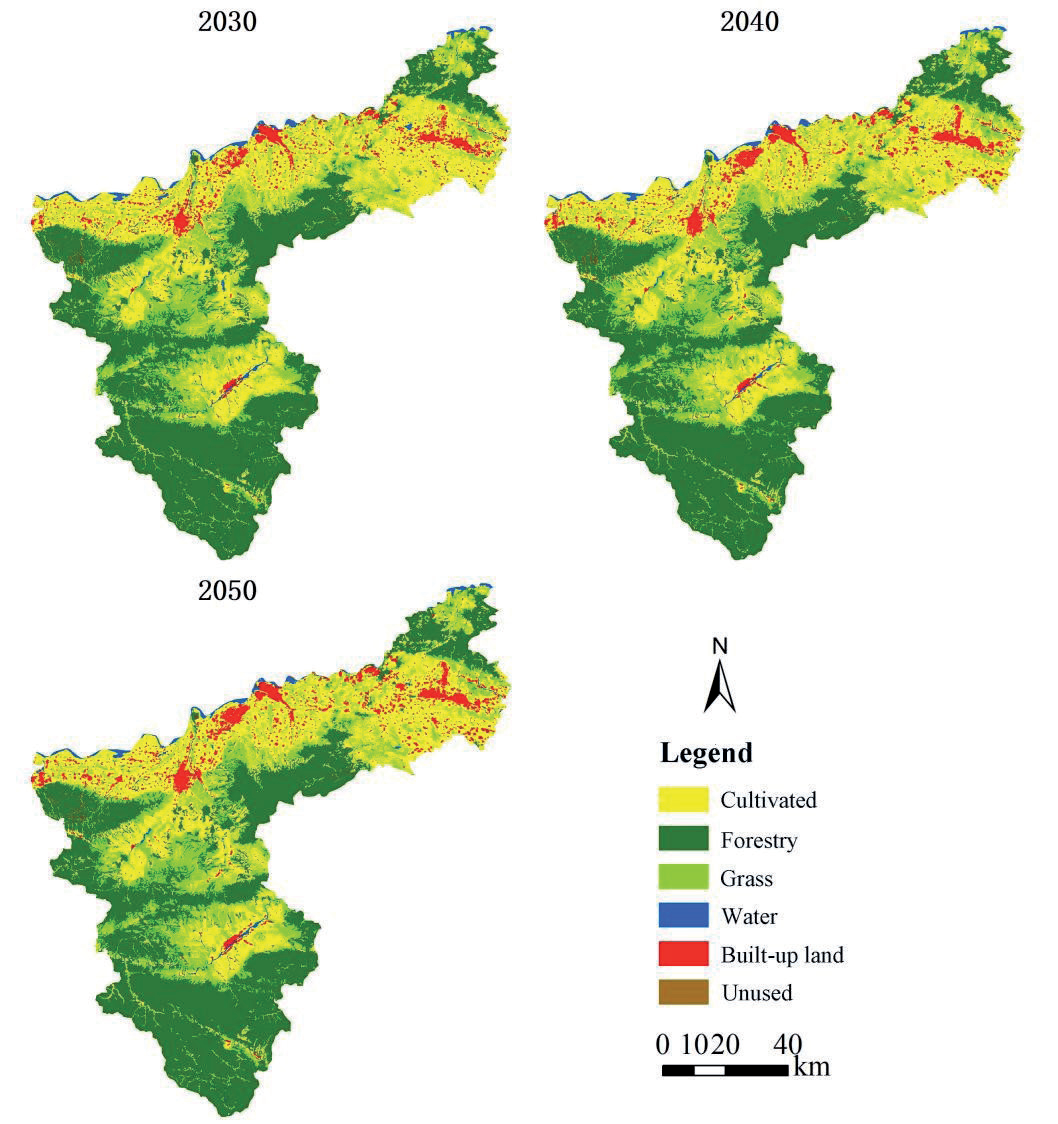
The Markov-PLUS model’s accuracy was verified to ensure it met the requirements. Using the land use maps of 2010 and 2020 (Fig. 5), a future land use simulation was conducted. The simulation considered the three-level suitability of build-up land. As a result, the predicted spatial distribution of land use in Sanmenxia City for the years 2030, 2040, and 2050 was obtained (Fig. 6).
Characteristics of Land-Use Area Change
The future quantities of land use in Sanmenxia City were determined using the Markov method (Table 4). The changes in area and annual change rates (Table 5) were then calculated to analyze the quantities and rates of change for different land use types during various time periods from 2010 to 2050. In general, the cultivated land area will progressively decrease annually, while the areas of forestry and unused land will remain stable. The grass area will exhibit some volatility but will stabilize overall. The overall water area will remain stable, save for a little rise in 2030. Conversely, the built-up land area will experience a significant increase. Out of these, the area of cultivated land experienced the most significant reduction, amounting to 231.65km². The pace of change remained relatively constant throughout each decade. Subsequently, grass exhibits a reasonably consistent rate of change for the initial three periods, but will see a substantial fall in 2040-2050 as the trend of decreasing area becomes less pronounced. The built-up land area will experience the most significant expansion, reaching a total of 218.86km². However, its growth rate will reduce from 16.99% to 9.63%, showing a gradual decline in annual growth. The water expanse will experience a gradual and continuous expansion from 2010 to 2030. However, starting in 2030, the pace of this expansion will begin to decrease, eventually dropping to a mere 1.03% by the year 2050. The forest lands will experience a modest shift, with a yearly growth rate of 0.64% between 2010 and 2050.
The transformation of land use types was assessed by computing the rates of transfer in and transfer out, as shown in Table 6. The transfer-out rate of cultivated land is higher than the transfer-in rate from 2010 to 2050, suggesting a consistent decline in the area of cultivated land during this period. Both the transfer-in and transfer-out rates exhibit a decreasing trend, indicating that the decline in cultivated land has been somewhat managed. The rates of transfer-in and transfer-out for woodland are approximately similar, with values ranging from 0.06 to 3.71. These rates predominantly remain at a very low level, suggesting that the size of the forested area will remain largely stable in the future. The transfer-in and transfer-out rate of grass is significantly higher throughout the period of 2010-2030 compared to subsequent years, indicating that a specific area of grass is experiencing instability during this timeframe. However, it is expected to stabilize after 2030. The water in Sanmenxia City experiences a substantial increase from 2010 to 2020, with both the transfer rate and the transfer rate reaching high levels. However, the transfer rate is substantially bigger than the transfer rate, peaking at 15.43%. This indicates a major expansion of the water area in Sanmenxia City during this period. However, between 2030 and 2040, there is a predominant outflow of water, suggesting a decline in the water area to some degree. This trend is expected to stabilize after 2040. The rate of transfer-in for built-up land throughout the period of 2010-2040 is approximately 18%, signifying a significant increase in the expansion of built-up land. However, the growth rate is somewhat regulated after 2040. The transfer rate of unused land reached 65.08% from 2010 to 2020, resulting in a sharp increase in the unused land during this period. With the decrease of the switching-in rate and the increase of the switching-out rate from 2030 to 2040, the area of unused land will begin to decrease and then begin to stabilize after 2040.
Table 5.
Amount and annual rate of change of land use area in Sanmenxia City, 2010-2050.
Table 6.
Land use transfer rate and transfer out rate in Sanmenxia City, 2010-2050.
Land-Use Transfer Trajectories
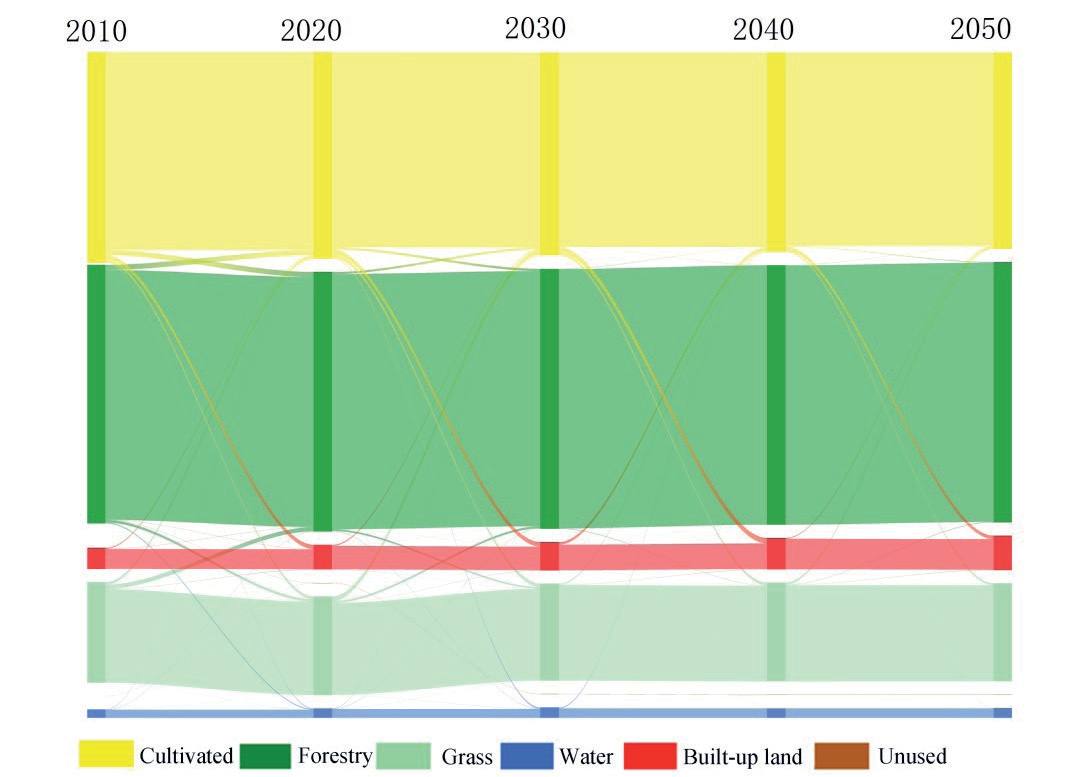
The Sanmenxia City 2010-2050 land use transfer matrix was shown using a Sankey diagram to examine the patterns of land transfer between various categories (Fig. 7). The conversion of cultivated land, forestry, and grass areas achieves a balance of payments between 2010 and 2020. This period experiences the most rapid expansion in unused land, while the conversion of cultivated land and forestry areas leads to an increase in water coverage. From 2020 to 2030, efforts have been made to somewhat mitigate the trend of deforestation and the degradation of forests. Moreover, while the extension of built-up land into agricultural areas has significantly improved, the conversion of cultivated land into water continues to rise, leading to a continuous growth in water areas. Nevertheless, while there is a shift of land from cultivated land areas to grassy areas, the overall cultivated land area is still declining. Between 2030 and 2040, there is a continued increase in built-up land development at the expense of cultivated land. However, the conversion of cultivated land to water is significantly regulated, resulting in a stabilization of water areas on a regional scale. However, during this period, there is an imbalance between the amount of cultivated land and grass, with the conversion of cultivated land to grass being the major trend. The primary source of compensation for cultivated land is derived from built-up land, suggesting that a significant number of illicit and unjustifiable structures were demolished and converted back to cultivated land during this period. The unregulated growth of built-up land has been partially curtailed. Between 2040 and 2050, the increase in developed land has shown the most improvement compared to other years. Additionally, there has been a balance achieved between income and expenditure in cultivated land and grass areas. Furthermore, the tendency of decreasing cultivated land will be well managed throughout this time. The expansion of watersheds and built-up areas reaches a point when it ceases to grow and remains relatively constant. During the period from 2010 to 2050, the predominant occurrence was the significant increase in built-up areas, resulting in the conversion of a substantial portion of fertile land into developed land.
Characteristics of Land-Use Area Change
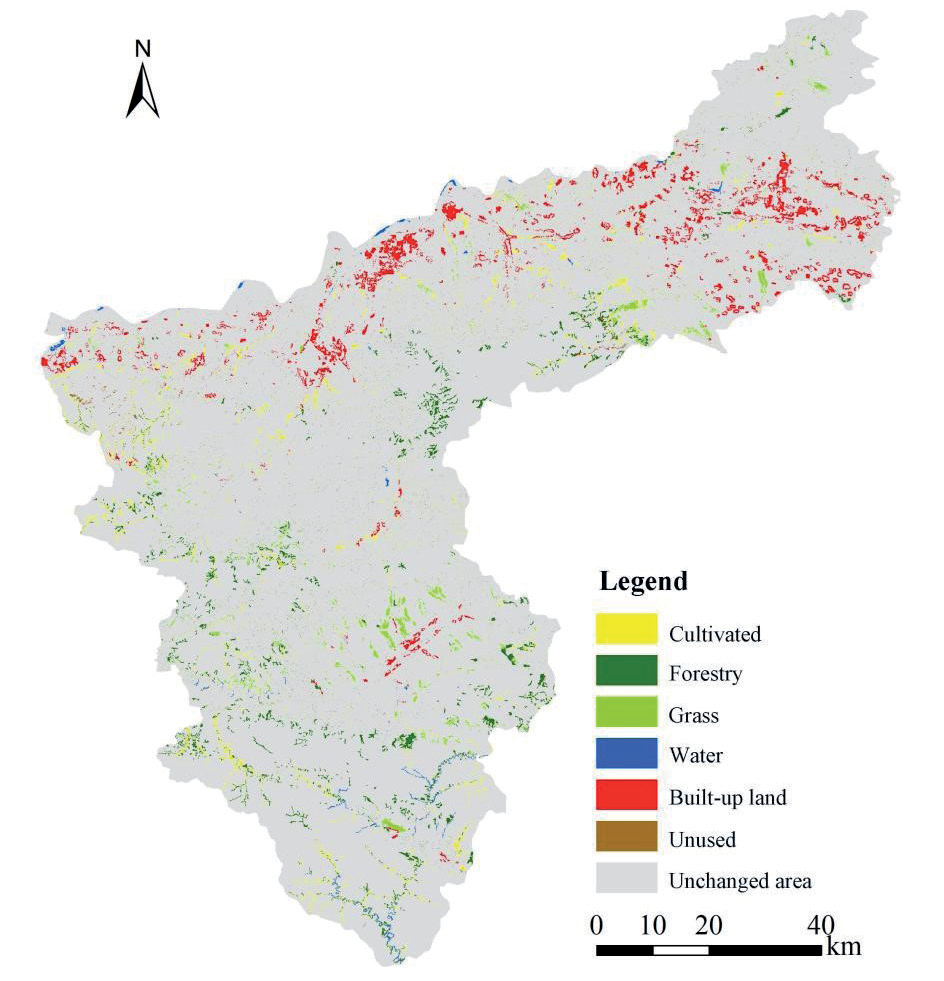
Based on the land use spatial pattern in 2010-2050 (Fig. 5 and Fig. 6) and the land use expansion map in 2010-2050 (Fig. 8), it is evident that the rate of land use change in the northern plains is higher during the period of 2010-2050. This suggests that the land use types in this region are relatively dynamic, although the level of activity varies across different time periods. During the period of 2020-2030, the changes in built-up land use are particularly noticeable, especially when contrasted to changes in other types of land use. These changes primarily occur in the form of expansion around urban areas. The period will witness the primary growth of built-up land in Shanzhou District, with additional clustering of built-up land development in the region. Zhangwan Township, located on the southwest side of Sanmenxia City, will also expand towards Daying Town. Lingbao City will continue to extend upwards along the rivers in the northeastern part of the city. Additionally, Mianchi County and Yima City will continue to share a border and expand northwards along the Hengmian Expressway. The future land use of Sanmenxia City will be planned according to the principles of axial belt development and group layout. The town development space in the Shanling Basin will serve as the primary area for this development. The formation of a belt and group-type town cluster will be based on the Longhai Railway, Lianhuo Expressway, and National Highways 209-310 areas. Additionally, efforts will be made to actively promote the construction of the Mianchi-Yima industrial development wing.
Conclusion and Discussion
This study assesses the suitability evaluation for expansion of built-up land by considering obstacles related to suitability for development, ecological service value, and ecological security. It then uses the results of the built-up land expansion suitability assessment to simulate and predict future land use expansion, treating it as a restricted area for land use development. Finally, it analyzes the characteristics of the changes observed. The primary findings can be summarized as follows:
(1) The majority of the future growth of developed property in Sanmenxia City will mostly consist of low-lying and gradually rising terrain. This land will be located in the northern plains along the Yellow River, as well as in the areas surrounding the center urban area and the main city roadways. The distribution tendency primarily follows an east-west orientation, resulting in a built-up land development pattern centered around the main metropolitan area of Sanmenxia City. This pattern expands in a strip-like manner, expanding outwards on both sides.
(2) From 2010 to 2050, the forestry and unused land area is expected to remain relatively constant. The grass area will fluctuate within a specific range. The water area will generally remain stable, except for a predicted increase in 2030. On the other hand, the cultivated land area will gradually decrease over the 40-year period, with a total reduction of 231.71km². In contrast, the built-up land area will increase by 218.88km², with 90% of it being converted to cultivated land.
(3) Between 2010 and 2050, the rate of land use change in the northern plains zone is very high, with land use types exhibiting quite high levels of activity. Future built-up development will primarily occur in Shanzhou District, with an additional concentration of built-up land in the region. Zhangwan Township, located southwest of Sanmenxia City, will also extend towards Daying Town. Lingbao City will continue to expand along the rivers in the northeastern part of the country. Mianchi County and Yima City will continue to share a border and expand northward along the Hengmian Expressway.
This study establishes the appropriate region for the expansion of built-up land in Sanmenxia City and predicts the future spatial distribution of land use based on this. The findings serve as a valuable guide for the expansion of built-up land and the efficient utilization of land in the area. Nevertheless, there are certain limitations: 1) When constructing the index system to assess the suitability of expanding built-up land, obstacle factors are primarily chosen based on land suitability, ecological value, and ecological safety. However, the selection of obstacle factors does not take into account the connection between built-up land expansion and landscape ecology. In order to more accurately evaluate the appropriateness of developed land, it is necessary to give further consideration to a range of issues in the future. 2) The simulation of future land use only considers the constraint of the suitable area for built-up land expansion, but does not take into account the “three lines”. As a result, the future land use outcomes may diverge from the policy planning to some extent. In order to get more accurate outcomes in the future, it is imperative to thoroughly take into account the policy considerations.

