

Introduction
Rivers are the major pathways for the delivery of freshwater, sediment, and nutrients to the ocean. Riverine discharges play an important role in the hydrological cycle, aquatic ecosystem preservation in rivers, and the geomorphic evolution of rivers. Therefore, monitoring and researching riverine discharge is of great practical importance. Surface runoff is an important link in the land surface water cycle and plays a key role in the exchange of matter and energy in the earth’s land-air system [1, 2], which is an important indicator of global climate change. Global warming has accelerated the process of the surface water cycle, changed the spatial and temporal distribution pattern of water resources and the total amount of water resources, triggered a series of prominent water resource problems, and limited the sustainable development of the ecological environment and human society [3]. In recent years, the impacts of environmental changes on water resources have become the focus of international attention in the fields of hydrology and meteorology, especially in the analysis of the evolutionary pattern of the water cycle and its mechanisms [4, 5].
ENSO is not only an important phenomenon in the process of air-sea interaction on an interannual scale, but also an important signal influencing global interannual climate change. Its development and attenuation can cause regional or even global atmospheric circulation anomalies [6]. The monsoon is one of the influencing factors of climate change, and EASW plays an important role in China’s climate change. Therefore, it is a key circulation system affecting summer weather changes in China [7]. ENSO is an important forcing factor in the interannual variability of the monsoon, altering the intensity of precipitation produced by the EASW by influencing changes in atmospheric circulation and cooperating with the EASW to jointly affect water vapor transport in the monsoon area of China [8, 9]. The cyclic oscillations of ENSO and EASW will inevitably affect the surface runoff process in the watershed.
Most rivers in China are distributed in the East Asian monsoon zone; the basins show significant wet and dry seasonal cycles under the alternating influence of winter and summer monsoons. It has been shown that ENSO and EASW affect the change process of water discharge in different river basins in China, such as the Yangtze River Basin [10, 11], the Yellow River Basin [12, 13], and the Pearl River Basin [14, 15], which mainly modify the runoff process by affecting the distribution of summer precipitation in China, and that different ENSO events have different effects on climate change [16-18], resulting in the existence of different summer precipitation phases and spatial variations in precipitation distribution [19-22].
Previous studies have mostly focused on the single role of ENSO or EASW in the process of water discharge in river basins [5, 16], while the causes of water discharge changes in river basins are very complex. Hence, the combined effect of ENSO and EASW on the change process of water discharge cannot be ignored. The Yangtze River, the largest river in China and the fifth largest river in the world in terms of water discharge, is the source of water resources. Changes in water discharge will affect water resource use and industrial-agricultural production in the entire Yangtze River basin. There are many tributaries in the upper Yangtze River, and the water discharge from tributaries converges into the mainstream of the Yangtze River, which plays a role in regulating the water discharge changes in the basin. However, less knowledge is available on the water discharge changes from tributaries in the upper Yangtze River and the relationship between climatic oscillation and water discharge at different timescales. Therefore, taking the major tributaries of the upper Yangtze River as the research object and selecting the water discharge series at Gaochang hydrological station in Minjiang River, Beibei hydrological station in Jialing River, and Wulong hydrological station in Wujiang River from 1956 to 2018, as well as the ENSO index and the EASW index at the same time, we analyze the change process of water discharge and explore the relationship between ENSO and EASW and water discharge at different timescales. The results of the study can provide a rationale for medium- to long-term water discharge prediction, water resources management, and drought and flood prevention in the Yangtze River Basin.
Overview of the Study Area
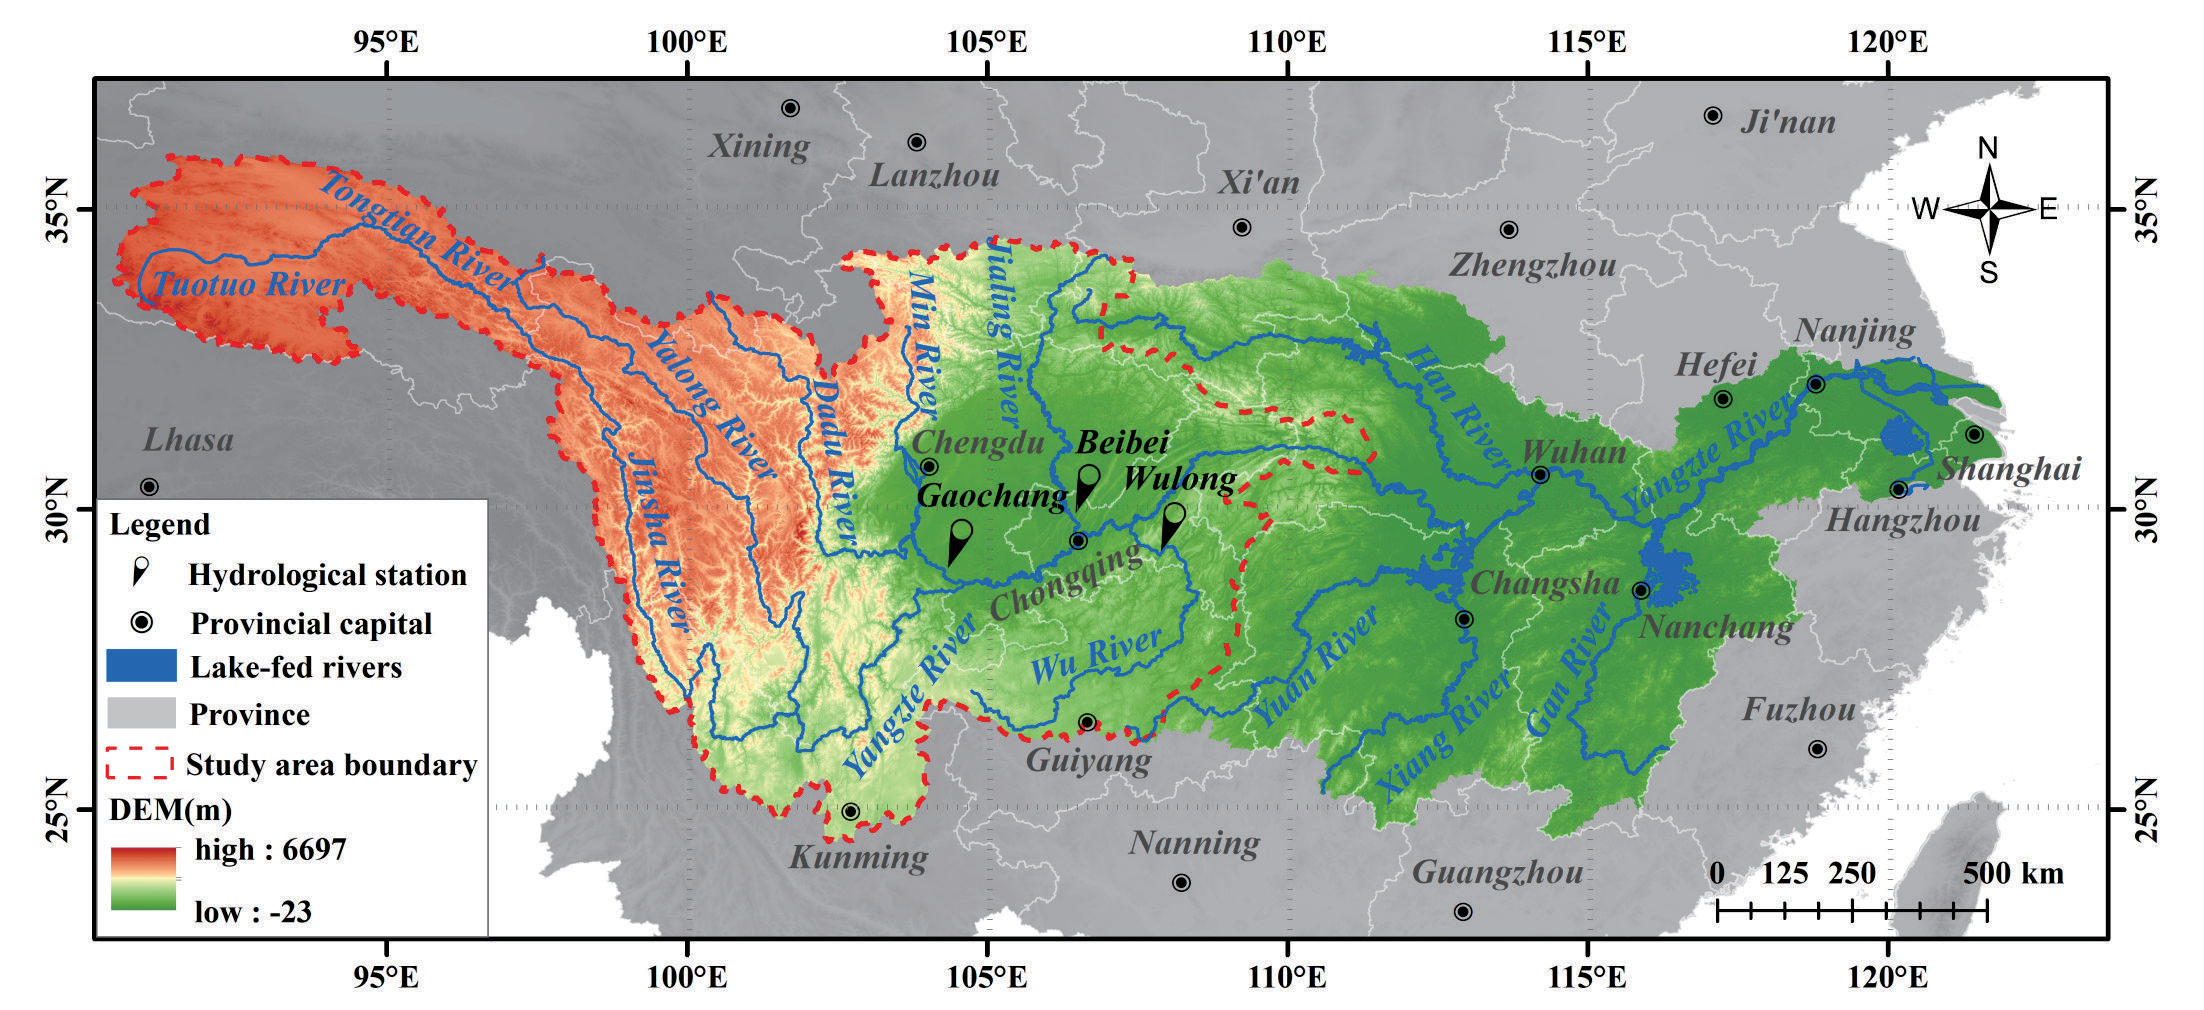
The upper Yangtze River refers to the catchment above Yichang in Hubei province, with an area of 1,005,500 km2 and a total length of 4,511 km. The upper reaches of the Yangtze River span the Western Sichuan Plateau, the Hengduan Mountains, the Sichuan-Yunnan Mountains, and the Sichuan Basin, with great differences in altitude. Influenced by the Tibetan Plateau, the East Asian monsoon, and the South Asian monsoon, the climate is clearly demarcated, with an average multi-year precipitation of 723-1,134 mm and an average multi-year temperature of 8.6 ~ 16.8℃. It flows through Qinghai, Tibet, Sichuan, Yunnan, Guizhou, Chongqing, Gansu, Shaanxi, and Hubei provinces, of which the source of the mainstream section is named the Tongtian River, the estuary of the Batang River in Yushu County to Yibin City in Sichuan province is named the Jinshajiang River, and the area from Yibin City in Sichuan province to Yichang City in Hubei province is named the Chuanjiang River. In addition to the mainstream mentioned above, the major tributaries are the Yalongjiang River, the Minjiang River, the Jialingjiang River, and the Wujiang River (Fig. 1). The Yalongjiang River originates at the southern foot of Ba Yan Ka La Mountain in Yushu Prefecture, Qinghai Province, and flows into the Jinshajiang River in the eastern district of Panzhihua City, Sichuan Province, with a total length of 1,571 km and a catchment area of about 136,000 km2. The Minjiang River originates on the eastern edge of the Tibetan Plateau and flows into the Yangtze River at Yibin City, Sichuan Province, with a total length of 793 km and a catchment area of about 135,400 km2. The Jialingjiang originates in Qinling Mountain and flows into the Yangtze River at Chaotianmen in Chongqing City, with a total length of 1,120 km and a catchment area of about 156,700 km2. The Wujiang River originates at the eastern foot of the Wumeng Mountain in Weining City, Guizhou Province, and flows into the Yangtze River in Fuling District, Chongqing Municipality, with a total length of 1,050 km and a catchment area of 83,300 km2.
Materials and Methods
Materials Sources
The water discharge at Tongzilin hydrological station in the Yalongjiang River has not been adopted because the data time series that can be collected is only from 1998 to 2020. The water discharges at GCHS in Minjiang River, BBHS in Jialingjiang River, and WLHS in Wujiang River are selected for study. The time series of water discharge is from 1956 to 2020 and originates from the Yangtze River Water Resources Commission and the Yangtze River Sediment Bulletin (www.cjw.gov.cn). ENSO events are characterized by the sea surface temperatures (SST) in the Central Pacific region from 4°N to 4°S and 90° to 150°W, which are obtained from the official website of the Centre for Oceanic and Atmospheric Prediction Studies (COAPS) (www.psl.noaa.gov). The East Asian Summer Winds Index (EASWI) is adapted from the standardized values of the June-August latitudinal wind difference at 200 hPa within the East Asian monsoon zone from 10°N to 40°N and 110°E to 140°E [23]. The data originates from the National Tibetan Plateau Science Data Center of China (data.tpdc.ac.cn).
Methods
M-K Nonparametric Test
The M-K nonparametric test is used to analyze the trend changes in water discharge at each hydrological station. This method does not require the variables to be normally distributed, is not disturbed by a few outliers, and is often used to test the significance of trend changes in hydrological elements [24].
Cumulative Distance Level Test and Sliding T-Test
The cumulative distance level test is based on the mean value of hydrological elements. It determines the dispersion degree of data points by observing the difference in the curve and, at the same time, divides the stage changes of hydrological elements through the change trend of the curve [25].
The sliding t-test is a statistical method for testing mutations by examining whether the difference between the means of two groups of samples is significant or not, i.e., whether there is a difference between the means of two sub-series of the hydrological series. It is regarded as a question of whether there is a significant difference between the means of the two aggregates to be examined, which is usually measured by the statistic of t [26]. At a given significance level of α=0.05, the t-distribution table is looked up to obtain the critical value tα. When |ti| > tα, the hydrological sequence at the moment of the datum is considered to have a mutation; otherwise, it is considered that there is no significant difference in the mean values of two subsequences before and after the datum.
Wavelet Transform Analysis
In the early 1980s, wavelet analysis (WA) was rapidly developed on the basis of the Fourier transform, which overcame the limitations of traditional spectral analysis methods. Wavelet transform analysis (WTA) can identify the dominant modes of variability and provide an indication of how those modes vary over different timescales and has been widely used for hydroclimatic series [27, 28]. At present, the application of WTA in hydrology mainly includes the multi-timescale variation characteristics of hydrological series, periods of hydrological series, trend and mutation analysis of hydrological series, and wavelet correlation analysis of hydrological series, etc. [29]. The WTA used in this work followed the method of Torrence and Compo [30], in which the Morlet wavelet was employed as the mother function for the analysis. The prototype formula for Morlet is as follows:
Where η is the independent variable and w0 is the nondimensional frequency.
Assuming the time series under consideration is Xn (n=0, 1, 2, …, N-1, where N is the length of the time series), the continuous WTA of the discrete time series Xn is defined as follows:
Where
Cross Wavelet Spectrum (XWT) and Wavelet Coherence Spectrum (WTC)
The XWT and WTC can investigate the relationship between two time series in time-frequency space [30-32]. The XWT identifies the regions in a time-frequency space where two time series show high common power. The WTC can measure the intensity of the covariance of the two series in time-frequency space.
The XWT of two time series xn and yn is defined as follows:
Where
Where S is a smoothing operator. It is noted that this definition closely resembles that of a traditional correlation coefficient, and it is useful to think of the WTC as a localized correlation coefficient in the time-frequency space. The significance level for the XWT and WTC is estimated using the Monte Carlo method [33]. In this study, the XWT and WTC were applied to examine the relationship between ENSO-EASW and the water discharge series from the main tributaries in the upper Yangtze River at interannual and decadal timescales, and a 95% confidence level is used.
Since a natural phenomenon is often affected by a combination of factors, it is necessary to extend the WTC to the multivariate wavelet coherence spectrum [34]. Assuming that X is a multiple predictor variable and Y is a response variable, the multivariate wavelet coherence spectrum (MWTC) on wavelet scale (s) and time (t) can be defined by the following equation:
Where
Results and Discussion
Characteristics of Water Discharge Change
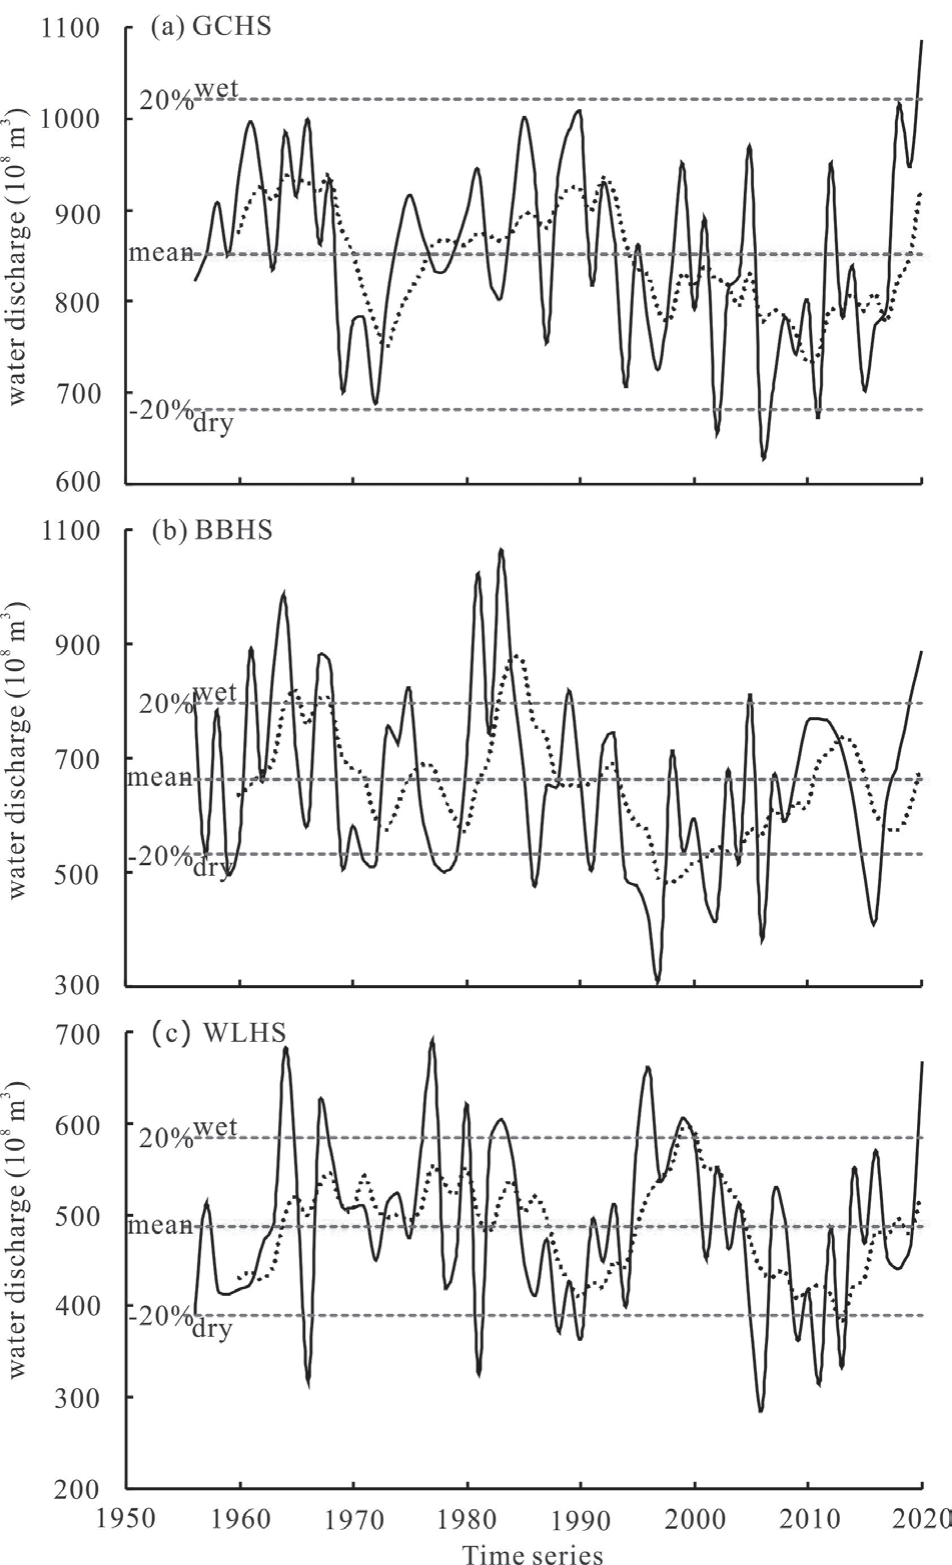
The multiyear average water discharges at GCHS in Minjiang River, BBHS in Jialingjiang River, and WLHS in Wujiang River from 1956 to 2020 were 8.51×10¹⁰m3, 6.64×10¹⁰m3, and 4.87×10¹⁰m3, respectively. The maximum annual water discharges occurred in 2020, 1983, and 1977, respectively, and the minimum occurred in 2006 at GCHS and WLHS, and in 1997 at BBHS (Fig. 2), which may be caused by the strong ENSO that occurred in 1997 and the mega-drought climate in Sichuan and Chongqing in 2006 [35, 36].
The wet-dry water discharge at each hydrological station from 1950 to 2000 was divided according to the hydrological forecasting specifications prepared by the Information Center of the Ministry of Water Resources of China. The GCHS has 1 wet year and 3 dry years, the BBHS has 14 wet years and 20 dry years, and the WLHS has 9 wet years and 10 dry years (Fig. 2). The overall characteristics of interannual variability of water discharge are expressed by the coefficient of variation (Cv), which reflects the relative degree of variability of regional water discharge. Cv less than 0.2 indicates small fluctuations in annual water discharge, Cv in the range of 0.2-0.25 indicates moderate fluctuations in annual water discharge, and Cv in the range of 0.25-0.45 indicates large fluctuations in annual water discharge [37, 38]. The magnitude of the Cv reflects the degree of dispersion of annual water discharge relative to the multiyear average water discharge and can be used to evaluate the temporal distribution of water discharge. The Cv values of water discharge at each station from 1950 to 2020 were 0.117, 0.224, and 0.192, respectively, indicating that the interannual fluctuations of water discharge were relatively calm and the interannual distribution was relatively uniform. As far as the three tributaries are concerned, the interannual fluctuation of water discharge in the Minjiang River basin is the smallest, and that in the Jialingjiang River basin is the largest.
It can be seen from the 5-a sliding average process line of each hydrological station (Fig. 2). The water discharge at GCHS in the period of 1968-1973 and 1993-2010, BBHS in the period of 1968-1973 and 1985-1998, and WLHS in the period of 1985-1990 and 1999-2013 showed a significant downward trend, while the rest of the period showed fluctuating changes or an upward trend. Generally, the annual water discharge at each hydrological station from tributaries in the upper Yangtze River from 1956 to 2020 is characterized by the alternation of rising and declining; the potential caused may be related to climatic factors such as rainfall, air temperature, evapotranspiration, etc. [38].
The Trend Change of Water Discharge
The statistical values (Z) of the M-K non-parametric test for water discharge at each hydrological station from 1956 to 2020 are shown in Table 1. The water discharges at all hydrological stations show a decreasing trend change. The Z of GCHS is -2.08, which exceeds the critical value (±1.96) of α=0.05 significance test, indicating a significant decreasing trend change. The Z of BBHS and WLHS are -1.72 and -0.49, respectively, which did not exceed the critical value (±1.96) of α=0.05 significance test, indicating a non-significant decreasing trend change.
The trend changes in water discharge from tributaries in the upper Yangtze River show a decrease, which may be caused by the increase in average temperature, decrease in precipitation, and increase in evaporation in the upper reaches in the mid to late 20th century [38]. The Z gradually increased and the significance gradually weakened from GCHS to WLHS, which is not only the influence of natural factors, such as climatic factors, vegetation coverage, and topography, but also the difference in the intensity of human activities [39]. The middle and lower reaches of the Minjiang and Jialingjiang River basins are located in Sichuan Province, which has more water conservancy projects and is an important irrigation area in the upper Yangtze River [40]. Reservoir storage and expansion of reservoir area increase evaporation, which reduces water discharge from the basins, and agricultural irrigation also uses water, which reduces water discharge from the basins.
Mutations of Water Discharge
To analyze whether there is a mutation in the change of water discharge, the cumulative distance level test was applied and further verified by using the sliding t-test. According to the cumulative distance level curve of the water discharges (Fig. 3), changes of the water discharge at GCHS can be divided into four stages: 1956-1969, 1969-1973, 1973-1993, and 1993-2018 (Fig. 3a), changes of water discharge at BBHS can be divided into four stages: 1956-1968, 1968-1979, 1979-1993, and 1993- 2018 (Fig. 3b), and changes of water discharge at WLHS can be divided into four periods: 1956-1985, 1985-1993, 1993-2004, and 2004-2018 (Fig. 3c). The mutation years were further examined by the sliding t-test (Fig. 4). The mutation years at GCHS were 1969 and 1993, those at BBHS were 1993 and 2004, and those at WLHS were 1993 and 2004.
Table 1.
Z of the M-K non-parametric test for water discharge at each hydrological station. (“-” indicates a decrease in the table).
| Tributary | Hydrological station | Z | Trend | Significance |
|---|---|---|---|---|
| Minjiang River | Gaochang | -2.08 | Decrease | Yes |
| Jialingjiang River | Beibei | -1.72 | Decrease | No |
| Wujiang River | Wulong | -0.49 | Decrease | No |
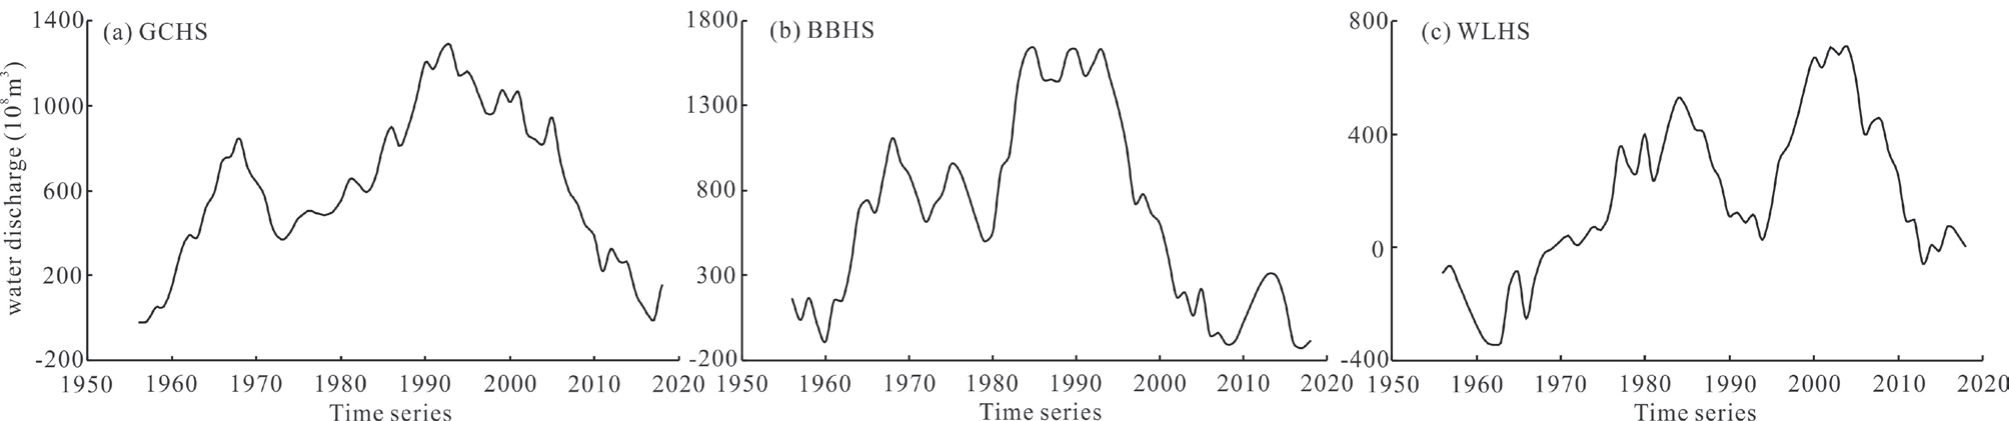
Fig. 4.
Sliding t-test for mutation years of water discharge. (The black dashed line is the α=0.05 significance level line.)
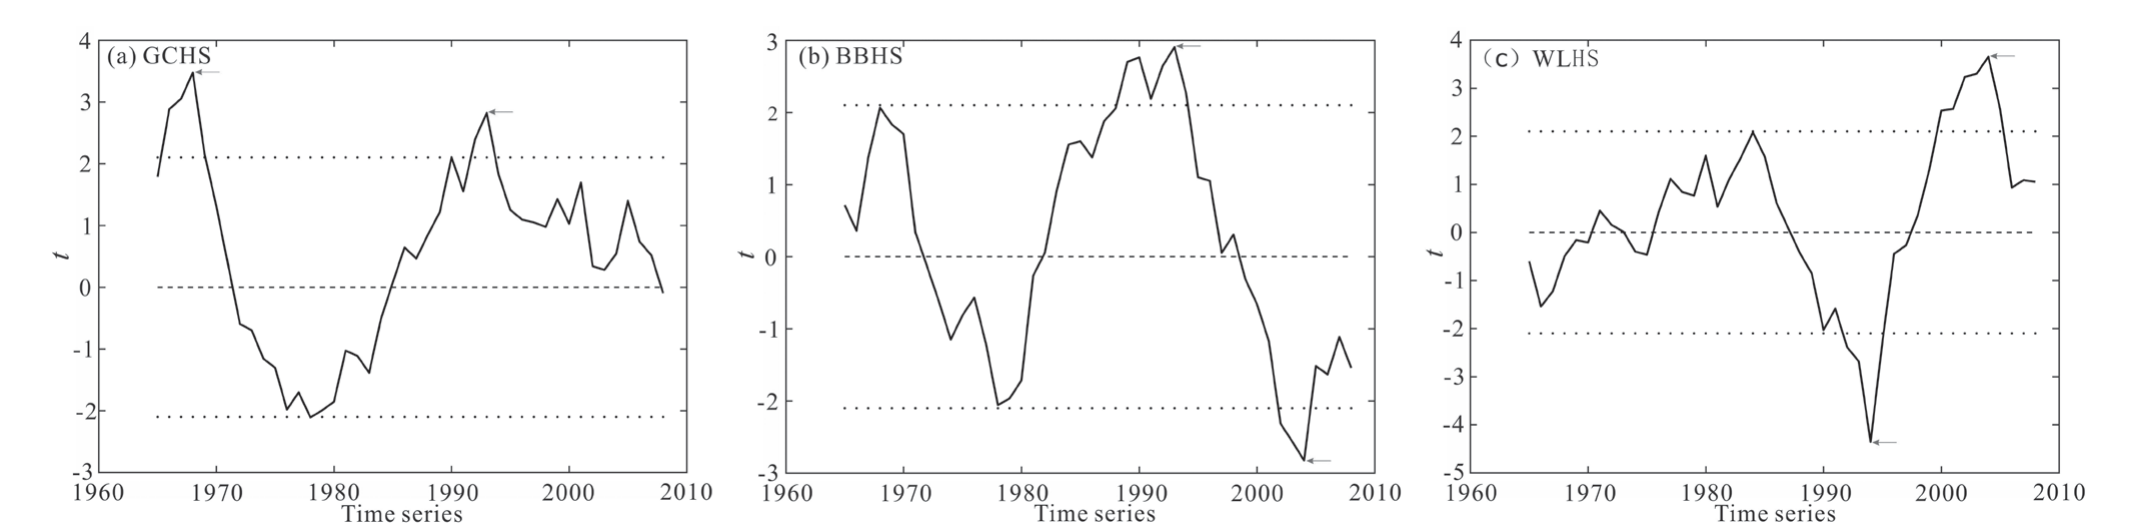
Fig. 5.
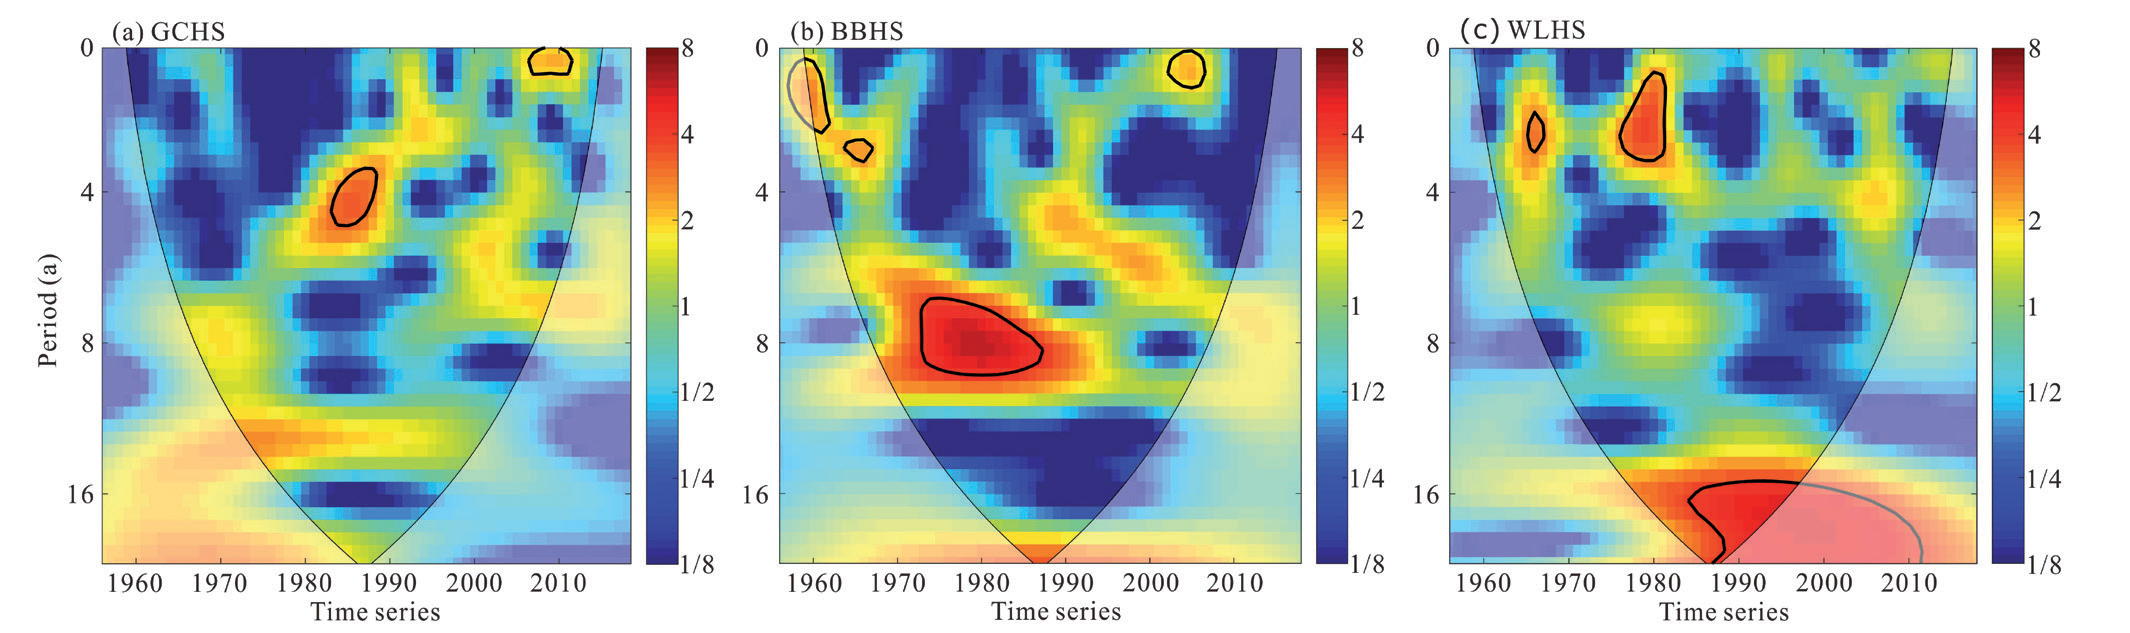
WT of water discharge at each station. (Blue represents the valley value of the energy density, red represents the peak value of the energy density, the thin solid line represents the Cone of Influence (COI) with the effective spectral value region inside it, and the thick solid line closure indicates that the value passes the 95% confidence level test.)
Combining the above analyses, the mutation years of water discharge at GCHS are 1969 and 1993 (Fig. 4a), at BBHS, 1993 (Fig. 4b), and at WLHS 1993 and 2004 (Fig. c). The statistic values (t) of each station exceed α=0.05 significance test level (Fig. 4), indicating the mutation years are significant, which is basically consistent with the previous studies [41-43]. The water discharge of all hydrological stations changed abruptly in 1993, which was related to the launch of the key soil-water erosion control project in the upper Yangtze River in 1988. The project resulted in a significant increase in vegetation cover; e.g., the area of soil-water conservation in the basin increased from 1.5 million km2 in 1993 to 3.0 million km2 in 2012, and the area covered by vegetation also increased by 14% [44]. Furthermore, vegetation has an impact on water discharge through transpiration. The water discharge at GCHS changed abruptly in 1969, which may be related to the construction of the Bikou Reservoir, and the water discharge at BBHS changed abruptly in 1993, which may be related to the water storage in Tongjiezi Reservoir for power generation [45]. Human intervention, such as reservoir construction and soil-water conservation in the Wujiang river basin is relatively low, but rainfall has shown an increasing trend in the same period [46]. Therefore, the water discharge at WLHS is mainly influenced by climatic factors which changed from falling to rising in 1993.
Periods of Water Discharge
To explore the periodic variations in water discharge at different timescales, the WT was applied to analyze annual water discharge at GCHS, BBHS, and WLHS from 1956 to 2018. The water discharge at GCHS has periodic variations at timescales of 2 years from 2006 to 2012 and 4 to 6 years from 1983 to 1989, which are significant at the 95% confidence level, and has periodic variations at timescales of 12 to 13 years and 16 to 17 years with higher energy, which are nonsignificant at the 95% confidence level (Fig. 5a). The water discharge at BBHS has periodic variations at timescales of 2 to 4 years from 1959 to 1962, from 1963 to 1967 and from 2002 to 2007 and 6 to 8 years from 1973 to 1988, which are significant at the 95% confidence level, and has periodic variations at timescales of 4 to 6 years and 16 to 17 years with higher energy, which are nonsignificant at the 95% confidence level (Fig. 5b). The water discharge at WLHS has periodic variations at timescales of 2 to 4 years from 1965 to 1967 and from 1976 to 1982 and 16 to 17 years from 1984 to 1997, both of which are significant at the 95% confidence level (Fig. 5c).
Fig. 6.
The XWT of water discharge and SST index at each hydrological station. (Rightward arrows indicate positive-phase resonance variations, and leftward arrows indicate antiphase resonance variations in the Figure. Downward arrows indicate changes of the water discharge exceed the ENSO cycle, and upward arrows indicate changes of the water discharge lag the ENSO cycle in the Figure.)
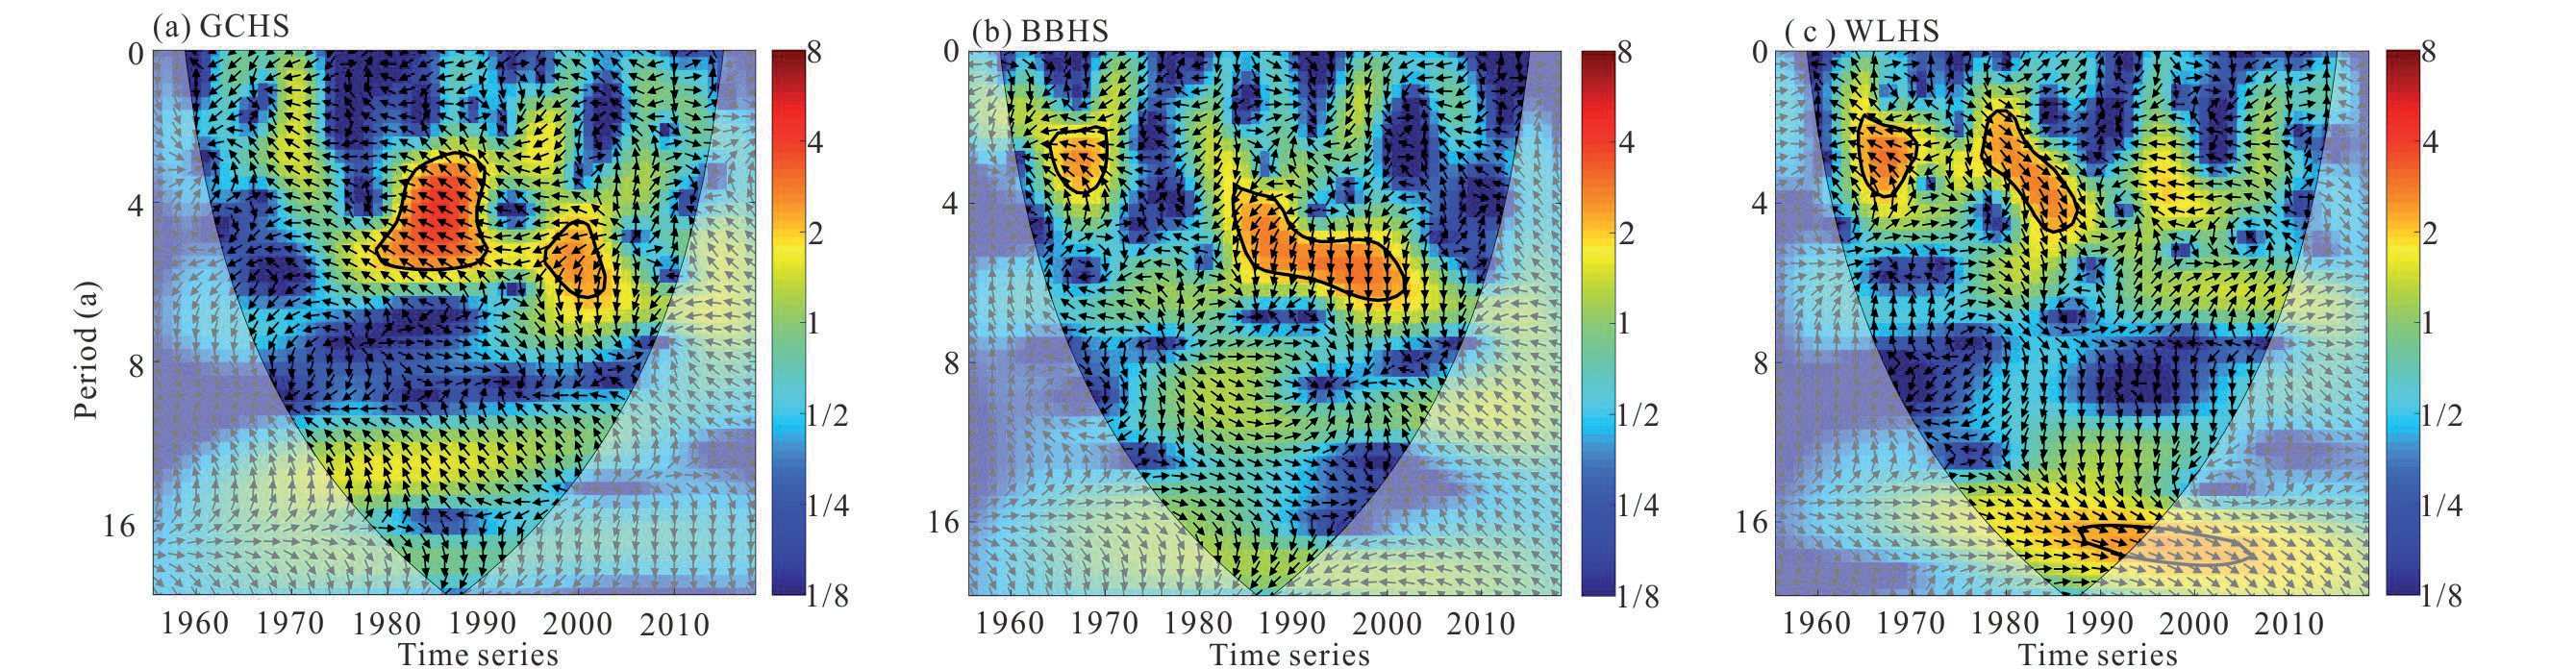
Fig. 7.
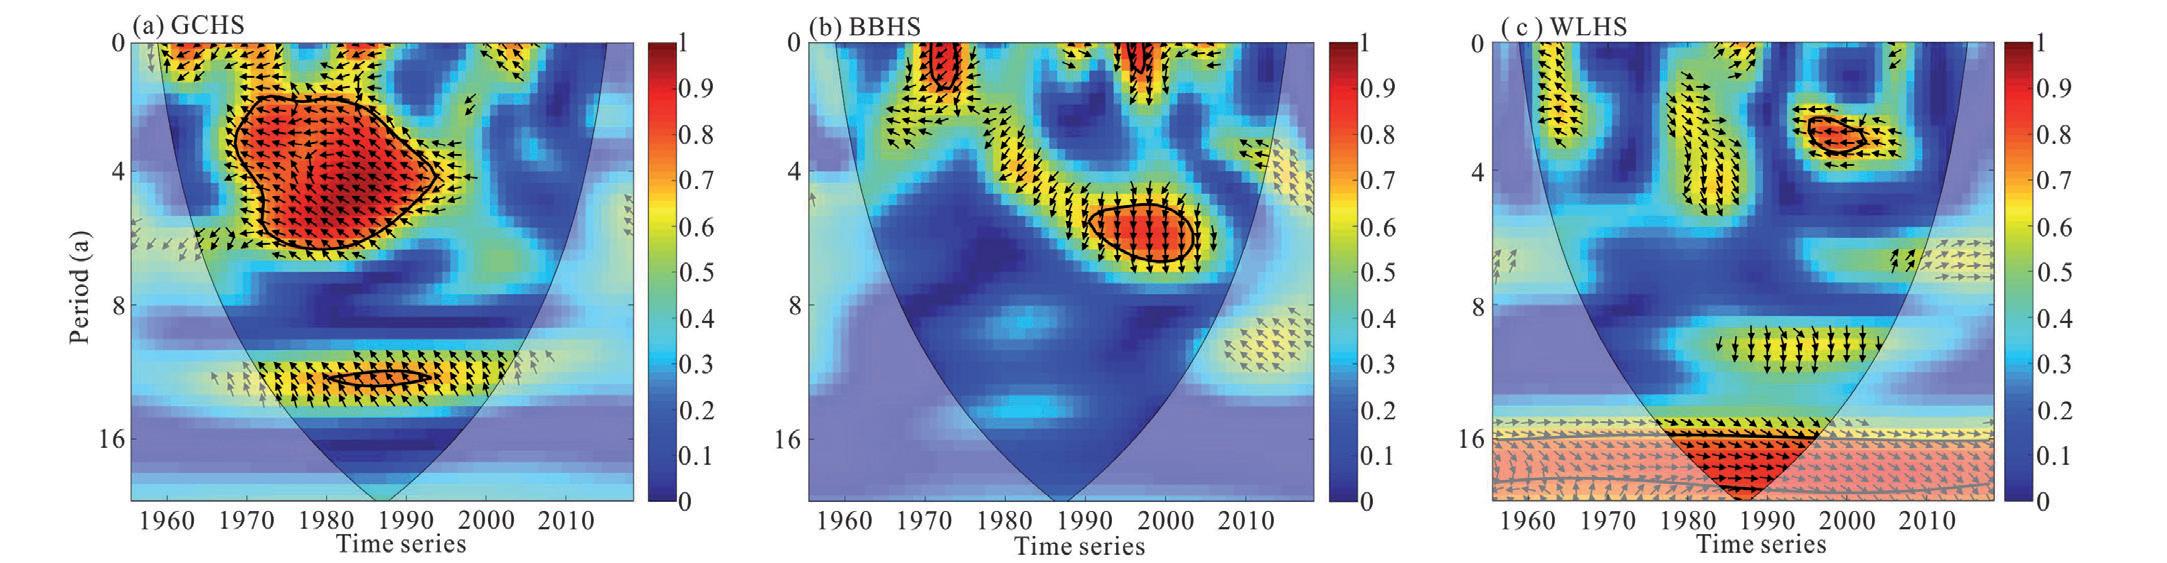
The WTC of water discharge and SST index at each hydrological station. (Rightward arrows indicate positive-phase resonance variations, and leftward arrows indicate antiphase resonance variations in the Figure.)
In summary, the annual water discharge from the main tributaries in the upper Yangtze River has an interannual periodic variation of 2 to 8 years and an interdecadal periodic variation of 16 to 17 years. The former may be related to ENSO and EASM [47, 48], and the latter may be related to the Pacific Decadal Oscillation [49].
Response of Water Discharge to ENSO
The XWT of water discharge and SST index at each hydrological station are shown in Fig. 6. There is a significant resonance period at timescales of 4 to 6 years from 1979 to 1991 and from 1996 to 2003 at GCHS, with stable antiphase resonance variations (Fig. 6a). Significant resonance periods at timescales of 2 to 4 years from 1964 to 1970 and 4 to 6 years from 1984 to 2002 with stable antiphase resonance variations are present at BBHS (Fig. 6b). There is not only a significant resonance period at interannual timescales of 2 to 4 years from 1964 to 1971 and from 1977 to 1988 at WLHS, with stable antiphase resonance variations in the former and stable positive-phase resonance variations in the latter, but also a resonance period at interdecadal timescales of 16 to 17 years from 1988 to 1996, with stable positive-phase resonance variations (Fig. 6c).
Time-frequency characteristics of the XWT are shown in Fig. 6. Changes of the water discharge at GCHS lagged the ENSO cycle before 1994 and exceeded the ENSO cycle after 1994 at timescales of 2 to 6 years. Changes of the water discharge at BBHS and WLHS lagged the ENSO cycle before 1976 and exceeded the ENSO cycle after 1994 at the timescales of 2 to 6 years. The reason for this phenomenon may be related to the difference in the intensity of the ENSO cycle in different regions of China [49]. Normally, the ENSO cycle affects surface hydrological processes some time after they occur, i.e., changes of water discharge lag the ENSO cycle, and the closer the water discharge is to the source area of the Yangtze River basin, the more lag the response to the ENSO cycle. Furthermore, this phenomenon may also be related to the soil-water conservation measures in the tributary basins of the upper Yangtze River, where changes in the subsurface conditions of the basins can lead to changes in water discharge before ENSO events occur [44, 45].
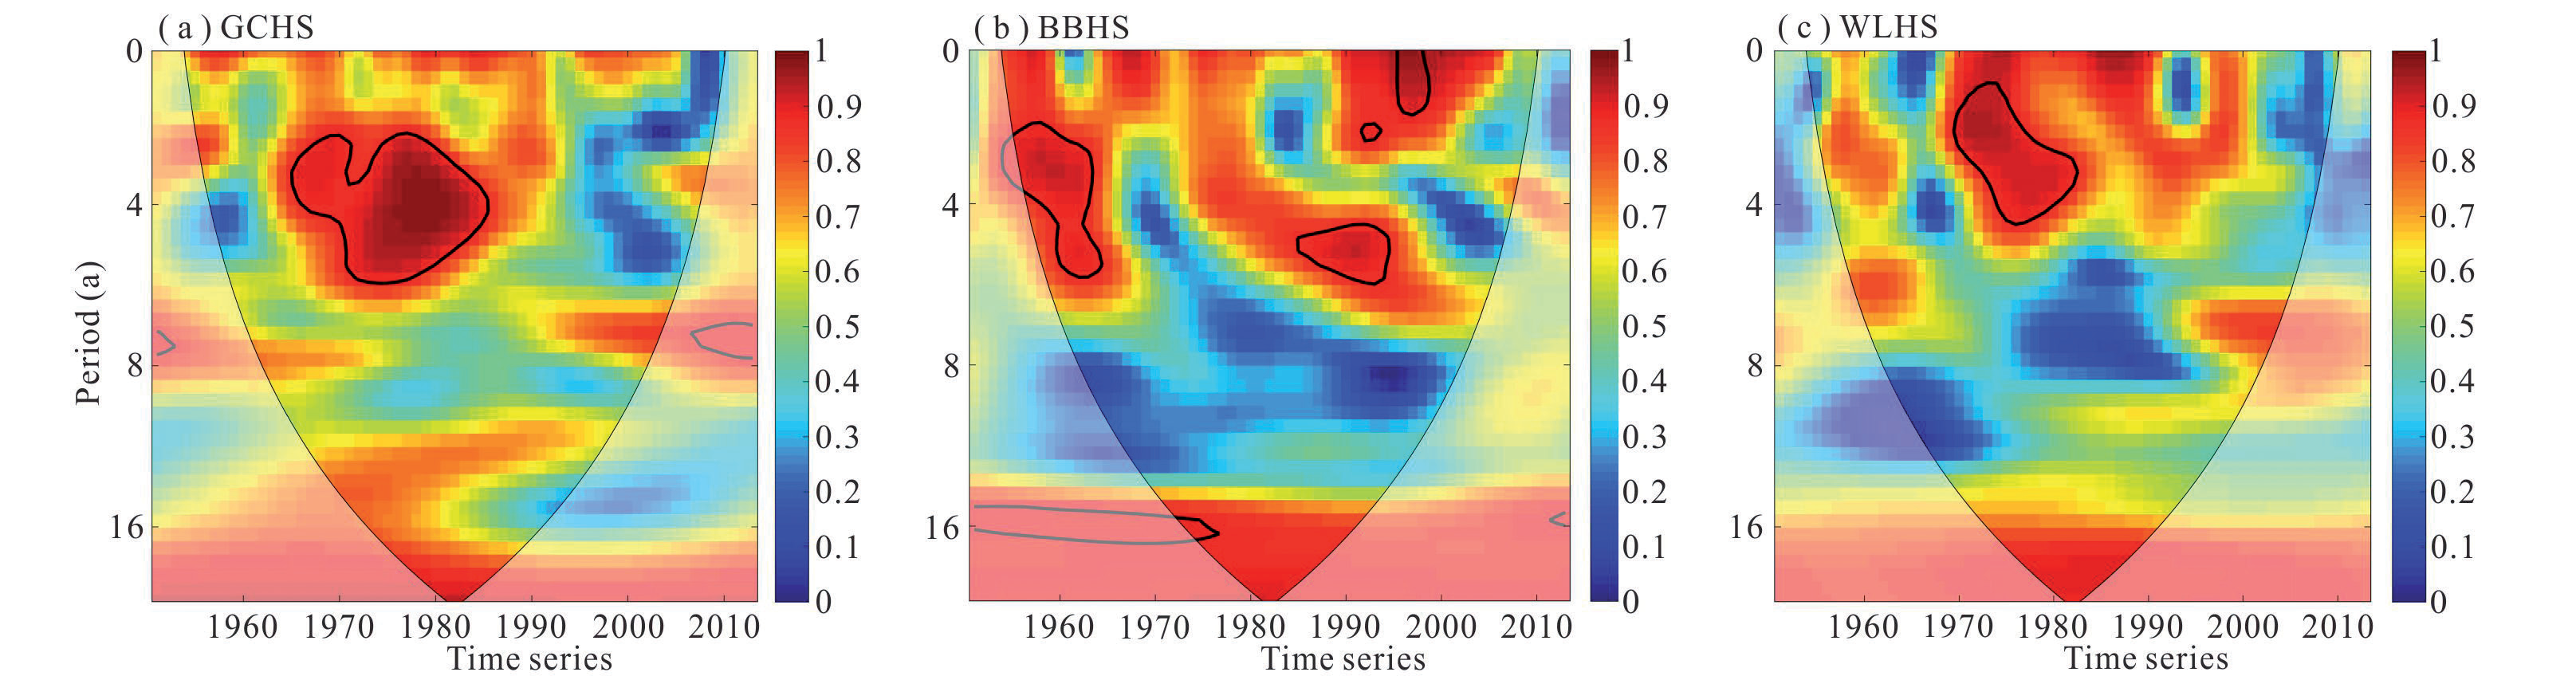
The WTC of water discharge and SST index at each hydrological station are not consistent, but the energies within the significant resonance periods all reach above 0.8 (Fig. 7), i.e., the water discharges are well correlated with the SST index on these periods at timescales. The area of significant resonance periods at timescales of 4 to 6 years from 1968 to 1994 significantly increased at GCHS with stable antiphase resonance variations, and there are also resonance periods at timescales of 12 to 13 years from 1980 to 1993 with stable antiphase resonance variations (Fig. 7a). The area of significant resonance periods at timescales of 2 to 4 years from 1970 to 1974 and from 1995 to 1998 and 4 to 6 years from 1990 to 2004 significantly decreased at BBHS with stable antiphase resonance variations (Fig. 7b). The area of significant resonance periods at timescales of 2 to 4 years from 1995 to 2003 significantly decreased at WLHS with stable antiphase resonance variations, but the area of significant resonance periods at timescales of 16 to 17 years from 1977 to 1996 increased with positive-phase resonance variations (Fig. 7c).
Fig. 8.
The XWT of water discharge and EASW index at each hydrological station. (Rightward arrows indicate positive-phase resonance variations, and leftward arrows indicate antiphase resonance variations in the Figure. Downward arrows indicate changes of the water discharge exceed the EASW, and upward arrows indicate changes of the water discharge lag the EASW in the Figure.)
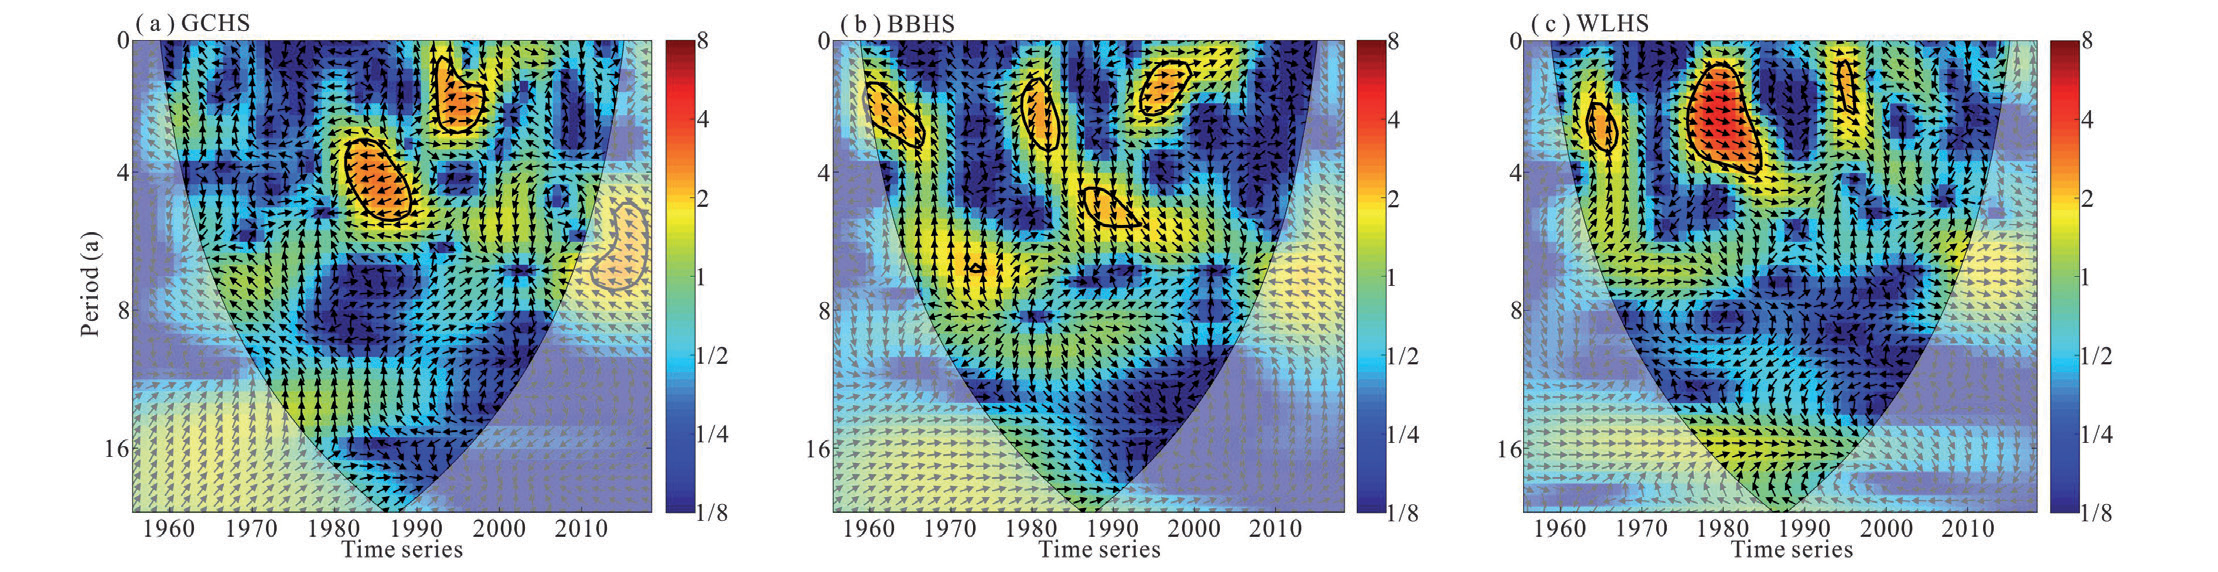
Fig. 9.
The WTC of water discharge and EASW index at each hydrological stationc (Rightward arrows indicate positive-phase resonance variations, and leftward arrows indicate antiphase resonance variations in the Figure.)
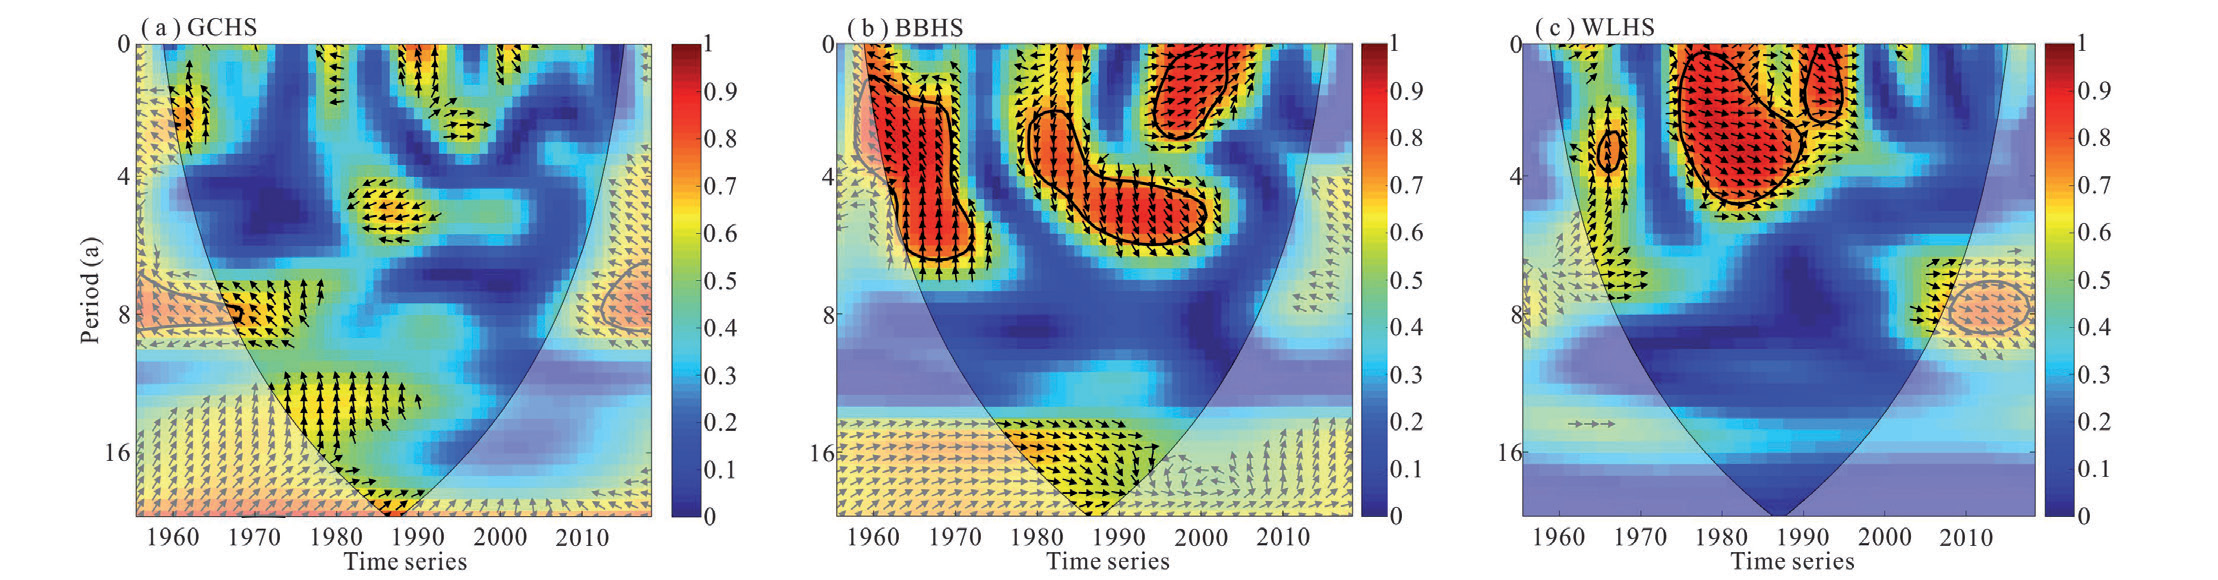
Analyzed from above, there are significant resonance periods at timescales of 2 to 6 years and 16 to 17 years between the water discharge and the ENSO from tributaries in the upper Yangtze River. The bitemporal relationship between the water discharge and the ENSO at GCHS and BBHS showed antiphase resonance variations, and the phase relationship between the water discharge and the ENSO at WLHS shifted from the antiphase to the positive-phase in 1976.
Response of Water Discharge to EASW
The XWT of water discharge and EASW index at each hydrological station are shown in Fig. 8. There is a significant resonance period at timescales of 2 to 6 years, from 1980 to 1990 with stable antiphase variations and from 1992 to 1998 with stable positive-phase resonance variations at GCHS (Fig. 8a). Significant resonance periods at timescales of 2 to 6 years, from 1960 to 1967 and from 1978 to 1984, with stable antiphase resonance variations, and from 1986 to 1992 and from 1992 to 1998 with stable positive-phase resonance variations, are present at BBHS (Fig. 8b). There is a significant resonance period at interannual timescales of 2 to 4 years from 1963 to 1967 with stable antiphase resonance variations, and from 1975 to 1985 and from 1992 to 1998 with stable positive-phase resonance variations at WLHS (Fig. 8c).
Time-frequency characteristics of the XWT are shown in Fig. 8. Changes of the water discharge lagged changes of the EASW before 1976, exceeded changes of the EASW from 1976 to 1992, and lagged changes of the EASW after 1992 at GCHS, BBHS, and WLHS. The reasons for this phenomenon may be related to the intensity change of the EASW and the soil-water conservation measures in the tributary basins of the upper Yangtze River [44, 45, 50].
The WTC of water discharge and EASW index at each hydrological station are shown in Fig. 9. There are no significant resonance periods at GCHS (Fig. 9a). The significant resonance periods at timescales of 2 to 6 years from 1960 to 1972 with stable antiphase resonance variations and from 1978 to 2003 with stable positive-phase resonance variations are present at BBHS (Fig. 9b). There are significant resonance periods at timescales of 2 to 5 years from 1964 to 1968 with stable antiphase resonance variations and from 1975 to 1995 with stable positive-phase resonance variations at WLHS (Fig. 9c).
The above analysis shows that the response of the water discharges from tributaries in the upper Yangtze River to the EASW mainly exists in significant resonance periods at interannual timescales of 2 to 6 years and insignificant resonance periods at interdecadal timeseries. The phase relationship between the water discharge and the EASW index at all hydrological stations shifted from the antiphase to the positive-phase in 1976, indicating that the EASW has a greater influence on the water discharge from tributaries in the upper Yangtze River. The response of water discharge to the EASW lagged before 1976, which may be attributed to the decreasing intensity of the impact of the EASW as it advanced inland from the coast [50]. The response of water discharge to the EASW exceeded that from 1976 to 1992, which may be attributed to the influence of human activities such as the construction of water conservancy projects and soil and water conservation measures [44, 45], etc. Human interference causes changes in the subsurface of the basin, thus producing changes in water discharge prior to the arrival of the EASW.
Response of Water Discharges to the Joint Action of ENSO and EASW
Water discharges due to the joint action of ENSO and EASW at each hydrological station showed high energy at interdecadal timescales, but none of them reached the significance level (Fig. 10). There is a significant resonance period at timescales of 3 to 6 years from 1971 to 1992 in the joint response of water discharge to ENSO and EASW at GCHS (Fig. 10a). The joint response of water discharge to ENSO and EASW at BBHS showed a significant resonant period at interannual timescales of 2 to 6 years from 1962 to 1971 and from 1992 to 2005, and at interdecadal timescales of 16 years from 1978 to 1983 (Fig. 10b). There is a significant resonance period at timescales of 2 to 5 years from 1975 to 1989 in the joint response of water discharge to ENSO and EASW at WLHS (Fig. 10c).
In summary, there are significant resonance periods of 2 to 6 years in response to water discharge from tributaries in the upper Yangtze River, due to the joint action of the ENSO and the EASW. On interannual timescales, the response period of the joint action is more identical to that of the single action, but the energy intensity is stronger and the impact is more stable than that of the single action.
Most of China is located in the monsoon climate zone and is strongly influenced by the monsoon winds. Influenced by the difference in thermal properties between land and sea, the interaction between the Indian low pressure and the Northwest Pacific high pressure creates the EASW, through which water vapor from the Northwest Pacific and other regions is transported to the inland of China [51]. The upper Yangtze River is dominated by a subtropical monsoon climate and is limited by factors such as distance from sea to land and topographical conditions. The activity strength of the EASW is constantly changing, which has a greater impact on precipitation in the upper Yangtze River. In addition, the activity strength of EASW is influenced by ENSO, with weak EASW in El Niño years and strong EASW in La Niña years, and the phenomenon is reversed the following year [52]. ENSO controls regional precipitation by influencing changes in the strength of the EASW in different regions. In the study of the interrelationship between the ENSO and the EASW, the interrelationship is not in a relatively stable state [53]. When the ENSO and the EASW are in the low correlation period, the influence of the ENSO on the EASW is weakened or even disappears; when the ENSO and the EASW enter the high correlation period, the influence of the ENSO on the EASW is strengthened, and the strength of the EASW and the location of rain bands are controlled, which then greatly affects the climate change of the upper Yangtze River and determines the frequency of droughts and floods in the upper Yangtze River [54]. Therefore, the unstable relationship that exists between the ENSO and the EASW leads to differences in precipitation in different years, which to some extent makes the response of joint action of water discharge from tributaries in the upper Yangtze to the ENSO and EASW more significant at interannual timescales.
Conclusions
This paper analyzes the interannual variations, trends, and period changes of water discharges at GCHS in the Mingjiang River, BBHS in the Jialingjiang River, and WLHS in the Wujiang River from the upper Yangtze River and explores the response of water discharge changes to the ENSO and the EASW. Considering the unstable relationship between the ENSO and the EASW, the response of water discharge changes to the joint effect of the ENSO and the EASW is further explored.
There are significant alternating characteristics of wet and dry in the water discharge at each hydrological station from tributaries of the upper Yangtze River from 1956 to 2020. The interannual fluctuation of water discharge is relatively moderate, and the interannual distribution is relatively uniform. The overall trend changes of water discharges at each hydrological station show a decreasing trend, in which change shows a significant decreasing trend at GCHS and an insignificant decreasing trend at BBHS and WLHS. The mutation years of water discharge changes at each hydrological station are 1969 and 1993 at GCHS, 1993 at BBHS, and 1993 and 2004 at WLHS.
The water discharges show significant periodic variations at an interannual timescale of 2 to 8 years and an interdecadal timescale of 16 to 17 years, the former is influenced by ENSO and EASW, and the latter may be related to the influence of PDO. The water discharge changes at GCHS lagged the ENSO cycle before 1994 and exceeded the ENSO cycle after 1994, the water discharge changes at BBHS and WLHS lagged the ENSO cycle before 1976 and exceeded the ENSO cycle after 1976. The water discharge changes at each hydrological station lagged the EASW variations before 1976, exceeded the EASW variations from 1976 to 1992, and lagged the EASW variations after 1992.
There are significant resonance periods at interannual timescales of 2 to 6 years and at interdecadal timescales of 16 to 17 years between the water discharge and the ENSO from tributaries in the upper Yangtze River. The response of the water discharges from tributaries in the upper Yangtze River to the EASW mainly exists in significant resonance periods at interannual timescales of 2 to 6 years and insignificant resonance periods at interdecadal timeseries. There are significant resonance periods at interannual timescales of 2 to 6 years in response to the water discharges from tributaries in the upper Yangtze River to the joint action of the ENSO and the EASW, and the energy intensity of joint action is stronger and the impact more stable than that of the single action.

