

Introduction
Since the reform and opening up, China’s economic construction has made great progress [1]. In the face of climate change, China strives to peak carbon dioxide emissions by 2030 at the 75th United Nations General Assembly, as President Xi Jinping announced, and endeavors to achieve the goal of carbon neutrality by 2060. The proposal of the “dual-carbon” goal indicates that the construction of China’s ecological civilization has entered a critical period of promoting a comprehensive green transformation of economic and social development [2, 3], and that it has become a consensus to change the development model and protect the ecological environment [4]. Eco-efficiency is a core indicator for measuring sustainable economic development [5, 6]. We can maximize benefits and minimize environmental pollution by improving the environmental performance of enterprises [7], thus improving their core competitiveness and innovation level [8, 9]. It is necessary to improve the level of eco-efficiency in order to achieve the goal of “double carbon” and sustainable development in the face of new development challenges.
The Yangtze River Economic Belt (YREB), formed by the Yangtze River system, spans across the east, west, and central regions of China, including eleven provinces and municipalities in Shanghai, Jiangsu, Zhejiang, Anhui, Jiangxi, Hunan, Hubei, Chongqing, Sichuan, Yunnan, and Guizhou, covering an area of about 2,052,300 square kilometers, or about 21.4% of the country’s total area, with a population of about 600 million people, or 43% of the country’s total population, and with a total economic volume of more than 45% of the country’s GDP. The total economy accounts for 45 percent of the country’s GDP. Since 2005, the freight volume of the mainline of the Yangtze River has steadily ranked first in the world and will hit a record high in 2020, exceeding 3 billion tons, with its social freight turnover accounting for 43.17% of the country’s total and its export value close to 70%. The annual contribution of the Yangtze River shipping to the economic development along the river reaches RMB 200 billion yuan, both directly and indirectly. The direct contribution reaches 200 billion yuan, and the indirect contribution reaches more than 4.3 trillion yuan. The YREB is connected to the Silk Road Economic Belt in the west and the 21st Century Maritime Silk Road in the east, which is an important support and booster of the “One Belt, One Road” strategy, as well as a pioneer demonstration belt for the construction of ecological civilization, and has a very important position in all aspects of the economy, culture, population, and ecological environment.
Literature Review
In 1989, Fare et al. introduced the concept of eco-efficiency to measure and assess the environmental efficiency of environmental production technologies [10], and Schaltegger et al. first introduced the concept of “eco-efficiency” to the academic community in 1990, based on the economic value of economic activities and environmental pollution [11]. In 1992, the World Business Council for Sustainable Development (WBCSD) first articulated eco-efficiency as “eco-efficiency is achieved through the provision of competitively priced goods and services that satisfy human needs and improve the quality of life, while progressively reducing ecological impacts and resource intensities over the entire life-cycle to a level that is at least in line with the Earth’s estimated carrying capacity” [12]. In addition, some major international organizations, such as the OECD, the European Environment Agency, and the United Nations Economic and Social Commission for Asia and the Pacific, have elaborated on the concept of eco-efficiency from different perspectives of meeting the needs of human beings for their own development, lowering energy consumption, and reducing environmental damage, respectively [13, 14]. The concept of eco-efficiency has gradually penetrated various fields, and at the research level, it has been studied from enterprises [15] to regional provinces and cities [16] to the national level [17]. Essentially, eco-efficiency is defined as achieving economic development while consuming fewer resources and emitting fewer pollutants [18]. It is not difficult to see that eco-efficiency is an intrinsic requirement for the coordinated and sustainable development of the complex system of economy-resources-environment [19]. At present, the academic concept of eco-efficiency is generally considered to be the output of more economic value and service value on the basis of considering the environment and resources [20].
Model Method and Index System
Introduction to the Model Method
Ultra-Efficient SBM Model of Unwanted Output
Initially, the measure of ecological efficiency was determined by input-to-output ratio, and the limitation of this method was that it could not solve the situation of more input or output [21]. In order to make up for this shortcoming, Charness, Cooper, and Rhodes proposed a non-parametric statistical method CCR model for assessing the relative validity of decision units with multiple inputs and outputs of the same type in 1978. The assumption of constant returns to scale in the CCR model was later removed, resulting in the BCC model with variable returns to scale, also known as the VRS model [22]. The DEA method has gradually become a classical method for measuring efficiency due to its relatively simple principle and wide application range [23]. The conventional DEA model defaults to the output as “positive output”, that is, the expected output we hopeto obtain. However, in the process of regional development, there will inevitably be “negative output”, that is, non-expected output that is not beneficial or even harmful to urban development [24]. Many scholars have engaged in active exploration and proposed a series of methods to solve this problem, including positive attribute conversion methods [25] and the directional distance function approach, but these methods have not taken into account the relaxation of variables [26]. Based on this, Tone proposed a non-radial and non-directional SBM model in 2001. After that, plenty of scholars have started to use this model to measure regional eco-efficiency, but undesired output has not received enough attention. Furthermore, emissions from major industrial wastes (solid waste, exhaust, and wastewater) in the input-output system have not been taken into account [27]. The following is an ultra-efficient SBM model that includes undesired outputs: First, it is assumed that the evaluation system has a total of n decision-making units (DUM), containing inputs and outputs. The outcomes include both expected and undesired outputs. Which are represented by the symbols I, Od and Oud, among them, I = (ip,q)∈R(K×n), Od = (op,q)∈R(P×n), Oud = (op,q)∈R(Q×n), which I∈RK, Od = RP, Oud = RQ; I, Od, Oud>0, The resulting combination is represented by the set P:
The super-efficient SBM model incorporating undesirable outputs will be presented below, as follows:
In the formula, ρ denotes the objective function of the formula, which is also the efficiency value, n indicates the amount of DUM, the number of entries was m; Īp said first p input surplus variable; Ipk (p = 1, ..., m) indicates p-th input of the k-th DUM, Od indicates the desired output, Oud represents the non-desired output; u1 means the amount of expected output, u2 means the amount of undesired; Oqkd(q = 1, 2, 3, ..., u1) say p-th input of k-th DUM, Ovkud(v = 1, 2, 3, ..., u2) say v-th non-desired yield, Ōqd show the slack variable of q-th desired yield, which indicates the shortfall of the desired output; Ōqud is the slack variable for the v-th non-desired output. βr(≥0) is the weight; for the effective DMU of ρ = 1, the ultra-efficient SBM model is recalculated, while for the ineffective DMU of ρ<1, no change is made.
The Model of the Malmquist Index
In 1953, the Swedish economist and statistician Malmquist S., first proposed the Malmquist index model. Later, DEA Malmquist was used to describe relative efficiency dynamics, which was widely used. The model principle is as follows:
In the above formula, I represents the input quantity and O represents the output quantity; It, It+1 represent the input of time t and t+1 separately, Ot and Ot+1 represent the yield of time t and t+1 separately; D0t(It, Ot) is the degree of technical efficiency of the t-cycle as ststed by the t-cycle technology, D0t+1(It+1, Ot+1) ditto D0t(It+1, Ot+1) is the technical efficiency level of the t-cycle, indicated by the technology of the t+1 cycle, D0t+1(It+1, Ot+1) similarly.
The specific models are listed below:
In the above model, when the Malmquist index MI<1, it represents that the eco-efficiency decreases in the period from t to t+1, and when MI<1, it denotes that the eco-efficiency increases in the period from t to t = 1. If TEC<1, it means that the technical efficiency of the t to t+1 cycle decreases. If TEC<1, it means that the ecological efficiency increases.
Stochastic Tobit Model
Tobin established the Tobit model, an econometric model in 1958, also referred to as restricted dependent variable models. Since the traditional linear analysis method is simple regression of the model, it may lead to negative fitting values, and the ecological efficiency is generally non-negative, so the random Tobit model is used for analysis. Its principle is as follows: when Op>0,
When Op = 0,
The log-likelihood function of the above probability density function is as follows:
In the former formula, I0 is the index function with Op = 0, I+ is the index function of Op>0, Φ(*) is a function of the standard normal distribution, θ(*) is the density function of Φ(*), α, β Take the maximum value by taking InL. Among them, p = 1, 2, ..., n.
Collecting Data and Constructing an Indicator System
Screening of Evaluation Indicators
Traditionally, urban ecological efficiency reflects resource conservation, environmental protection, and economic growth building, through the ratio of economic yield to resource investment [28]. In selecting evaluation indicators, the equilibrium between eco-efficiency and capital, resources, energy, and the environment is analyzed comprehensively [29], and an eco-efficiency evaluation system by combining the current production reality and data acquisition in China is built. Among them, the input indicators include capital, resources, labor, and energy investment, which are expressed quantitatively in the article by fixed asset investment, regional water consumption and urban building area, urban employment, and energy consumption, respectively, and these indicators contain the essential elements of production and are set up by integrating the finiteness of overall resources; the establishment of output indicators is based on a quality development perspective, and comprehensive consideration of economic output and high-quality development of human society [30], output indicators are made up of a combination of desired and undesired outputs, among which, desired output includes gross regional product, urban population density and urban green area, and desired output value has positive influence on existence of eco-efficiency, meanwhile, non-desired output is mainly industrial triple waste like waste solids, waste gas, and wastewater, and it is generally believed that the higher the non-desired output, the lower the eco-efficiency value [31]. Details are included in Table 1.
Descriptive statistics table for the corresponding indices (Table 2).
Table 1.
Indicators of eco-efficiency.
Table 2.
Indicator descriptive statistics.
Table 3.
Overall efficiency comparison and ranking.
Data Collection
The data in this article are mainly from the statistical yearbooks of the provinces and municipalities (2012- 2020), the China Urban Statistics Yearbook (2012-2020), the National Bureau of Statistics (2012-2020), and the China Carbon Accounting Database. The panel data for 11 provincial cities in the YREB was finally obtained through collation and aggregation.
Results
Based on data from 11 provinces and municipalities for the last nine years (2012-2020), by organizing and analyzing the panel data, the eco-efficiency of cities in the Yangtze River Economic Belt region is obtained, and the specific results are as follows (Table 3).
The mean value for the three downstream regions is 0.562; for the four midstream provinces it is 0.302, and for the upstream regions it is 0.229.
Result Analysis
Time Evolution Analysis of Urban Eco-Efficiency
Based on data from 11 provinces and municipalities for the last nine years (2012-2020), in order to explore the relationship between resource allocation capacity, management capacity, and enterprise size in cities in the Yangtze River Economic Belt, the article further analyzes comprehensive technical efficiency, pure technical efficiency, and scale efficiency. Among them, comprehensive technical efficiency is the comprehensive measurement and evaluation of resource allocation capacity, resource utilization efficiency, and other aspects of the decision-making unit; the pure technical efficiency is the production efficiency of the enterprise due to the influence of management and technical factors, and the scale efficiency is the production efficiency of the enterprise due to the influence of scale factors. Comprehensive technical efficiency is 1, that is, the input and output of the decision-making unit are comprehensively effective, that is, simultaneously technically effective and scale-effective.
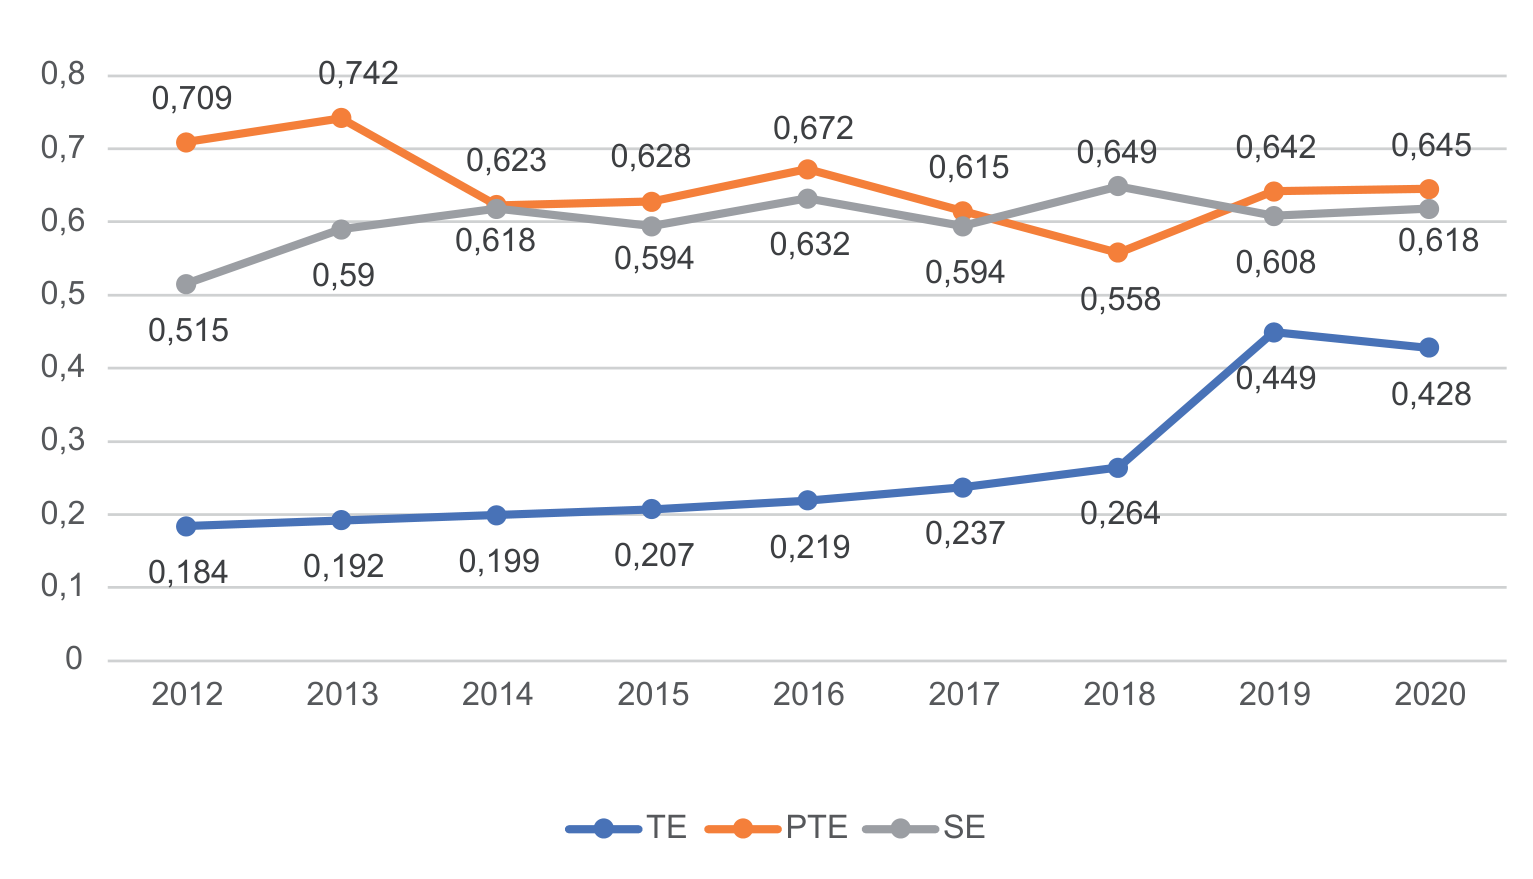
Firstly, the overall technical efficiency of the YREB is on the low side, but in a trend of steady increase with the years. According to the graph above Fig. 1, the overall average value of eco-efficiency for cities in the YREB between 2012 and 2020 is 0.264, which is at a low level, but overall it is on a steady upward trend. From the chart, we can see a slight decline during 2019, which is due to the rapid economic growth that has put more tremendous ecological pressure on the city, as evidenced by the rapid increase in the city’sies’ eco-efficiency from 0.264 in 2018 to 0.449 in 2019, followed by a slow decline to 0.428 in 2020. The eco-efficiency of YREB from 2012 to 2020, increased steadily over the nine years, from 0.184 in 2012 to 0.449 in 2019, with a very significant overall increase, despite a slight decline in 2020. This shows that science and technology have improved the ability of environmental management, as shown by the important role played by various types of pollution treatment equipment in pollution management.; Also, the country’s focus on ecological civilizsation continues to grow, and there has been a positive response from local governments to the central government’s call to introduce corresponding regulations and policies on pollution prevention and control, the results of which are very significant.
Secondly, as can be seen from the above graph, the changes in the scale efficiency curve and the integrated technical efficiency curve of the YREB remain basically the same. However, scale efficiency is higher than combined technical efficiency in general. From 2012 to 2020, the average scale efficiency of urban eco-efficiency in the YREB wasis 0.602, and the average value of pure technical efficiency wasis 0.648, The two started to gradually approach each other in 2012, and from 2014 on, the gap stayeds atin a smaller interval. In 2018, scale efficiency even surpassed pure technical efficiency, reaching 0.649. Inefficient scale is the main reason for low overall technical efficiency, so improving scale efficiency is the focus of improving the ecological level of cities in the YREB. Considering the above issue, it can be concluded that the eco-efficiency of YREB has high potential in terms of scale efficiency, but needs to focus on improving technical efficiency in other aspects to achieve sustainable ecological development.
Spatial Pattern Distribution of Urban Eco-Efficiency in the YREB Region
According to the flow direction of the Yangtze River and geographical factors, the 11 provincial areas in the YREB region are divided from west to east into the upper, midstream, and lower reaches, upstream including Chongqing City, Guizhou Province, Yunnan Province, and Sichuan Province. Downstream includes Jiangsu, Zhejiang, and Shanghai Municipality;, the midstream includesing Jiangxi, Hubei, Hunan, and Anhui Province. The iIntegrated technical efficiency distribution of urban eco-efficiency is characterized by the following diagram.
Remarkable discrepancies exist in the level of eco-efficiency inof the three regions. The urban eco-efficiency values of three areas in the YREB region are 0.562 downstream, 0.302 in midstream, and 0.229 upstream from 2012 to 2020. Among them, the diversity between the highest eco-efficiency value in downstream of the Yangtze and the lowest urban eco-efficiency value in upstream is 0.333, which shows that levels of eco-efficiency vary considerably from region to region. Directly related to the distance from the cities in the YREB to the coast, with the eco-efficiency value decreasing as the distance from the coast increases. Meanwhile, urban areasin downstream of the Yangtze River are more economically developed and have a stronger sense of sustainable development. That means the eco-efficiency value of 0.302 for midstream urban areas is not too different from that of 0.229 for the upstream cities, but both are smaller than 0.562 for the downstream cities.
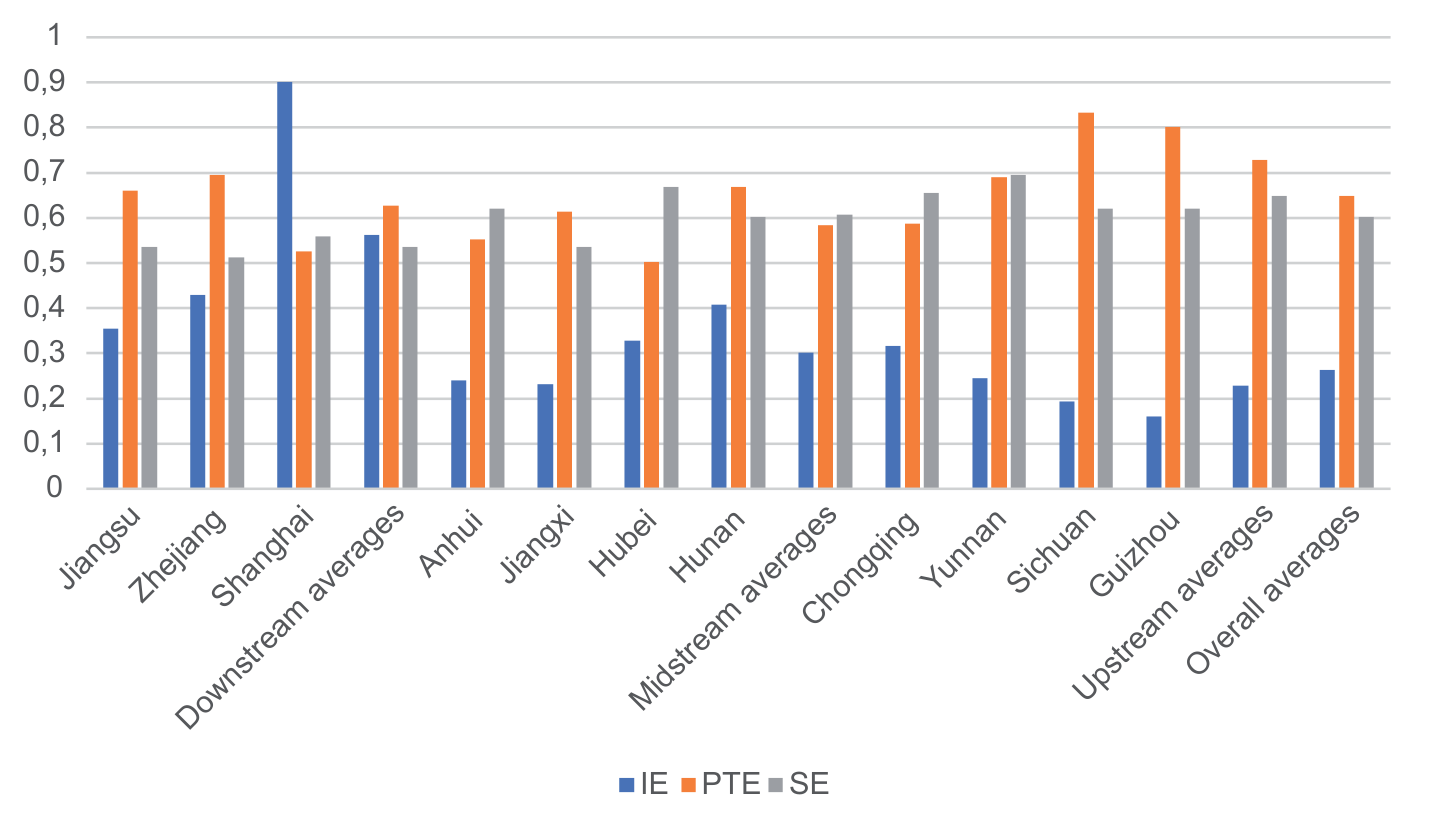
Secondly, the eco-efficiency in the YREB varies significantly, with uneven resource allocation capacity and environmental control water, among which Shanghai’s eco-efficiency is as high as 0.9, ranked first among 11 cities, while Guizhou’s eco-efficiency is only 0.16, with a difference of 0.74. The cities in the midstream region of the Yangtze River are all around the average value of 0.264, while the towns in the downstream area are all above the overall average value, while the cities in the upstream area are all below the overall average.
Basedes on an eco-efficiency decomposition perspective, the YREB exhibits the following characteristics:
Firstly, as shown in Fig. 2, the PTE and SE of upstream cities are more balanced, both at a high level, and thus have higher overall efficiency upstream; at the same time, deficiencies in both PTE and TE are at scale in upper-middle cities, and these deficiencies directly contribute to the low eco-efficiency.
Second, the drivers of eco-efficiency are not consistent across provinces and cities. By comparing the magnitude of PTE as well as SE, we will classify these cities into three types. The first group is a balanced developmental type that is closer to both, including Shanghai, Hunan, and Yunnan provinces; the second type is technology-oriented provinces and cities, where the value of PTE is higher than the value of SE and includes mainly Zhejiang, Jiangsu, Jiangxi, Guizhou, and Sichuan provinces; the third category is the scale-oriented with PTE lower than SE, represented by Hubei Province, Anhui Province, and Chongqing Municipality.
Malmquist Index Analysis of Urban Eco-Efficiency
The Malmquist indicators of urban eco-efficiency in the YREB for 2012-2020 are captured using the Global Malmquist Index model. If the index is greater than 1, it shows progress or growth; if it is less than 1, it offers a decline or regression.
Temporal Evolution of the Malmquist Index
Annual average of the Malmquist Index indicator, as shown below.
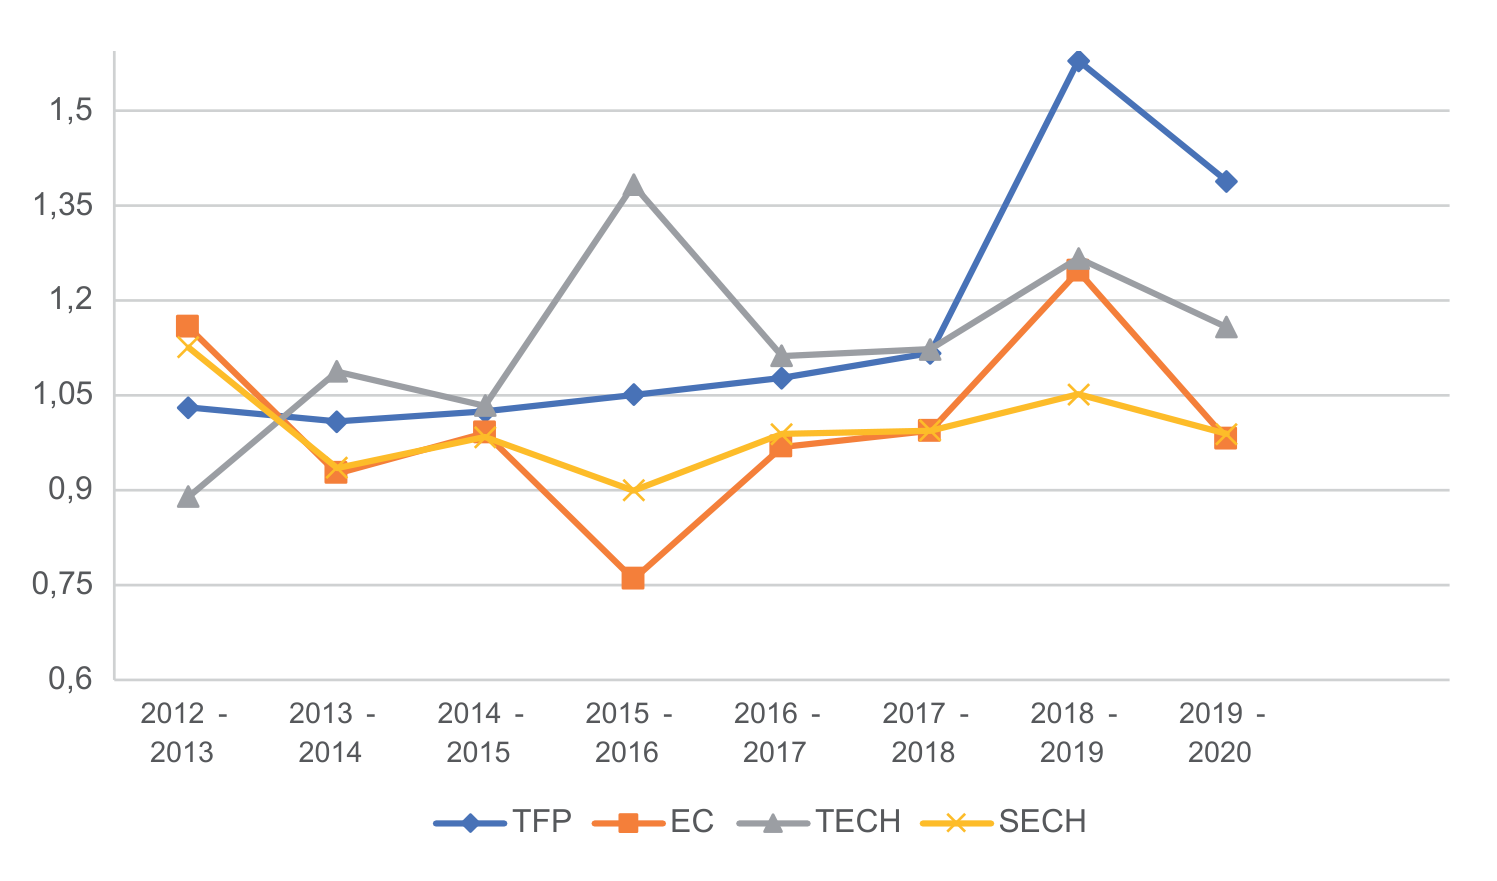
Firstly, the Malmquist index of ecological efficiency shows a comprehensive fluctuating increase trend, which tells us that the resource use efficiency of cities in the YREB is constantly ameliorating. In the above graph, the curve of significant increase in TECH indicates that the progress of science and technology has an active role in the improvement of eco-efficiency. The high technical efficiency fluctuation index almost stays above 1, indicating that technical efficiency always keeps growing upwards and is the primary growth point of the broadening of an index. City eco-efficiency in the YREB region has maintained a steady growth trend since 2014. 2016 saw China put forward the “Three Poles (Chengdu and Chongqing urban agglomeration, Midstream City Cluster, and Yangtze River Delta City Group)” policy in the Yangtze River Economic Belt Development Planning Outline, which anchors sustainable economic development, followed by a significant increase from 2018 to 2019.
Secondly, the TECH growth is significantly ahead of the EC growth, but TECH is volatile. The graph shows that the TECH average annual growth rate over a ten-year period from 2012 to 2022 is 2.68%, which indicates that as society progresses, there is a growing concern for urban eco-efficiency. The development of science and technology becomes vital drivers of city eco-efficiency levels, but the fluctuation of TPI is huge, reaching 49.3%. It indicates, to some extent, that the current grade of technology in urban areas seriously lacks stability and fluctuates wildly. In the process, EC and SECH rose at a low rate and even showed a certain amount of negative growth in Chengdu, so we have to keep strengthening our learning to master the methods to deal with specific work scenarios and problems. Low-scale efficiency indicates that the scale of the city needs to be strengthened.
Regional Distribution of the Malmquist Urban Eco-Efficiency Index
The average values of each region, including upstream, midstream, and downstream, are shown in Fig. 4.
When analyzing the Malmquist index and decomposition of eco-efficiency by dividing YREB into three regions: upstream, midstream, and downstream, we can obtain the following main features:
First, both the regional total factor production indices of the three regions and the overall complete factor production index are greater than one, indicating that the index has maintained a stable growth trend. Among the downstream cities, Shanghai’s urban eco-efficiency is very durable, with TECH, EC, and SECH all remaining basically at 1. Indicates Shanghai’s eco-efficiency level has achieved a high level and has mainly been in a state of steady or diminishing returns to scale in recent years. The TECH of Jiangsu and Zhejiang provinces are 1.179 and 1.174, respectively, indicating that the technological level of Jiangsu and Zhejiang provinces is still improving rapidly. Overall, eco-efficiency in the downstream region has reached a high level in general.
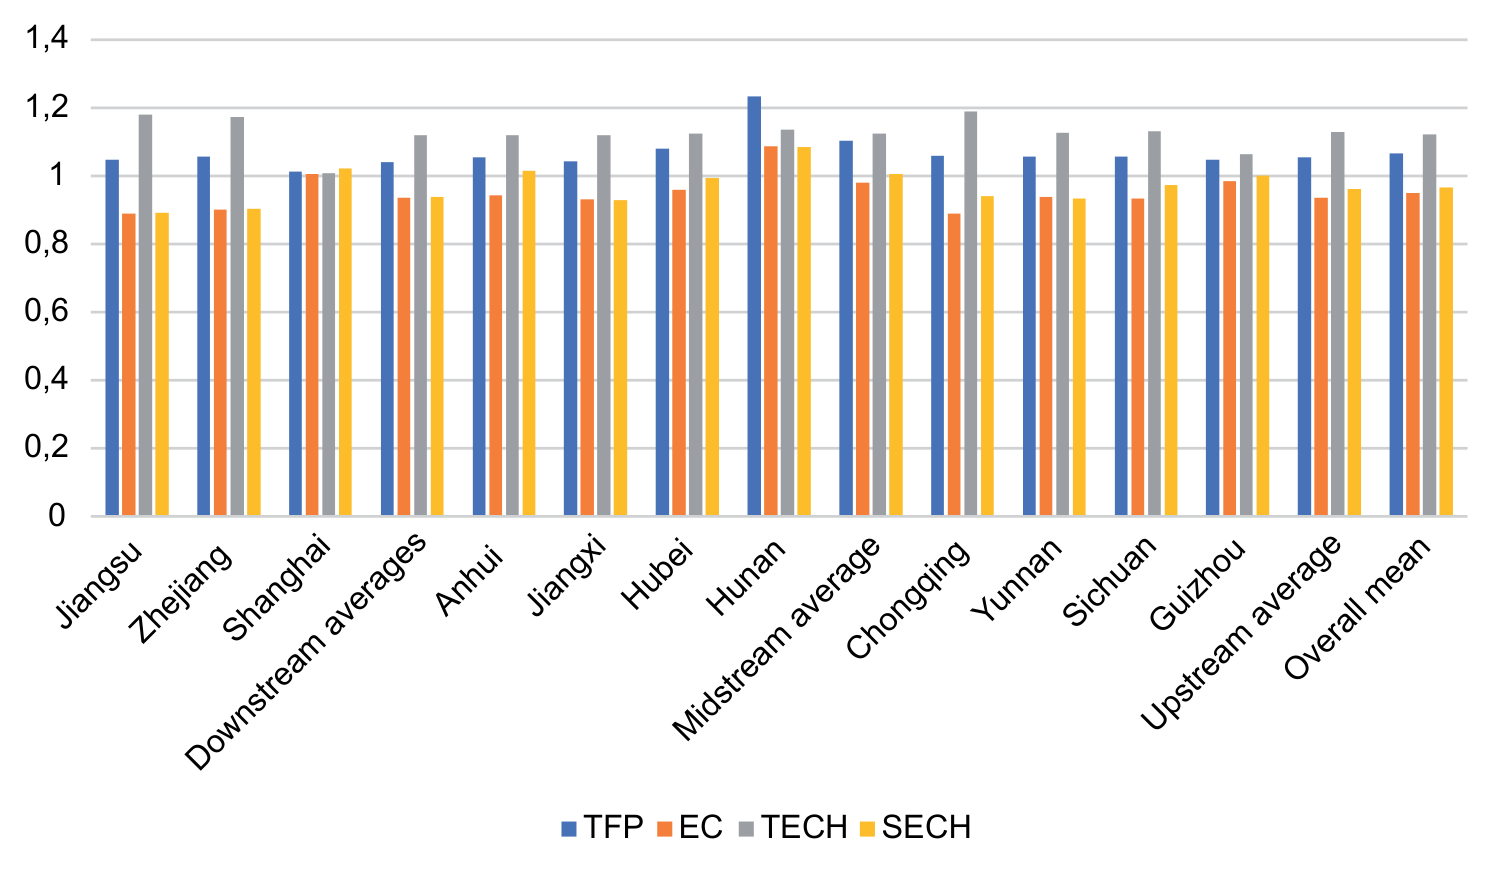
Table 4.
Impact Factor Evaluation Indicator System.
Table 5.
Description of statistical results.
Secondly, growth in midstream cities was strong. The TFP in the four midstream provinces of Anhui, Jiangxi, Hubei, and Hunan were all above 1, with Hunan reaching the highest value of 1.233 among the eleven provinces and cities. The technical progress index also maintained a high growth rate, showing that technological advances played a crucial part in accelerating eco-efficiency in the four provinces and cities, while the shortcomings were also undeniable, with only Hunan’s technical efficiency Only Hunan Province, among the four provinces and municipalities, has maintained growth with its EC and SECH greater than one, while the other three provinces are all in decline.
Thirdly, the four upstream provinces and cities are generally similar to the midstream region, but are weaker than the midstream region; overall, there is a significant gap between them and the downstream region. The technological progress index of Chongqing is outstanding, which is not unrelated to the local emphasis on science and technology development.
Tobit Regression Analysis
Evaluation Index System of Influencing Factors
Calculations of the ultra-efficient SBM model with undesired outputs show that some areas of 11 cities in YREB are less eco-efficient and fail to reach adequate levels. Hence, it is essential to explore its influencing factors. Various factors affecting ecological efficiency include industrial structure, urbanization level, etc. [32]. Based on existing research and in combination with the current situation of YREB, factors affecting the level of eco-efficiency are summarized through the system method, including the following: regional economic level, scientific research level, greenhouse gas emission level, industrial structure, and urbanization level of each region The indicator system as Table 4.
Among them, Expressing the level of the regional economy through GDP per capita can raise the material level of the people of the region; the story of scientific research is expressed by the internal expenditure on scientific research; higher levels of investment in scientific research can improve the scientific and technological strength of a city, improve innovation ability, and promote a high-quality enhanced economy; the level of GHG (greenhouse gas) emissions is expressed by CO2 emissions; GHG emissions can have a side effect. And reducing greenhouse gas emissions will have a positive impact, The ratio of the aggregate value of the output of the primary and tertiary sectors to GDP is used to show the industrial frame, and a reasonable industrial structure can help the growth of the regional economy as well as promote the material culture of the people in the area. The level of urbanization refers to the ratio between the urban population and the total population of a specific region. It reflects the degree of modernization and development level of a region and plays an important role in government decision-making, resource allocation, and social development. Urban population level is used to describe the urbanization degree of a region and the proportion between urban population and rural population, which is an important basis for formulating government policies, resource allocation, and social development planning. The results of conducting descriptive statistics are as follows:
The explanatory variable is comprehensive efficiency (TE), which includes four categories, namely, per capita GDP (X1), internal scientific research funds (X2), carbon dioxide emissions (X3), a ratio of primary and tertiary sector output to GDP (X4), and urban population density (X5). The maximum value, mean value, and standard deviation are shown in the table above.
Correlation Analysis and Commonness Test
To avoid false regression, it is a must to use correlation analysis and the collinearity test to analyze the correlation of urban ecological impact factors before Tobit regression analysis. The relationship coefficients show that the correlations for all indicators are less than 0.8, showing no higher correlation between indicators. The variance expansion factor VIF test showed that the VIF for all the parameters was less than 10, and there was no significant multicollinearity problem, which was suitable for regression analysis.
The above results show that GDP per capita (X1) is significantly correlated at the 0.01 level with internal expenditure on research (X2), CO2 emissions (X3), and the ratio of primary and tertiary sectors to GDP (X4); X2 is significantly correlated at the 0.01 level with X5 and at the 0.05 level with X3; X3 is significantly correlated at 0.05 level with X4, the correlation is significant.
Regression Analysis of the Tobit Model
To eliminate the effect of the gauge, Tobit models were used for regression analysis after standardization of this data. The detailed results are as follows:
The regression coefficients of X1, X2, and X5 passed the significance tests of 1%, 5%, and 10%, respectively, with notable impacts on urban eco-efficiency.
The regression coefficients for X1 and X5 have a significant positive effect, and X2 has a major positive impact. The regression coefficients of X2 and X3 fail the significance test and have a weak impact on general efficiency.
It can be known from the results above that GDP per capita, internal expenditure on research funding, and urban population density pass the significance tests of 1%, 5%, and 10%, respectively, and have significant effects on urban eco-efficiency, with GDP per capita and urban population density having significant positive effects and internal expenditure on research funding having significant negative effects, while CO2 emissions have a negative impact and a positive impact on the ratio of primary and tertiary sector output to GDP, but the impact of both is slight and insignificant.
Table 6.
Regression analysis results.
| X1 | X2 | X3 | X4 | X5 | |
|---|---|---|---|---|---|
| X1 | 1 | .662** | -.283** | .433** | -0.016 |
| X2 | .662** | 1 | -.255* | -0.115 | -.324** |
| X3 | -.283** | -.255* | 1 | .216* | -0.133 |
| X4 | .433** | -0.115 | .216* | 1 | 0.185 |
| X5 | -0.016 | -.324** | -0.133 | 0.185 | 1 |
Table 7.
Regression results of influencing factors.
The regression coefficient of a regional economic level was 0.984, which had a significant effect on urban eco-efficiency. There is a specific U-shaped relationship between the level of economic development and eco-efficiency; as the economy grows, eco-efficiency shows a decline and then an increase [33]. The curve reflects the development of the YREB region very well. In the preliminary stage, the economic progress pattern of YREB was a rough and loose development, focusing on GDP growth without paying attention to eco-efficiency. For the past few years, with the gradual improvement in the quality of production and life, ecological issues have been receiving increasing attention. It is therefore important to ensure that economic growth is accompanied by greater eco-efficiency [34]. On the other side of the coin, a continuously growing economy unavoidably consumes large amounts of energy and produces excessive pollution emissions, resulting in excessive undesirable outputs that negatively impact the eco-efficiency of regional cities [35]. The combined effect of the two makes the size of the regional economy positively influence urban eco-efficiency, but not highly relevant. The coefficient on the level of research, expressed as internal expenditure on research funding, was -0.278, which passed the 5% significance test and had a significant negative impact on the level of eco-efficiency. For the present, scientific research funds are mainly used to reduce costs and increase efficiency to improve the economic efficiency of enterprises, focusing on product development and technological innovation as a way to improve economic efficiency, and the increase in economic efficiency implies an investment in resources and manpower and therefore has an adverse impact on the eco-inefficient [36]. The coefficient of city population density was 0.111, which passed the 10% significance test, showing that higher population density produces higher consumption demand, which in turn contributes to the economic growth of the city and thus to its eco-efficiency.
The impact of industrial structure and CO2 emissions is not prominent on urban eco-efficiency. The factor of CO2 emissions is -0.048, and the burning of fossil fuels is the primary source of CO2. In recent years, awareness of energy saving and emission reduction has gradually increased, and the effective exploitation of clean energy sources has reduced the impact of CO2 on eco-efficiency [37]. The YREB has also introduced a series of policy regulations in recent years to help enterprises upgrade and transform, including some high-energy-consuming along-river. The YREB has also introduced a series of policy regulations in recent years to help enterprises upgrade and change and to shut down some of the high-energy-consuming enterprises along the river as a means to promote emission reduction. The coefficient of 0.084 for industrial structure failed the significance test, demonstrating that an increase in the share of agricultural and industrial output in regional industries would not have a very noticeable impact. Currently, to advance sustainable economic growth and under the premise of paying attention to environmental protection, the mid-stream and upstream areas have vigorously developed industrial industries to enhance regional economic growth. In the meantime, the input of large amounts of resources and energy may have a certain degree of disruption to regional ecology, but with the introduction of relevant environmental protection policies and increased awareness of environmental protection, these negative impacts have been minimized. In addition, the significance of industrial structure on urban eco-efficiency in the YREB is unclear.
Discussion and Policy Recommendation
Discussion
The super-efficient SBM model containing non-desired outputs and the Malmquist index model were used to make a comprehensive evaluation of the eco-efficiency levels of 11 provinces and cities in the YREB, and a detailed analysis was made in this article. The Tobit model was also used to explore the influencing factors of eco-efficiency. Research shows that:
(1) There are notable regional differences in urban eco-efficiency in the YREB: it differs significantly from region to region, including upstream, midstream, and downstream areas region. between 2012 and 2012, the combined technical efficiency values for eco-efficiency in the three regional cities were 0.229 upstream, 0.302 midstream, and 0.562 downstream. The difference between the downstream region with the maximum and the upstream region with the minimum eco-efficiency is 0.333; the city with the maximum comprehensive efficiency, Shanghai, reaches 0.901, while the province with the minimum complete efficiency, Guizhou is only 0.160. The difference between the two reaches 0.741. The Malmquist index of city eco-efficiency in the downstream region remains stable at one or hovers around one. In contrast, the Malmquist index of urban eco-efficiency in the upstream and midstream region grew at a high rate of 10.55% and 11.03%, respectively, with the growth rate of the midstream city of Hunan Province reaching 12.33%. The cities in the YREB can be classified into two main types based on the main drivers of the 11 provinces and cities. That is, a balanced development type in the downstream areas and a technology-oriented type in the middle and upstream cities.
(2) In 2012, the YREB’s PTE averaged 0.709 and SE averaged 0.515, a difference of 0.194. By 2020, the difference between the two is 0.645 and 0.618, respectively, with a difference of only 0.027. The difference was only 0.027 in 2020. The Malmquist index of eco-efficiency for urban areas in the YREB is 1.139, which suggests that utilization of ecological resources in all provinces and cities is constantly improving, with the index of EC remaining above 1 for the other nine years of the decade, except for 2012. The Malmquist index of eco-efficiency increased mainly due to technological progress, with a very steady, progressive trend.
(3) Regression coefficients for GDP per capita that pass the 1% significance test show a significant positive effect. At the same time, urban population density, carbondioxide emissions, and industrial structure all have a more pronounced positive impact on the ecological efficiency of the YREB, with the former having a significant effect and the latter being relatively minor and of weaker significance.
Policy Recommendation
Through the above analysis, we have some suggestions for the current situation and characteristics of development in different regions.
(1) Shanghai, in the downstream area, is in a leading position in terms of eco-efficiency and various sub-indicators. Since 2012, Shanghai has been promoting the transformation and upgrading of its overall industry by building an industrial system with coordinated development of the real economy, science and technology innovation, and human resources, of which the total output value of Shanghai’s new industries accounted for 30.6% of the city’s total output value in 2018, and the total output value of the key developed high-value-added industries reached RMB 2.38 trillion. Shanghai’s development model is a model of high-quality sustainable development. Zhejiang’s eco-efficiency is in second place in 2022, after Shanghai. Starting with its reforms, the Zhejiang government has worked hard to move away from a sloppy development model and proactively serve its people and businesses. The local government has become one of the most approved and best-fit. At the same time, it has focused on building the ecological environment, proposing a “green Zhejiang” development direction, and implementing a series of policies, including the establishment of a sustainable water resource management agency, an ecological pension system, and a financial fee system for significant pollutant emissions [38]. Zhejiang Province has achieved remarkable economic and eco-efficiency results, and its development model is worth learning from. Jiangsu Province has been vigorously developing its innovation economy and striving to form industrial clusters over the past years. Jiangsu’s emerging and high-tech industries reached 75.8% of output value as of 2018, and exported products exceeded RMB 1 trillion. The rapid development of modern service industries has accompanied innovation in the manufacturing sector, with high-tech services such as technology services and production services performing prominently. While building the economy, Jiangsu Province also pays great attention to the maintenance of the ecology. In 2018, Jiangsu Province shut down polluting and energy-intensive enterprises, and more than 1,200 large-scale enterprises were eliminated due to environmental and energy problems. Jiangsu Province is actively improving its eco-efficiency by promoting the green transformation of its industry and the protection and enhancement of nature.
(2) Benefiting from the Central Rising Strategy, the four midstream provinces of the TREB - Hunan, Hubei, Jiangxi, and Anhui - are generally more eco-efficient than most upstream provinces, while at the same time being far less efficient than downstream regions. Its development has accelerated significantly since 2006. Meanwhile, between 2009 and 2013, four of the seven national demonstration zones for industrial transfer established by the Chinese government were located in the midstream region, Directly contributed to the rapid development of the midstream region. This is reflected in the fact that GDP growth rates began to be distinctly higher than the country average, and the economy began to occupy a higher position.
(3) Situated in upstream areas, Chongqing has been maintaining a higher level of eco-efficiency due to its status as a political municipality and the emergence of the digital economy. It has gradually been caught up and surpassed by provinces such as Hunan and Zhejiang over the past few years. As implementation of the “One Belt, One Road” policy and the Yangtze Economic Corridor Strategy continues, the ecological environment and backwardness of the upstream are beginning to surface. To enhance future eco-efficiency, the upstream region should firmly grasp the opportunities for the development of a green, ecological, leisure, and digital economy. In addition, it should make maximum use of “precise poverty alleviation”. Developing a new type of urbanization, reshaping the regional development mechanisms, and optimizing the structure of Chuno are also ways to achieve high-quality development [39].
(4) The ecological efficiency of Anhui Province, which is located in the midstream, has been at or below the lower end of the scale. Anhui province shows an apparent deficit in road transport and industrial accumulation, which leads to lower industrial standards, fundamentally due to insufficient capital, research capacity, energy, and manpower utilization. The outline of the YREB Integrated Development Plan was released and implemented in January 2019, covering an area of 358,000 square kilometers, of which Anhui is the only non-downstream city and is considered the most significant beneficiary. In the general environment of building the Yangtze River Delta innovation community and emerging industrial clusters, Anhui should grasp the integration opportunities, consolidate its industrial foundation, give full play to its ecological resource advantages, strive to participate in crucial resource pooling and high-level industrial division of labor, and promote industrial transformation and upgrading [40].
Conclusion
As a large inland economic belt involving shipping, cities, population, industry, green spaces, and species, the YREB should be planned in an integrated manner to grasp the overall picture of the YREB ecosystem’s integrity and conservation measures. Laws must be enacted and monitored in a way compatible with the ecosystem for systemic improvement, and the social nature of health monitoring should be coordinated with the properties of ecosystems. The Yangtze River Basin Commission should set up environmental supervision and managerial enforcement agencies according to different basins to optimize the distribution of administrative and supervisory powers and responsibilities within the bay and to promote environmental improvement within the basin. Manage the economic belt as a whole and coordinate the relationships and interests between the bays. Coordinate regulation and improve management efficiency by improving assessment mechanisms and introducing measures such as ecological compensation, early warning, and basin ecological emergencies [41].
(1) In terms of policy, the government should formulate differentiated strategies according to the different situations of upstream, midstream, and downstream as well as each region, taking into account the characteristics of local development, and regulate land use by designating “restricted and prohibited development” areas; vigorously encourage and support the development of clean and sustainable industries; and, in response to the differences between regions, the government should reinforce inter-regional collaboration and establish a long-term mechanism for regional synergy of intelligence, breaking through the shackles of “policy silos”, “industry silos”, and “information silos”. (2) Financially, refine the division of financial powers, focus on matching local financial resources and powers to ensure the rationality and effectiveness of environmental regulation tools, improve the performance assessment system, establish a quantitative decomposition mechanism for industrial eco-efficiency regions, accelerate technological innovation and equipment renewal, and promote system-wide and region-wide industrial energy conservation and upgrading. (3) Overall, local protectionism should be broken down and unified management of the economic belt should be implemented. Improvements in industrial eco-efficiency will be achieved by promoting advanced industrial structures, vigorously developing high-tech industries and productive services, for instance, the information technology industry, the financial sector, and the environmental management sector, to drive industries to the top end of the value chain while actively changing traditional resources and environment-intensive production methods, and strengthening ecological restoration and comprehensive environmental management. (4) Regionally, the core region should play a radiation-driven role, strengthen inter-regional cooperation, promote the flow of production factors and technologies, and spread advanced management concepts and production technologies to the relatively backward middle and upper reaches of the region; the upper and middle reaches of the region should form a linked structure with Wuhan-Changsha as the core, standardize production methods, improve resource utilization rates, expand investment in research and development, strive to bring into play regional characteristics, and develop high technology industries and tourism services; the Chengdu-Chongqing urban agglomeration should actively integrate into the major eastern cycle, attract high-tech enterprises through policy and financial concessions and subsidies, introduce high-tech talents and develop innovation-driven industries. Strengthen the control of highly polluting and energy-consuming enterprises, and enhance the protection of the ecosystem.

