

Introduction
In recent decades, with the rapid development of industries in various countries around the world, greenhouse gas emissions such as carbon dioxide have significantly increased, causing global warming, glacier melting, frequent extreme weather, and other phenomena, posing a huge threat to the living environment and happy life of all humanity. Therefore, the question of how to reduce greenhouse gas emissions such as carbon dioxide has received close attention from the world [1]. Since the reform and opening up, China has achieved remarkable results with its extensive growth model of high energy consumption, high pollution, and high emissions. However, environmental pollution issues have also emerged, especially the increasingly prominent carbon emissions problem, which has seriously affected China’s high-quality economic growth [2, 3]. According to the 2020 World Energy Statistical Yearbook, as of the end of 2019, China’s total carbon dioxide emissions reached 10190.1 million tons, ranking first globally. Promoting carbon emissions reduction is an important part of achieving high-quality economic development and coordinated environmental development [4]. In this context, what factors have increased carbon dioxide emissions? How to find emission reduction paths that match China’s economic development model? Answering these questions has an important theoretical and practical significance for effectively addressing global climate change and achieving high-quality development of the Chinese economy.
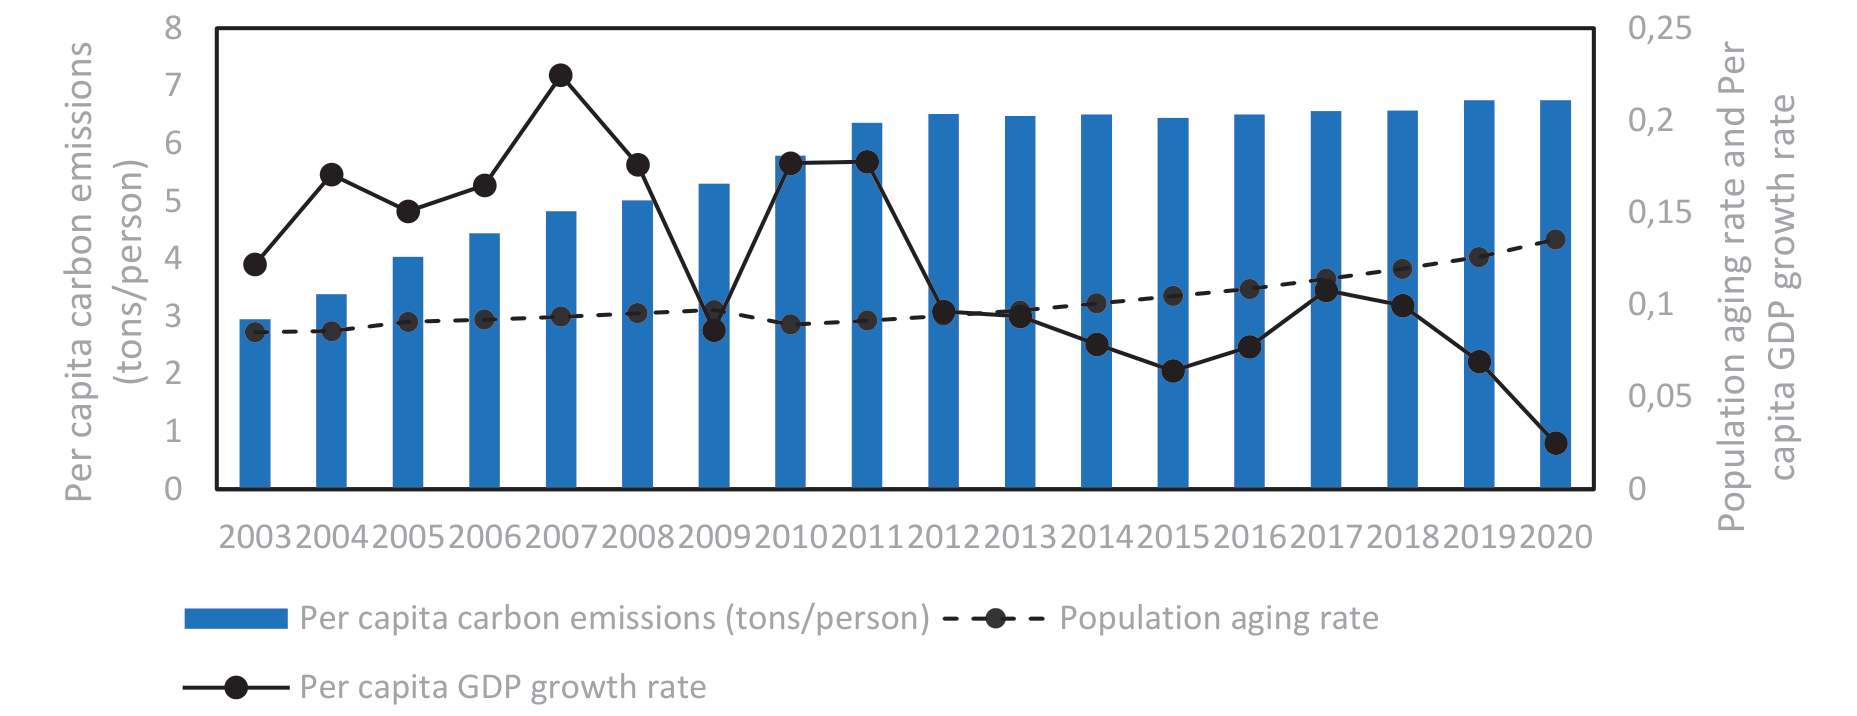
It is undeniable that while China’s economy is growing rapidly, its population structure is also undergoing significant changes, especially manifested in the continuous deepening of aging. The population age pattern of “getting old before getting rich” has seriously hindered the high-quality development of China’s economy (as shown in Fig. 1). From an economic perspective, rapid population aging has brought a series of negative impacts on the economic growth of a country or region [5]. For example, Lee et al. [6] found that population aging has a negative impact on both short-term and long-term economic growth using a sample of 2017 countries from 1960 to 2014. Muhammad Raees Shaik et al. [7] showed that population aging has a significant impact on income distribution, which is a driving factor for income inequality between regions. In addition, scholars have found that population aging has a significant negative impact on urban and rural residents’ consumption [8], labor structure [9], enterprise technology innovation [10], and industrial structure upgrading [11]. Despite extensive research on the economic effects of population aging in the domestic academic community, insufficient attention has been paid to its environmental governance effects, especially the lack of empirical research on the emission reduction effects and mechanisms of population aging under the “dual carbon” goal [12]. In theory, with the deepening of population aging, in order for a country or region to achieve sustained and stable economic growth, the advantage of population dividend needs to shift towards talent dividend, which in turn forces the fundamental transformation of economic development mode from relying on capital and labor factors to improving total factor productivity, ultimately helping to improve regional environmental quality and reduce regional carbon emissions [13]. So, what is the impact of population aging on regional carbon emissions in China? What is its internal mechanism of action? Does it exhibit significant spatial differentiation characteristics? Exploring these issues is of great significance for correctly understanding the structural characteristics of China’s regional population and environmental governance effects, accelerating the achievement of the “carbon peak” and “carbon neutrality” emission reduction goals in the new era, and promoting the sustained and healthy development of China’s economy.
This paper collects the panel data of 30 provinces in the Chinese Mainland from 2003 to 2020, and empirically tests the impact of population aging on regional carbon emissions and spatial heterogeneity using the two-way fixed effect model. Compared with the existing research, the characteristics of this study are: first, based on the provincial panel data in the Chinese Mainland, the panel regression model is used to investigate the impact of population aging on carbon emissions, that is, population aging exacerbates regional carbon emissions, and further confirms that there is significant regional heterogeneity in this impact; the second is to independently measure the emission intensity of carbon dioxide in various regions. Thirdly, two mediating variables, consumption structure and energy structure, were introduced into the model, and the mediating effect model was used to verify that population aging exacerbates regional carbon emissions through two paths: consumption structure distortion and energy structure distortion. In summary, the above conclusions not only enrich existing research, but also provide decision-making references for government departments to seek the optimal carbon reduction path in the context of population aging.
Literature Review
The literature review of this article first sorts out the research on carbon emissions and population aging, and further sorts out the literature based on this. Three research threads related to this article are drawn. Firstly, the influencing factors of carbon emissions are summarized from the aspects of economy, system, and technological innovation; the second is to explore the economic effects of population aging from three perspectives: macro, meso, and micro; the third aspect is to sort out articles related to population factors and the environment from two aspects: total population and population structure. The specific content is as follows:
Factors Affecting Carbon Emissions
There is countless literature on the factors affecting carbon emissions, and currently the academic community mainly starts from the perspectives of economic factors, institutional factors, technological innovation factors, and so on. The economic factors mainly involve economic growth, industrial structure, income distribution, trade openness, etc. In terms of economic growth, rapid economic growth needs to be supported by high productivity, and a large scale of production is bound to exacerbate carbon emissions. For example, Amara and Bouznit et al. have found that whether economic growth is measured in gross domestic product or per capita GDP, it is a huge driving factor for the growth of carbon emissions, both have a significant exacerbating effect on carbon emissions [14, 15]. In terms of industrial structure, carbon emissions are very sensitive to the number of energy dependent industries. The more energy dependent industries there are, the more fossil energy consumed in the production process, thereby exacerbating carbon emissions. For example, Wu et al. both believe that there is a positive correlation between energy dependent industrial structure and carbon emissions [16], while Tian et al. also have a similar view [17]. They believe that the transformation of industrial structure from agriculture, mining, and light industry to resource intensive heavy manufacturing in many regions will lead to a rapid increase in carbon monoxide emissions at the national level. Zhang et al. further confirmed that upgrading industrial structure is beneficial for reducing carbon emissions [18]. In terms of income distribution, when a country’s economic level reaches a certain level, if it cannot effectively balance efficiency and fairness, it is easy to fall into the “middle-income trap” of development, leading to a series of problems such as environmental degradation and carbon emissions. Chen et al. studied developing countries and used quantile regression method to analyze and found that the more equal income distribution, the lower per capita carbon dioxide emissions [19]; Baloch et al. studied the relationship between income inequality and carbon dioxide emissions in 40 African countries between 2010 and 2016, and reached the same conclusion [20]. In terms of trade openness, its impact on carbon emissions presents a double-sided effect. On the one hand, expanding trade openness can stimulate the country’s economy and production, thereby increasing the intensity of carbon emissions; on the other hand, an open environment will introduce advanced clean technologies from other countries, resulting in emission reduction effects. Atici analyzed the impact of trade on the carbon emissions of the ASEAN group of countries and believed that an increase in exports would increase the carbon emissions of the aforementioned developing countries [21]. Ahmed et al. believe that only through trade openness can global investment in carbon reduction practices be achieved, and low-carbon technologies can be quickly spread from high-income countries to low-income countries [22]. Institutional factors mainly include environmental regulations, carbon trading, etc. In order to achieve carbon reduction, the country has introduced a large number of environmental regulatory policies and economic reform measures. The National Environmental Protection “Eleventh Five Year Plan” (NEP11-FYP) plans to set a target of reducing air pollutant emissions by 11% in 113 key cities to improve environmental quality. The strict implementation of environmental regulations will promote enterprises to achieve cleaner and more efficient production, thereby achieving the goal of carbon reduction. Ai’s DID estimation found that NEP11-FYP significantly reduced carbon emissions in key cities, confirming the carbon reduction effect of environmental regulations [23]. Eichner et al. hold different opinions, believing that there is an inverted “U” shaped relationship between environmental regulation and carbon emissions [24]. Technological innovation factors mainly refer to the impact of artificial intelligence, digital economy, and other factors on carbon emissions. With the rapid development of internet technology, academic research on carbon emission influencing factors, has gradually transitioned from traditional factors, such as economy and institutions, to emerging factors such as artificial intelligence and digital economy. In terms of artificial intelligence, its application in the industrial sector can improve production and energy efficiency, thereby reducing carbon emissions in the industrial sector. It also promotes the development of green innovative technologies, which is conducive to carbon reduction.Yu et al. classified industry data from the International Federation of Robotics (IFR, 2010–2018) as urban level variables, and found that the application of industrial robots significantly reduces carbon emissions in cities [25]. Ding et al. also found that the development of artificial intelligence has effectively promoted carbon reduction by studying data from 30 provinces in China between 2006 and 2019 [26]. In terms of the digital economy, integrating technology into all aspects of production can promote the effective utilization of resources and reduce carbon emissions. For example,Chen et al. argue that the digital economy not only directly suppresses carbon emissions, but also indirectly has a significant inhibitory effect on carbon emissions by promoting the rationalization and improvement of industrial structure [27].
The Economic Impact of Population Aging
The literature on the economic impact of population aging mainly focuses on three levels: macro, meso, and micro. From a macro perspective, the impact of an aging population on long-term economic growth and short-term economic fluctuations has received considerable attention. In terms of economic growth, most scholars believe that population aging will change the labor structure, increase the median age of the labor force, and promote labor aging, thereby reducing production efficiency and having a negative effect on economic growth. For example, Bloom et al. and Temsumrit both believe that aging populations will reduce labor force participation rates, leading to a slowdown in future economic growth [28, 29]. Some people also believe that the deepening of population aging will prolong the length of education, improve the quality of the population, and that the accumulation of experience will improve production efficiency, thereby promoting economic growth. For example, Linden et al. believes that the relationship between population aging and economic growth shows a positive linear relationship [30]. In terms of economic fluctuations, a large proportion of the elderly population in society can lead to problems such as heavy burden on elderly care and a decrease in the proportion of the working population. This can increase government financial pressure and reduce per capita income, leading to economic fluctuations. Bloom et al. predict that over the next thirty years, over 65% of the population in China will be older than the entire population of the United States, resulting in a significant decrease in per capita income [31]. From a meso perspective, the economic impact of population aging is mainly reflected in consumption, savings, employment, and other aspects. In terms of consumption, the increase in the elderly population and the consumption of products such as healthcare and housing heating have led to changes in social consumption [32]. For example, Wei et al. found that the intensification of population aging led to an increase in consumption related to healthcare and housing needs among the elderly between 2005 and 2015 [33]. In terms of savings, the larger the proportion of elderly people, the higher the expenditure on elderly care and the decrease in national savings. Pascual-Saez et al. used panel data from European country samples from 1990 to 2013 to empirically conclude that aging has a significant impact on savings [34]. Fukuda et al. found that when the working age population in Japan is large, population aging has a positive impact on the average savings rate [35]. However, when the working age population decreases, population aging has a negative impact on the average savings rate. In terms of innovation, on the one hand, aging leads to a decrease in the workforce, which in turn forces enterprises to innovate and transform from labor-intensive enterprises to technology-based enterprises; on the other hand, the prolonged education and experience accumulation caused by population aging are conducive to innovation. Tan et al. obtained evidence through empirical analysis that China’s aging population significantly promotes corporate innovation [36]. Wachsen et al. and Hoxha et al. also reached a similar conclusion that population aging causes a rigid labor market, and labor rigidity can enhance the accumulation of experience and knowledge, thereby promoting technological innovation [37, 38]. From a micro perspective, aging mainly affects household savings, household consumption, and so on. In terms of household savings, on the one hand, a family will increase household savings due to the elderly’s tendency to prevent unexpected expenses, while middle-aged people will increase savings to cope with higher life expectancy, which will also increase household savings [39]. On the other hand, elderly people will increase household expenditures on healthcare and reduce household savings [40]. In terms of household consumption, elderly people influence household consumption by influencing lifestyle and other factors [41]. A large number of elderly people in a household will inevitably increase their consumption of healthcare, heating products, and other aspects [42].
Environmental Benefits of Population Factors
From the perspective of the research system on the impact of population factors on environmental pollution, the main content covers two aspects: the first is the impact of total population on the environment. The static level mainly focuses on the relationship between population and environment. Most scholars believe that an increase in population size will lead to extensive resource extraction and waste discharge, leading to resource scarcity and environmental degradation [43]. However, not everyone agrees that population growth will necessarily lead to an increase in emissions. Instead, they believe that population size has a limited promoting effect on pollutant emissions [44], and Larkin et al. even argue that an increase in population density significantly reduces PM2.5 and NO [45]. With the deepening of research, people are gradually shifting their focus to the dynamic level, mainly considering the impact of population mobility, population urbanization, and other factors on the environment. Population mobility has an important impact on adjusting population distribution, labor surplus and shortage, and economic development. Generally, population tends to flow to areas with abundant resources and developed economies, which will accelerate urban development, increase transportation rates, and may lead to excessive resource consumption and increase emissions of some pollutants. Akinsola et al. found that the higher the degree of urbanization, the more it can exacerbate environmental degradation when studying the relationship between urban development and pollution in Africa [46]. Lin et al. reached a similar conclusion with China as the research object, stating that the urbanization process has had a significant negative impact on China's air quality [47]. Sun et al. analyzed the impact of migration on anthropogenic emissions from 1980 to 2019 and concluded that population migration has had a positive impact on reducing pollutants since 2010 [48]. Population urbanization is an important influencing factor on environmental quality. Population urbanization will promote the construction of infrastructure, housing, and residential buildings, thereby increasing energy consumption and leading to environmental pollution. For example, Rahman et al. used data from Bangladesh from 1973 to 2014 to empirically analyze the impact of population urbanization on the environment [49]. Sun et al. argue that population urbanization tends to exacerbate air pollution compared to land, economic, and social urbanization [50].
The second is the impact of population structure on the environment, mainly including the impact of population education level, population distribution, age structure, etc. on the environment. The level of education largely determines people's cognitive level, and people with higher cognitive levels have a clearer understanding of the consequences of environmental pollution, so their willingness to reduce pollution and protect the environment will be stronger. Oueslati believes that the higher the education level in a certain region, the higher the importance it places on the environment, and the lower the environmental pollution [51]. Hine et al. also found through research that education can significantly reduce wood smoke emissions [52]. Different population distribution characteristics may have different impacts on the environment.Liu et al. found that the PM2.5 level of urban population is higher than that of rural population [53]. Communities with lower socio-economic status (such as income) face higher levels of air pollution than communities with higher socio-economic status [54]. Zhao et al. also agree with the former, stating that men, urban residents, and people with lower socio-economic status are more susceptible to the impact of air pollution [55]. The age structure of the population is also closely related to environmental pollution. The aging of the population will affect environmental conditions in various ways. Based on health considerations, society's preference for better air quality may increase as the proportion of elderly people increases. Menz et al. found that the life satisfaction of elderly people is more affected by air pollution than middle-aged people, and support for improving air quality should increase with age [56, 57].
In summary, domestic and foreign researchers have conducted extensive research on the influencing factors of carbon emissions, the economic impact of population aging, and the environmental effects of population factors from multiple perspectives and methods, enriching people's understanding of carbon emissions and population aging, and playing a positive role in addressing carbon emissions and alleviating population aging. However, there are still some shortcomings in existing research. Although there is countless literature on the factors affecting carbon emissions, the vast majority of scholars focus on factors such as the economy, institutions, and technological innovation. The impact of population factors on carbon emissions is often ignored, and research on population aging and carbon emissions is even rarer. Even if we focus on the environmental effects of population factors, we still lack sufficient attention to the impact of pollutants such as smog, sulfur dioxide, and industrial waste gas on carbon emissions. Moreover, existing articles on the inherent relationship between population aging and carbon emissions have different viewpoints, and the description of how population aging affects the mechanism of carbon emissions is unclear. Based on this, this article attempts to provide answers from the above aspects, in order to provide assistance for effectively reducing carbon emissions, alleviating population aging, and achieving high-quality economic development.
Experimental
Setting of the Econometric Model
Baseline Regression Model
Based on the previous analysis and referring to the research of Xu et al. [58], this article constructs the following econometric model for the impact of population aging on carbon emissions.
Among them, the dependent variable pce measures the carbon emission levels of each region. age is the core explanatory variable that represents the degree of population aging in each region. X is a series of control variables, including economic development level, environmental regulation, industrialization degree, urbanization rate, and foreign investment level. α, β1 and θ. The regression coefficients for each variable, and to eliminate the differential effects of regional trade policies, geographical location, and economic cycles on carbon emissions, the model also controls for regional effects μ1 and time effects λt, ε is a random error term.
Mediation Effect Model
In order to further explore the internal impact mechanism of population aging on carbon emissions, referring to the practices of the academic community, based on model (1), two intermediary variables, consumption structure, and energy structure, are further introduced to construct a mediation effect model of regional carbon emissions affected by population aging. The model structure is as follows:
Among them, Z represents the mediating variables, including consumption structure variables (cos) and energy structure variables (es), which are used to characterize the impact of population aging on regional carbon emissions through consumption and production channels, respectively. Specifically, coefficient β3 represents the direct impact of population aging on carbon emissions, coefficient β2 represents the impact of population aging on the mediating variable, and coefficient β2 and σ represent the impact of population aging on carbon emissions through mediating variables.
Variable Selection
Explained Variable: Carbon Emissions
Given that the Chinese government has not yet released national, regional or industry-level carbon emission data, this article needs to estimate the carbon dioxide emissions of each province. At present, the academic community mainly uses the IPCC inventory method, input-output model, and life cycle method to calculate the total carbon emissions. This article uses the reference methods provided in the “National Greenhouse Gas Inventory Guidelines” formulated by the Intergovernmental Panel on Climate Change (IPCC) of the United Nations and follows the approach of Xu et al. to select seven fossil fuels, namely coal, coke, gasoline, diesel, kerosene, fuel oil Using natural gas and introducing cement production on this basis to measure the carbon emissions of various provinces in China [59]. The specific formula is as follows:
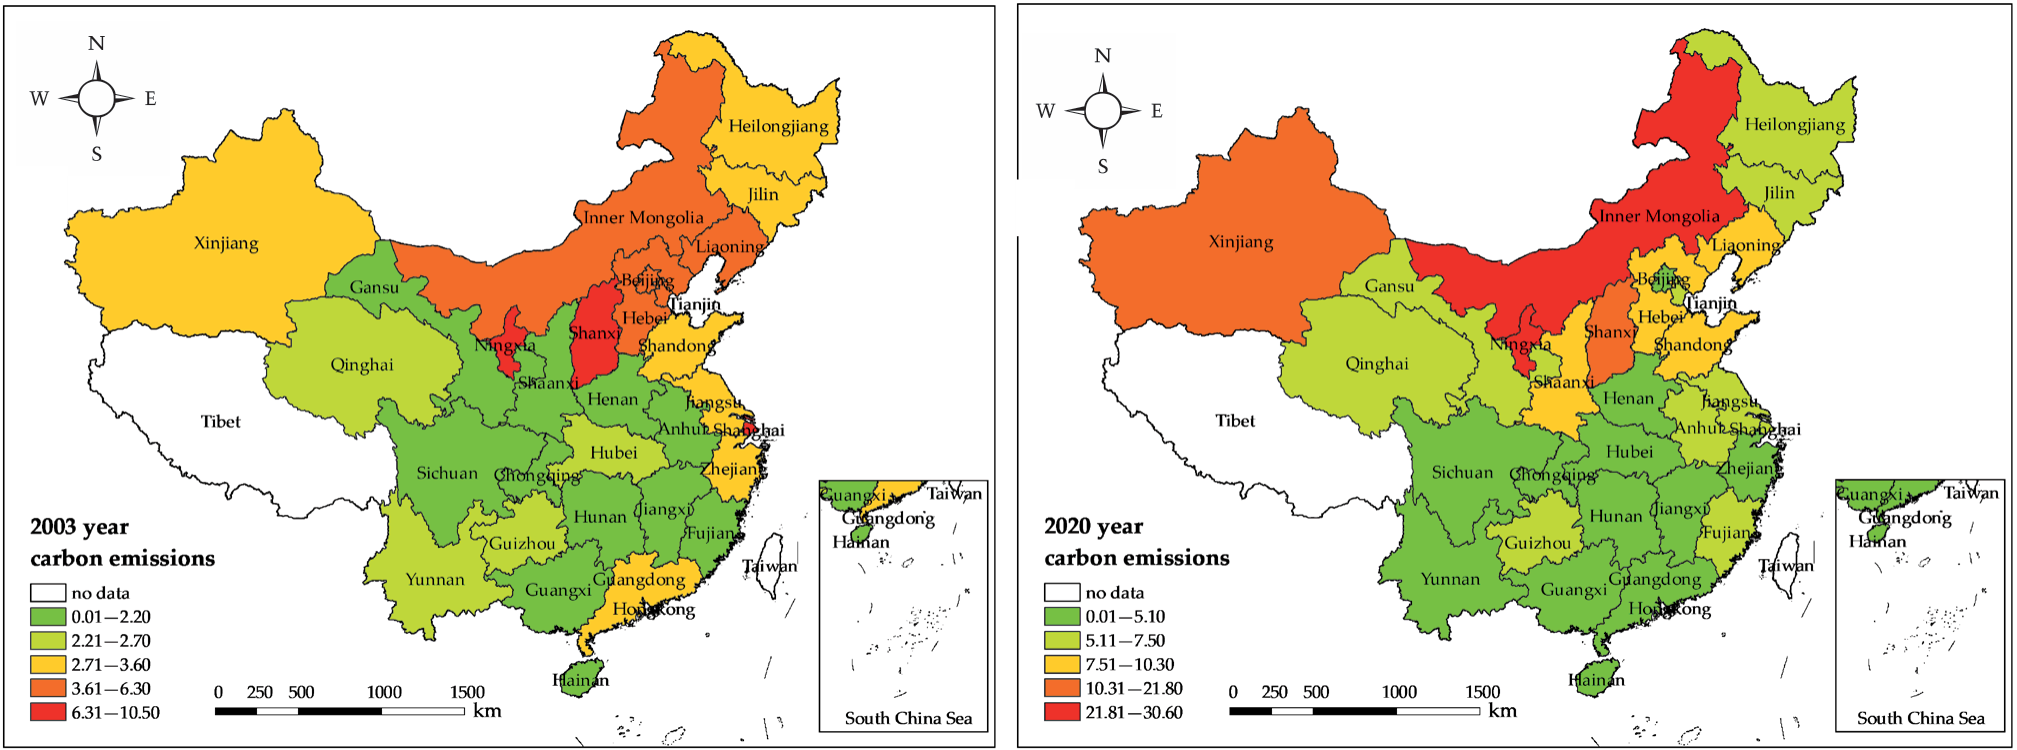
The range of m values is 1~7, representing the quantity of seven available fossil fuels; EC represents the consumption of fossil fuels; NCV is the average low calorific value of fossil fuels; CEF represents the carbon emission coefficient of fossil fuels; COF represents the carbon and oxygen factor of fossil fuels; 44/12 is the molecular weight ratio of CO2 to C; Q is the cement output; EF is the carbon emission coefficient of using cement. According to the above calculation formula, combined with China’s energy statistics, we can calculate the total carbon emissions of each region, and further take the average value according to the permanent population of each province, and finally get the per capita carbon emissions of 30 provinces in the Chinese Mainland from 2003 to 2020 (as shown in Fig. 2).
Explanatory Variable
Population aging rate. In theory, changes in population age structure will have a profound impact on carbon emissions. According to United Nations statistical standards, if a country's elderly population aged 60 and above reaches 10% of the total population or 65 and above accounts for more than 7% of the total population, then the country is already an aging population country. However, considering the actual situation and research needs of various countries, the population aging indicators currently used in relevant literature mainly include the proportion of the population aged 65 and above to the total population, the median age of the population, the elderly dependency ratio, the total dependency ratio, and the level of longevity. This article uses the proportion of the population aged 65 and above to the total population to measure the degree of population aging. At the same time, to ensure the robustness of the regression results, this article further uses the elderly dependency ratio as a substitute variable for population aging to conduct a robustness test.
Mediating Variable
Although the issue of population aging is gradually receiving attention from scholars in the field of carbon emissions research, there is still a lack of research on the impact mechanism of population aging on carbon emissions. Most scholars only use empirical speculation to explain the empirical results, lacking data explanation. Based on the aforementioned theoretical analysis, this article believes that the sources of carbon emissions can be mainly summarized into two categories: consumption and production. Therefore, the internal mechanism of the impact of population aging on carbon emissions can be analyzed from both production and consumption channels. One of the mediating variables selected in this article is consumption structure (cos), which is measured by the ratio of development enjoyment consumption to total consumption, that is, the proportion of transportation and communication, culture, education, entertainment, and healthcare consumption expenses in the per capita consumption of residents to the total consumption expenditure. Another intermediate variable, energy structure (es), is measured by the ratio of coal consumption to total energy consumption.
Control Variables
In addition to the aging rate of the population, many factors may have an impact on carbon emissions. Therefore, to avoid regression bias caused by missing important variables, this article also introduces a series of control variables in the model, specifically:
(1) Economic development level (pgdp), which is measured by per capita GDP in this article, and pgdp is the logarithm of per capita GDP of each province.
(2) Environmental regulation (er) is measured by the logarithmic value of the per capita investment in industrial pollution control in each province. (3) The degree of industrialization (is) is measured in this article by the ratio of the output value of the secondary industry to GDP in each province. (4) The urbanization rate (ur) is measured by the ratio of urban population to total population in each province. (5) The industrial agglomeration brought about by urbanization will have an impact on carbon emissions. The completion amount of foreign direct investment (fdi) is measured by the logarithmic value of the actual utilization of FDI in each province.
Data Sources and Description
Considering the availability and consistency of data, this paper selects panel data from 30 provinces in the Chinese Mainland (excluding Xizang, Hong Kong, Macao, and Taiwan) from 2003 to 2020 for empirical research. The data mainly comes from the China Statistical Yearbook, China Energy Statistical Yearbook, etc. Specifically, for the estimation of the dependent variable - carbon dioxide emissions in this article, we used the reference methods and default parameters provided in Volume 2 (Energy Volume) of the 2006 IPCC National Greenhouse Gas Inventory Guidelines and combined them with relevant parameters officially published in China. The raw data for population aging and other variables are sourced from the China Statistical Yearbook. It should be pointed out that for individual variables with missing data in individual years, such as energy data in some regions, this article uses linear interpolation to supplement them. In addition, to avoid bias caused by heteroscedasticity in the regression results, all absolute variables were logarithmized. The descriptive statistical results of the main variables are shown in Table 1.
Results and Discussion
Unit Root Test and Multicollinearity Test
Before conducting regression analysis, it is necessary to verify whether the variable data is stable, otherwise, it may lead to pseudo-regression problems and affect the accuracy of the estimation results. This article uses five methods recognized by the academic community, namely LLC, IPS, ADF Fisher, PP Fisher, and Breitung, to conduct stationarity tests on all variables in the model. The test results are shown in Table 2. Each variable can pass the stationarity test of the above five methods at a significance level of at least 10%, indicating that the sequence of variables is stationary and can be empirically analyzed. This article also needs to determine the correlation between independent variables to avoid multicollinearity problems. Therefore, the Variance Inflation Factor (VIF) method was used to test the correlation between independent variables in the model. The results showed that the maximum value of the variance inflation factor was 7.18, and the minimum value was 1.58, indicating that the variance inflation factors of each variable were less than 10, This indicates that there is no multicollinearity problem between explanatory variables in the model.
Table 1.
Descriptive Statistics of Main Variables.
Table 2.
Unit root test and multicollinearity test.
Baseline Regression Analysis
To specifically examine the impact of population aging on carbon emissions, this article uses methods such as least squares estimation (FGLS), fixed effects model (FE), random effects model (RE), and two-way fixed effects model (Two-way FE) for empirical testing. After testing, compared with the least squares estimation method, the random effects model and fixed effects model are more suitable. However, according to the Hausman test, this article should use a fixed effects model, but the fixed effects only control provinces and do not control time. Therefore, the two-way fixed effects model that controls time and provinces is ultimately used as the benchmark regression model for this article. The estimation results are shown in Table 3.
Firstly, analyze the estimation results of the core explanatory variables, as shown in Table 3. The first column shows the least squares estimation results, the second column shows the random effects model estimation results, the third column shows the fixed effects model estimation results that control the province effect, and the fourth column shows the bidirectional fixed effects model estimation results that control the province effect and time effect simultaneously. The estimation results of each model show a positive relationship between population aging and carbon emissions, that is, deepening population aging will exacerbate carbon emissions. From the regression coefficients of each model, the impact coefficient of population aging on carbon emissions ranges from 0.120 to 1.055, and all have passed the 10% significance level test, indicating that for every 1 percentage point deepening of population aging, carbon emissions will also increase by 0.120 to 1.055 percentage points. The possible reasons for this may be, firstly, the intensification of aging, the scarcity of labor, and the replacement of humans for some simple and tedious production activities by machines. The increasing demand for machines in society will consume more energy in the production and manufacturing of machines, resulting in increased carbon dioxide emissions. Secondly, under the current national conditions of China, the aging population is becoming increasingly severe, which brings heavy elderly care tasks, thereby turning the society's production chain faster and leading to higher carbon emissions. The increasing demand for high energy-consuming industries such as healthcare among the elderly leads to increased energy consumption, which in turn generates more carbon dioxide. Finally, elderly people have characteristics such as long home time and low physical fitness, which significantly increase the demand for high energy-consuming lifestyles and industries such as heating and healthcare, thus promoting carbon dioxide emissions.
Table 3.
The full sample regression results of the impact of population aging on carbon emissions.
Secondly, in terms of control variables, the level of economic development (pgdp) has a promoting effect on carbon emissions in all models, and the coefficients have all passed the significance level test of 1%. This indicates that regional economic development not only enhances people's sense of happiness and enhances national strength, but also brings about large-scale emissions of carbon dioxide. This is because high-level economic development requires a huge production system to support it. The impact coefficients of environmental regulation (er) on carbon emissions in all models are positive and significant at the 1% level, indicating a positive correlation between carbon emissions and environmental regulation. In theory, strict environmental regulation will supervise and supervise enterprises in the market to implement low-carbon production, create a green and environmentally friendly production environment, and promote carbon emissions reduction. However, in reality, the industrial scale is large, and the implementation time of environmental regulations is short. The intensity is small, and the inspection mechanism is not yet perfect. Enterprises follow environmental regulatory policies, and the cost of introducing carbon reduction and clean technologies is higher than the fines incurred by enterprises for violating regulations. Therefore, enterprises are willing to use fines to evade environmental regulatory policies and reduce production costs. Therefore, environmental regulations will increase carbon emissions. In the above model, the impact coefficients of industrialization degree (is) on carbon emissions are all positive and significant at the 1% level, indicating that carbon emissions increase with the intensification of industrialization degree. The impact coefficient of urbanization rate (ur) on carbon emissions in each model is positive and has passed the significance level test of 1%. In the process of urbanization, improving infrastructure such as residential housing and public transportation is inevitable, and industrial agglomeration will also occur. Carbon emissions will intensify with the increase in energy consumption. The coefficients of the level of foreign direct investment (FDI) are all negative and significant at least at the 5% level, indicating that the higher the actual utilization of FDI, the lower the carbon emissions. The possible reason is that actively introducing foreign investment has led to an increase in funding for research and application of carbon reduction and clean technologies, thereby promoting carbon reduction.
In summary, the intensification of population aging will inevitably bring enormous carbon emission pressure. Nowadays, the aging situation in China is severe and has a long duration. We must carefully explore the relationship between carbon emissions and population aging, alleviate the pressure brought by population aging, and actively respond to the problems and challenges brought about by this.
Robustness Tests
To ensure the robustness and reliability of the results, this article adopts the following five methods for robustness testing, namely: (1) adjusting the measurement of explanatory variables. Replace the indicator for measuring population aging from the proportion of people over 65 years old to the total population to the elderly dependency ratio. (2) Adjust the measurement caliber of the dependent variable. Using the ratio of carbon emissions to GDP to replace per capita carbon dioxide emissions to reflect carbon emissions. (3) Adjust the interval of empirical samples. To eliminate the interference of sample endpoint values on regression results, this article re-conducts econometric regression by deleting data from 2003 and 2019. (4) Perform a 1% tail reduction on the sample. In order to eliminate the impact of individual outliers on the research results, this article conducts regression analysis on the variable data of the samples involved in the study after bilateral tail reduction at the 1% quantile.
(5) Adjust the model estimation method. To avoid endogeneity issues, the system's generalized moments are used for analysis. The robustness test results are shown in Table 4 below.
From the estimation results of various models, it can be seen that population aging has a positive impact on carbon emissions, with impact coefficients ranging from 0.0138 to 8.308, and all pass the 1% significance level test, indicating that population aging can significantly exacerbate carbon emissions. This conclusion is completely consistent with the benchmark regression analysis. In addition, as far as the control variables are concerned, the sign and direction of the regression coefficients of each control variable are also consistent with the benchmark regression results. For example, the level of economic development, environmental regulations, degree of industrialization, and urbanization rate all have an exacerbating effect on carbon emissions, while the impact of foreign investment on carbon emissions is significantly negative. In summary, the above analysis indicates that the benchmark regression results are robust.
Table 4.
Robustness analysis.
Endogeneity Test
Although this article has introduced some important control variables related to carbon emissions, there may still be omissions affecting other important variables of regional carbon emissions. At the same time, the intensity of carbon emissions may to some extent reflect the economic development of the region. Regions with higher levels of carbon emissions may have lower economic development potential, leading to a significant outflow of young people and exacerbating population aging, resulting in a two-way causal relationship between population aging and carbon emissions. To overcome the endogeneity issues mentioned above, this article selects the ratio of pension insurance fund expenditure to GDP of each province from 2003 to 2020 as the instrumental variable for population aging. Specifically, this indicator meets the instrumental variable requirements for population aging based on the following reasons: from a correlation perspective, the expenditure of pension insurance funds in various regions is positively correlated with population aging. The more pension insurance fund expenditure, the more elderly people enjoy better elderly care, better medical conditions, better care, higher security for elderly life, and lower mortality rates. As a result the aging population will also deepen. From the perspective of exclusivity, the expenditure of pension insurance funds will not directly affect the intensity of carbon emissions. Therefore, this article uses the "ratio of pension fund expenditure to GDP" as an instrumental variable to conduct endogeneity tests based on model (1), and the test results are shown in Table 5.
Among them, the (1) and (2) lists show the instrumental variable regression results for the entire sample. In addition, considering that the advanced development of megacities will have a profound impact on the proportion and quantity of pension fund expenditures, this article further excludes some samples such as Beijing and Shanghai for testing. The regression results of instrumental variables are shown in (3) and (4). Listed as the sample regression results after excluding Beijing and Shanghai. In columns (1) and (3), it can be seen that the impact coefficient of pension fund expenditure on population aging is significantly positive, which confirms our hypothesis that pension fund expenditure is positively correlated with population aging, indicating that the instrumental variable satisfies the correlation. From the estimated results in columns (2) and (4), it can be seen that there is still a significant positive correlation between population aging and carbon emissions, indicating that population aging significantly promotes carbon emissions. In addition, the F-values of the weak instrumental variable test using two samples were 47.461 and 35.168, respectively, which were much greater than the critical value of 16.38 for the weak instrumental variable, passing the weak instrumental variable test.
Table 5.
Endogeneity test
Test of Regional Heterogeneity Effect
China has a vast territory and vast resources, with significant regional disparities in economic development, significant differences in resource endowment, and significant differences in population distribution. Is there a significant regional difference in the impact of population aging on carbon emissions? Answering this question is of great significance for alleviating the pressure of population aging and finding the optimal regional carbon reduction path. Therefore, based on the level of economic development, this article first divides the sample into developed regions (11 provinces) and underdeveloped regions (19 provinces) using the average per capita GDP in 2003 as the dividing point. Secondly, based on geographical characteristics, the sample is organized into two parts: coastal regions (11 provinces) and inland regions (19 provinces). Based on these two sets of samples, regional heterogeneity tests of population aging on carbon emissions are conducted, The results are shown in Table 6.
Table 6 reports the regional effect test results of the impact of population aging on carbon emissions, indicating significant regional heterogeneity in the impact of population aging on carbon emissions. Specifically, the impact coefficient of population aging on carbon emissions in developed, coastal, and inland regions is positive and has passed the 1% significance level test. It indicates that population aging in developed, coastal, and inland regions will significantly exacerbate carbon emissions. When population aging deepens by 1 percentage point, carbon emissions will increase by 1.589, 0.700, and 0.988 percentage points, respectively. However, in underdeveloped areas, the coefficient of population aging rate (age) is -0.721, and the 1% significance level test, indicates that there is a negative correlation between carbon emissions and population aging in underdeveloped areas. This is significantly different from the benchmark regression results, which may be due to the severe aging situation and the heavy burden on the country's elderly care. Compared to underdeveloped areas, economically developed areas bear more heavy elderly care tasks, The production volume of enterprises is larger, and carbon emissions are bound to increase significantly. The economy in underdeveloped areas is relatively backward, and only minor elderly care tasks need to be undertaken. The productive carbon emissions caused by enterprise production will not significantly increase, and the proportion of elderly and young people in underdeveloped areas is higher than that in developed areas. As a result, the carbon emissions in daily life are reduced, such as an increase in elderly people and a decrease in the use of private cars, resulting in a decrease in carbon emissions. Therefore, in underdeveloped areas, Carbon emissions decrease with the deepening of population aging.
Table 6.
Heterogeneity analysis.
Secondly, in terms of control variables, the impact of variables such as environmental regulations, urbanization, and foreign investment level on carbon emissions is basically consistent with the benchmark results. The impact of economic development level on carbon emissions in developed and coastal regions is consistent with the benchmark regression results, indicating that the level of economic development significantly promotes carbon emissions. However, in underdeveloped and inland regions, the level of economic development has an inhibitory effect on carbon emissions. This may be due to the increase in funding for research and application of carbon reduction and emission reduction technologies as the level of economic development in underdeveloped and inland regions improves, to promote carbon reduction. It is worth noting that the intensification effect of industrialization on carbon emissions is not significant in developed and coastal areas. This may be because in developed and coastal areas, economic strength is strong and carbon reduction investment is large, resulting in reduced carbon emissions almost equal to the carbon emissions produced by the huge industrial production system.
In summary, there are significant regional differences in the impact of population aging on carbon emissions. From the perspective of the effect, the aging of populations in developed areas, coastal areas, and inland areas has a significant promoting effect on carbon emissions. Among them, developed areas have the highest, followed by inland areas, and coastal areas have the lowest. However, the aging of populations in underdeveloped areas has an inhibitory effect on carbon emissions.
Mechanism Analysis
As mentioned earlier, overall, there is a positive correlation between population aging and carbon emissions. So, through what channels does population aging affect carbon emissions? In terms of consumption, in the early stages of population aging, the main reasons are a decrease in fertility rate and an extension of lifespan. Elderly people consume more on healthcare, while their demand for cars and other products is far lower than that of young people. Therefore, aging may be achieved by changing the consumption structure to affect carbon emissions. In terms of production, the aging population will lead to a decrease in the working-age population, leading to a shift from labor-intensive industries to machine labor-intensive industries. The production and manufacturing of machines are highly energy-consuming. In addition, as the proportion of the elderly population increases, the consumption of more energy-intensive products will also increase. For example, elderly people living at home for a long time will have an increased demand for heating, air conditioning, electricity, or firewood heating, and thus the aging population may affect carbon emissions by changing the energy structure. Therefore, this article selected two mediating variables, consumption structure and energy structure, combined with a full sample and a subset of developed and underdeveloped regions, and used a three-step regression method for mediating effect analysis to verify the effectiveness of consumption and production channels in the internal mechanism of population aging affecting carbon emissions. The results are shown in Table 7.
The (1), (3), and (5) columns in the above table correspond to the mediation effect results of introducing consumption structure as a mediator variable in the whole country, developed regions, and underdeveloped regions, respectively. The (2), (4), and (6) columns correspond to the mediation effect results of introducing energy structure as a mediator variable in the whole country, developed regions, and underdeveloped regions, respectively. From the Sobel test, it can be seen that the z-values of groups (1), (2), (3), and (4) are all significant at the 10% level, indicating that the aforementioned groups all have mediating effects. However, the z-values of groups (5) and (6) did not pass the significance test, indicating that there is no mediating effect using consumption structure and energy structure as mediating variables in underdeveloped regions. The results of the Goodman test are consistent with the Sobel test, with only the z values of the (5) and (6) groups not significant. Therefore, there is no mediating effect in the (5) and (6) groups.
The coefficients of age and cos in columns (1) and (3) are all positive and have passed the significance level of 1%. This indicates that there is a partial mediating effect using consumption structure as a bridge in both the country and developed regions, with the ratio of mediating effect to total effect being 19.0% and 32.5%, respectively. The aging population can promote an increase in carbon emissions by changing consumption structure. The elderly have a large demand for medical care, health care, and other aspects. Zeng Yi's survey found that the annual per capita medical expenses of the elderly are 3 to 5 times that of young people. This puts forward high requirements for improving medical facilities and developing the nursing and healthcare market in society, which promotes the production of medical devices and drug research and development, leading to an increase in carbon emissions.
Table 7.
Mechanism of the impact of population aging on carbon emissions.
The coefficients of age and es in columns (2) and (4) of the above table are all positive and have passed the 1% significance test. This indicates that there is a partial mediation effect using energy structure as a bridge in both the country and developed regions, with the ratio of mediation effect to total effect being 20.3% and 21.7%, respectively. This indicates that population aging can promote carbon emissions by changing energy structure. On the one hand, the aging situation is becoming increasingly severe, and machines will gradually replace humans in the labor market to complete some complex and redundant tasks. The development and production of machines are closely dependent on fossil fuels such as coal. On the other hand, elderly people are more eager for high energy consumption lifestyles such as free heating, which will inevitably lead to an increase in fossil energy consumption and exacerbate carbon emissions.
In short, both nationally and in developed regions, there are two effective ways in which population aging affects carbon emissions. On the one hand, development-oriented consumption expenditures such as healthcare increase with the growth of the aging population, thereby changing the consumption structure and exacerbating carbon emissions. On the other hand, the deepening of aging will increase dependence on high-energy products or lifestyles such as machine labor, medical devices, and heating, leading to changes in energy structure and promoting carbon emissions.
Conclusion and Recommendation
Carbon emissions are closely related to our living environment. In recent years, both domestic and international attention has been paid to carbon emissions. In 2020, China clearly proposed the goals of “carbon peak” by 2030 and “carbon neutrality” by 2060, and the characteristics of population aging are becoming increasingly prominent. Studying the relationship between carbon emissions and carbon emissions is of great significance for solving carbon emissions problems. By constructing a related model of population aging, this paper theoretically explains the internal mechanism of the promotion effect of population aging on carbon emissions. On this basis, we collected panel data from 30 provinces in the Chinese Mainland from 2003 to 2020, and empirically tested the impact mechanism and effect of population aging on carbon emissions using a two-way fixed effect model. The research results indicate that overall, population aging can significantly promote carbon emissions, and a series of robustness tests also confirm this conclusion. At the same time, economic development, environmental regulations, urbanization rate, and degree of industrialization will all promote carbon emissions, while the level of foreign direct investment is conducive to promoting carbon emissions reduction; from a regional perspective, the aging population in developed, coastal, and inland regions has an exacerbating effect on carbon emissions. Developed regions have the highest carbon emissions, followed by inland regions, and coastal regions have the lowest carbon emissions. Underdeveloped regions have emission reduction effects; from the perspective of mechanism, on the one hand, an aging population will change the consumption structure, thereby promoting carbon emissions; on the other hand, an aging population will change the energy structure, thereby promoting carbon emissions. Based on the above research conclusions, in order to better protect the human living environment, address carbon emissions and population aging issues, this article proposes the following policy recommendations:
Firstly, accelerate the adjustment of population policies and weaken the exacerbating effect of aging on carbon emissions. The above research reveals that population aging has a significant promoting effect on carbon emissions, and the urgent task is to minimize the exacerbating effect of population aging. To alleviate the problem of population aging, we first call on young people to actively respond to the “three-child” policy and increase the birth rate. On the one hand, the government should provide more economic assistance in pregnancy, childbirth, and nurturing children, such as providing medical subsidies and reducing tuition fees. On the other hand, from a female perspective, it should alleviate the psychological pressure of eligible women, pay attention to the psychological status of pregnant and lactating women, actively improve the security system for women’s pregnancy and childbirth in various work units, strive to eliminate workplace discrimination against women who have given birth or are about to give birth, and ensure maternity leave and various production benefits to address women’s concerns. At the same time, the country should adhere to a high-quality economic development model, maintain long-term stable economic growth, alleviate the economic pressure on young people, improve the social security system for the elderly, share the elderly care pressure on young people, enhance their sense of happiness in life, thereby increasing the willingness of young people to have children, alleviating aging, and weakening its promoting effect on carbon emissions. Secondly, it is necessary to implement the policy of delaying retirement, effectively develop and utilize a large scale of elderly human capital, increase labor participation rates, reduce the burden on young people, improve the allocation of labor and capital, alleviate aging, and thus reduce carbon emissions.
Secondly, strengthen cross regional collaborative governance of the environment, reasonably allocate production and elderly care pressures between regions, and maximize emission reduction effects. Due to significant differences in economic development levels among different regions in China, the production scale and burden of elderly care in developed regions are relatively large, which inevitably leads to a more severe carbon emission situation. However, underdeveloped regions are limited by their own economic strength, production scale is small, and carbon dioxide emissions are relatively mild. Therefore, when implementing emission reduction policies, the government should fully consider the spatial differences in carbon emissions, adjust the spatial layout of carbon emissions, introduce production enterprises from developed regions to underdeveloped regions, and enable underdeveloped regions to undertake more production tasks. While evenly distributing carbon emissions nationwide, it should also drive the economic development of underdeveloped regions.
Once again, promote the concept of green consumption and upgrade the consumption structure. Enhance the environmental awareness of the elderly population, advocate for them to choose a green lifestyle, guide them to exercise appropriately, maintain good living habits, and enable them to have a healthy and excellent physical and psychological condition, reducing their dependence on medical care. Secondly, convey the concept of low-carbon in daily life, use public transportation as much as possible, reduce the exhaust emissions of private cars, travel low-carbon, improve the utilization rate of household goods, refuse to use disposable goods, and reduce carbon dioxide manufacturing emissions. Finally, actively plant trees and trees to create green mountains and rivers, maximizing the absorption of carbon dioxide.
Finally, develop new energy, research new technologies, and optimize the energy structure. The deepening of aging will inevitably bring about a wave of machine manufacturing. We should start with the research and development of machines, apply more clean energy and materials, optimize energy consumption structure, and reduce carbon dioxide emissions. At the same time, it is necessary to increase the supervision of enterprise environmental protection, improve the laws, regulations, and punishment systems related to green production, urge more enterprises to carry out legal and compliant production and meet the standards of emissions, and fundamentally weaken carbon emissions.
Although this article explores the mechanism and impact of population aging on carbon emissions, and draws rich conclusions, there are still two shortcomings. Firstly, this article uses provincial panel data and fails to consider the impact of population aging on carbon emissions at the municipal level. Secondly, environmental pollution has significant spatial correlation, and the bidirectional fixed effects model used in this article did not consider this issue. In the future, we will further expand to the urban level to explore the impact mechanism between population aging and carbon emissions. At the same time, we should further use spatial econometric models to conduct research, making the relationship between population aging and carbon emissions more comprehensive and scientific.

