

Introduction
GI is a technological innovation that is strategically implemented by firms to mitigate environmental impacts and preserve the environment [1, 2]. GI involves the development and application of new technologies, processes, and products that minimize the environmental footprint of business activities while enhancing economic competitiveness and profitability. Despite its potential benefits, the double externality of GI creates a particular challenge for firms [3]. The companies often lack the internal motivation to implement GI, and they only do so under external driving mechanisms, such as environmental regulations [4]. GI includes two primary strategies: green process innovation and green product innovation [5, 6]. Green product innovation involves modifying product designs by incorporating non-toxic compounds or biodegradable materials during production [5-7]. The main purpose of green product innovation is profit and its institutional logic is economic logic. Green process innovation can be defined as the use of environmentally friendly technologies and manufacturing processes to produce goods and provide services that impose no or less negative impact on the people and the environment. Green process innovation targets to reduce energy consumption during production or in the process of converting waste into a valuable product [5-7]. Its institutional logic is environmental logic. Although enterprises must invest resources in green product innovation and green technology innovation, but the former provides more benefits than the latter.
Scholars have conducted extensive studies on the impact of environmental regulation on firms’ GI [8]. However, these studies have produced inconsistent conclusions. Some studies have shown that environmental regulation may encourage firms to improve environmental investment [8, 9] and reduce pollutants emission [10]. Furthermore, other studies have demonstrated that high intensity environmental regulations tend to reduce policy effectiveness and increase environmental costs [1, 2, 11], thus leading to a resource crowding-out effect. These conflicting results make it challenging to optimize environmental policy tools and for firms to adopt appropriate strategies in response to environmental regulations. Therefore, more research is needed to develop a clearer understanding of the relationship between environmental regulations and GI. For some firms, the goal of GI is to obtain more government subsidies [12], and others seek to improve green performance [13]. There is a lack of empirical research on enterprises’ response to environmental regulation through GI. To address this research gap, this paper divides GI into green process innovation, and green product innovation and takes the ETR in China as a natural experiment to explore how enterprises respond differently to ETR through GI when considering different stakeholders (mainly referred to as major stakeholders and secondary stakeholders). In 2018, China implemented the ETR, which requires firms to pay environmental protection tax (EPT) instead of paying environmental pollution charges (EPC). The effect of ETR on corporate environmental protection behavior has attracted the attention of scholars, among which green innovation is an important topic. The existing researches mainly discuss the effect of top-down ETR policies, but lack to discuss the response of enterprises to policies from the perspective of differentiation of enterprises.
This paper argues that the ETR has a twofold effect on firms, affecting their environmental costs and highlighting the signaling role of environmental policy. On one hand, EPT raise the cost of pollution by making enforcement more rigid [9]. The higher cost of the EPT compared to the pollution discharge will crowd out green innovation resources. In response to the resource crowding-out effect, enterprises that emphasize TCSRs in particular may reduce GI. On the other hand, pollution charges are punitive measures against environmental pollution, whereas EPT are aimed at encouraging firms to reduce emissions and shift towards GI. The ETR can boost firms’ confidence in green development and facilitate the gain of competitive advantages through GI [14]. In response to the green signal from ETRs, enterprises that emphasize ICSRs in particular may upgrade their GI.
Material and Methods
The Contextual Background
Since July 1st, 2003, China has implemented EPC policy, requiring charges for water, air, waste, and noise pollution. The government adjusted discharge standards and implemented differentiated policies. However, there are still problems. Inadequate enforcement and local government interference pose challenges. The government introduced EPT in 2018, marking a departure from admin charges to market-based ones. This law requires organizations to pay EPT, widely accepted by regulators and public, as it measures emissions-related costs directly [15]. The EPC and the EPT have distinct features. Firstly, their governance objectives differ. EPC punishes firms for polluting, while EPT regulates environmentally-friendly behavior by imposing taxes on polluters. Secondly, EPC is an administrative penalty enforced by environmental protection departments, while EPT is enacted by national legislation and enforced by tax departments. Lastly, EPT has two levels of emission reduction incentives, while EPC only provides one level of emission reduction incentive [9-14].
Theory Analysis
Heterogeneous GI Responses to ETR
Environmental regulations increase the pollution cost for firms. If the pollution cost saved by GI is greater than the cost of innovation, firms will carry out GI [16]. Therefore, many studies consider GI as a response to environmental regulation from the perspective of cost or resources [17]. However, these studies have neglected to examine how firms respond to government environmental regulations through GI from the perspective of the signaling effect. This study combines resource & signaling perspectives to explore ETR’s role on GI. This study splits GI into green product innovation dominated by economic logic & green process innovation dominated by environmental logic. Green product innovation which pays attention to environmental problems throughout the product life cycle is a “cradle to grave” innovation [18]. Firms should adopt green product design, use environment-friendly raw materials, green marketing and green after-sales service. These activities will greatly increase the time cost and economic cost of firms. However, it has the potential to maintain the competitive advantage of the industry and improve economic benefits for firms [6]. The green process innovation is technological innovation dedicated to solving the “non-green” problem in the existing production process of the enterprise. It reduces environmental pollution through green production process, transportation and other mitigation [6].
The Response to the Signaling Effect
Green development is a key priority for China’s economic growth and the EPT is a critical tool to advance this agenda. Firms in China see the EPT as a signal of the country’s commitment to green development. Developing GI is imperative for firms to remain competitive, which can be achieved through green process or product innovation. GI is essential for achieving emission reduction goals. However, it is challenging to convey green signals to stakeholders through GI due to the internal invisibility of technological innovation. Green products serve as a powerful signal of corporate commitment to green development [19], and are emerging as the primary means for achieving sustainable development. As such, firms must focus on developing green products to enhance their green value and reputation [20].
GI can be achieved through green process innovation or green product innovation. However, conveying green signals to stakeholders through GI is challenging due to the internal invisibility of technological innovation. Developing green products serves as a potent symbol of a corporation’s commitment to green development and is emerging as the primary means for achieving sustainable development. By showcasing their green business card to stakeholders [21], firms can obtain government policy inclusions and subsidies, gain the trust of consumers, and improve their value evaluation by investors [22, 23]. Moreover, market-based environmental regulations can help firms break through the path dependence of GI [24]. Therefore, firms prioritize green product innovation over green process innovation to respond to the green signaling effect of ETR.
Hypothesis 1a. Firms respond to the signaling effect of ETR by improving green product innovation activities.
The Response to the Resource Crowding-out Effect
After the ETR takes effect, regions must implement EPT by increasing tax rates or shifting tax burdens. This raises the cost of pollutant discharge for firms. High-polluting firms face “historical problems” of high pollution and energy consumption. Rapidly breaking through the old model of high pollution and energy consumption is difficult, as is decoupling enterprise development from environmental pollution. Due to high-intensity environmental governance by external ETR and difficulties in their own transformation, high-polluting firms bear higher pollution costs. The increased financial burden crowds out resources for GI [25].
In the context of green development, innovation in all stages of the product life cycle must be taken into account. Any modification in one stage can impact the innovation of the other stages, thereby increasing the cost of adjustment. The innovation of production processes, such as reducing emissions and water consumption, adopting resource-efficient practices, and transitioning to bioenergy, falls green process innovation [5]. Such innovation can be achieved through limited resources and adjusting production equipment or raw material input [26]. Consequently, the cost of adjusting green process innovation is lower than that of green product innovation. However, when enterprise resources for GI are limited due to ETR, they tend to reduce green process innovation rather than green product innovation to improve their environmental performance [15]. Some scholars have studied that the imposition of high tax rates could lead to the adoption of dirtier technology rather than cleaner technology, resulting in a non-monotonic technology choice. Therefore, firms tend to lower green process innovation as a response to the resource crowding-out effect of ETR.
Hypothesis 1b. Firms respond to the resource effect of ETR by reducing green process innovation activities.
The Eole of CSR on Policy Effect
Based on exploratory factor analysis [27], some results [28] distinguished corporation social responsibility (CSR) as TCSR and ICSR on account of the primary stakeholders and secondary stakeholders the firms interact with. Primary stakeholders are targeted by the TCSR, while secondary stakeholders are targeted by the ICSR. The primary stakeholders influence operation of business and make legitimate claims on the firm and its managers and have both urgency and power to enforce those claims [29]. The TCSR is highly likely to induce these stakeholders to engage in increased exchanges with the firm, to placate stakeholders and forestall negative economic consequences [28]. In contrast, secondary stakeholders, who can influence the firm’s primary stakeholders, have legitimate claims on the firm, but lack both urgency and power to enforce those claims. The ICSR is more likely to be seen as self-interested actions to enhance the exchange prospects with primary stakeholders. The ICSR indicates the extent to which firms respond to normative expectations through positive corporate social action toward institutional stakeholders [28].
As analyzed above, ETR will not only increase the cost of pollutant discharge, but also improve the green value of firms. Primary stakeholders of firms, including employees and suppliers, are more concerned about the economic burden caused by the enterprise’s pollution, while secondary stakeholders of firms, including the community and the government, are more concerned about whether the enterprise has actively responded to the green development signal of the fee and tax change. Therefore, firms with higher TCSR level are more concerned about the mandatory requirements of primary stakeholders on corporate legitimacy, which can strengthen the resource crowding-out effect of ETR on GI. However, firms with high ICSR activity pay more attention to the legitimacy requirements of secondary stakeholders, thus amplifying the green signaling effect of ETR.
Hypothesis 2a. The effect of ETR to green product innovation activities is greater for firms with higher ICSR.
Hypothesis 2b. The effect of ETR to green process innovation activities is greater for firms with higher TCSR.
Method and Data
Model Setting
Following the DID model setting of Cui (2022) [30] and Lian (2022) [12], the following DID models are proposed to evaluate the impact of ETR on GI.
The dependent variable GIi,t represents green product innovation (Gproducti,t) and green process innovation (Gprocessi,t) of enterprise i in the year t respectively. In the Equation (1), i represents the enterprise and t indicates the year. DIDi,t indicates that the enterprise was affected by ETR in year t. Specifically, DID = HP * Time, HP is an industry dummy variable, when the enterprise is highly polluting industries, the value is 1, otherwise 0. Time is a time dummy variable. Since the EPT came into effect in 2018, the value is 1 for 2018, otherwise 0. Additionally, controli,t serves as the control variable. δi, δt, δc, represent the fixed effect of the individual, year and city respectively. Also, ɛi,t is the random error. α is the constant.
In order to test the effect of CSR on the relationship between ETR and GI, the following models are proposed.
Where, ICSRi,t indicates the institutional corporate social responsibility, and TCSRi,t indicates technical corporate social responsibility.
Variable Measurement
Explained Variables
Green product innovation (Gproduct) is measured by the proportion of word frequency of green product innovation in the total CSR report times 100. Green process innovation (Gprocess) is measured by the proportion of word frequency of green process innovation in the total CSR report times 100.
Explanatory Variables
HP. Dummy variable. It indicates whether it is a high-polluting firm, the value is 1 if the enterprise belongs to the high-pollution industry, otherwise 0.
TIME. Dummy variable. It indicates the year EPT of the People’s Republic of China is adopted. Due to EPT of the People’s Republic of China is adopted in 2018,the value is 1 for 2018 and later years, otherwise 0.
DID. Dummy variable. It indicates the effect of policy conflict on high-pollution firm. It is equal to HP *TIME.
Moderate Variables
The CSR score from the CSR evaluation system of listed companies of Hexun.com, a third- party rating agency for corporate social responsibility, is used in the study. The CSR evaluation system grates social responsibility of listed companies from five categories: shareholder responsibility, employee responsibility, supplier, customer and consumer rights responsibility, environmental responsibility and social responsibility. The higher the CSR score, the better the CSR performance. Following to the empirical classification of CSR of [28], the sum of responsibility scores for environment and social responsibility is used to measure ICSR, the sum of responsibility scores for shareholders, employees, suppliers and consumers’ responsibility is used to measure TCSR.
Control Variables
GDP. Logarithm of GDP per capita of the city firm located. The data is derived from the National Bureau of Statistics.
ROA. Logarithm of return on total assets or firm. The data is derived from the CSMAR database.
Growth. The sustainable growth rate of firm. It’s equal to the ratio of the product of return on equity and earnings retention to 1 minus the product of return on equity and earnings retention. The data is derived from the CSMAR database.
SO2. Disclosure of environmental liabilities. The disclosure of SO2 emission. The value is 1 if the firms disclose SO2 emission, otherwise 0.
Table 1.
Descriptive statistics.
Sample and Dataset
The firm-level data of the study mainly are obtained from the annual reports, corporate social responsibility reports of Chinese listed companies and CSMAR database. City-level data are obtained from the National Bureau of Statistics of China, municipal almanac and the official website of Chinese prefecture-level city governments.
China’s manufacturing industry has shifted from extensive to intensive development with a focus on sustainable development and green technologies. The performance of pollution control in China’s manufacturing industry can serve as a model for other countries. This paper uses listed manufacturing firms in China as samples. Heavily polluting listed firms in China’s manufacturing industry were screened out based on the Classified Management List of Listed Companies’ Environmental Protection Verification Industry and the Notice of the Ministry of Industry and Information Technology. Thirteen industries, including coal gas production, textile, leather, paper, and chemical manufacturing, were identified as sample industries. Firms with ST and *ST treatment and undisclosed CSR were removed. The time period of data is 2012-2021.
Data Source of Enterprise GI
There are three primary ways to measure GI. First, a single green technology patent indicator could be applied to assess GI [31]. Second, principal component analysis is employed [32]. The data envelopment analysis is employed in the third measure [33]. A Likert scale is used in the fourth strategy [1, 6, 34]. The fifth method uses proxy variables to measure industry-level green process innovation and green product innovation [35]. Measures cannot show complete green product & process innovation. This paper uses text analysis to measure them. Steps: 1) Determine analysis content - listed companies’ CSR reports including environmental & social responsibility information required by China Securities Regulatory Commission. 2) Identify keywords. According to the environmental keywords of [36] and the questionnaires of Chen [1] and Chiou [6] for green process innovation and green product innovation, we preliminarily determined the GI keywords. First, we randomly selected 10% of the CSR reports of listed firms. Additionally, we refined the keywords in the report, and also determined the keywords for green process innovation and green product innovation. Since each enterprise expresses the same idea differently, a keyword may correspond to several sub-keywords. Finally, we develop a program in R to calculate the frequency of each keyword.
Data Sources of Other Variables
Drawing on the research of some scholars [4, 14, 37, 38], this paper selects firm-level variables such as ROA, the sustainable growth rate (Growth) and the disclosure of SO2 emissions. Otherwise, urban economic development will also affect the level of GI of firms, this paper controls city-level variable such as GDP per capita in the city where the firm is located.
Results and Discussion
The Baseline Results
Table 1 shows the descriptive statistics of variables. Columns (1) and (3) of Table 2 respectively show the effect of ETR on enterprise green product innovation and green process innovation when control variables are not added, indicating that ETR has a positive and significant effect on enterprise green product innovation and a negative and significant effect on green process innovation.
Columns (2) and (4) of Table 2 respectively show the effect of ETR on enterprise green product innovation and green process innovation after adding control variables. The coefficient of DID in column (2) indicates that the effect of ETR on enterprise green product innovation is significant positive, hypothesis 1a is supported. The coefficient of DID in column (4) of Table 2 indicates that ETR plays a significantly negative role in enterprise green product innovation. Hence, hypothesis 1b is supported.
Table 2.
The baseline result.
Parallel Trend Test
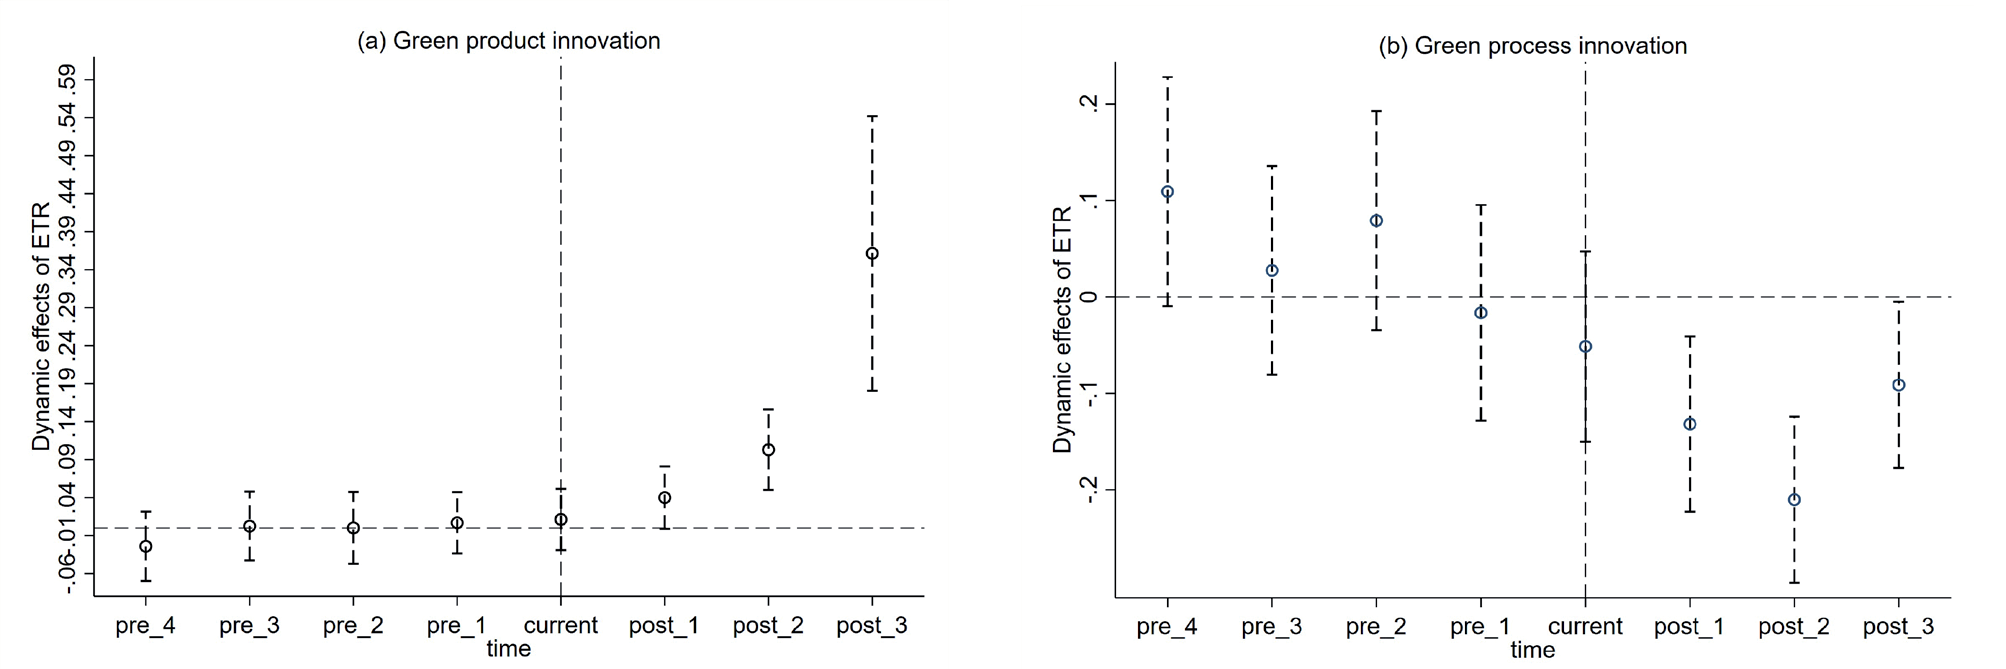
This paper adopts DID method to determine the impact of ETR on GI. The basis of this method is to meet assumption of the parallel trend. This paper uses the event study to test the parallel trend and draws estimated coefficient graphs to visually show the parallel trend of green product innovation and green process innovation [39]. The abscissa represents the time point. The year 2018 is ETR occurrence period and is normalized to 0. Fig. 1a) shows that before ETR, the coefficient was not significant, indicating insignificant difference between the treatment group and the control group, and after ETR, the coefficient is significantly positive and increasing, indicating that ETR promotes significantly the treatment group. Fig. 1b) shows that before ETR, the coefficient was not significant, indicating insignificant difference between the treatment group and the control group, and after ETR, the coefficient is significantly negative, indicating that ETR significantly decreases the treatment group.
Moderating Effect
As shown in column (1) of Table 3, the cross coefficient of ICSR and DID is significantly positive, indicating that ICSR enhances the green signaling effect of ETR. The higher the ICSR is, the stronger the ETR is on green product innovation. The cross coefficient of ICSR and DID in column (2) is not significant, indicating that ICSR has an insignificant effect on resource crowding-out effect of ETR. Therefore, hypothesis 2a is supported.
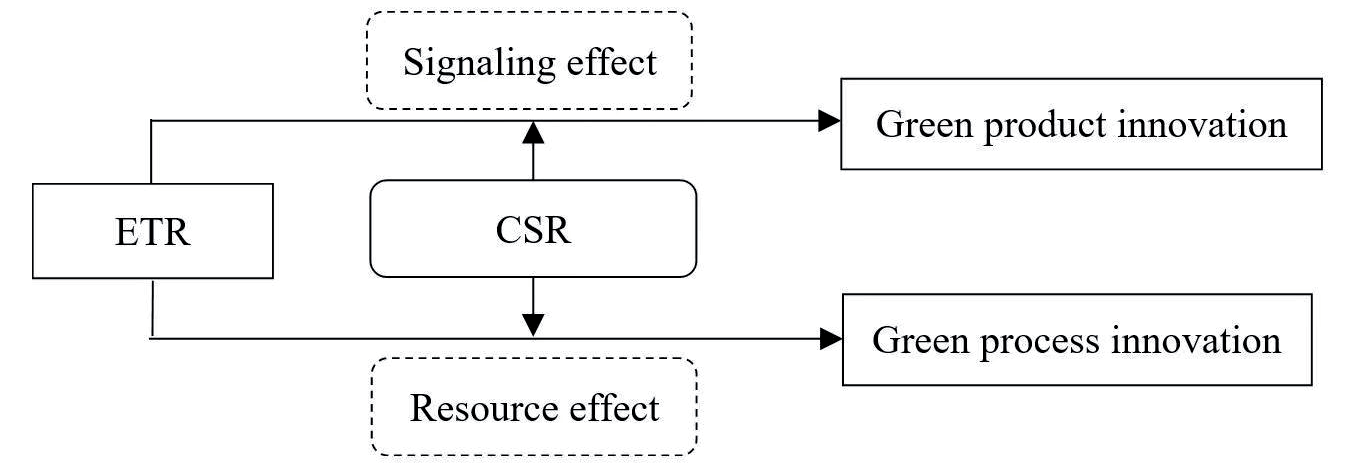
Table 3.
Mechanism analysis results.
The cross coefficient of TCSR and DID in column (3) of Table 3 is not significant, indicating that TCSR had an insignificant effect on green signaling effect of ETR. As shown in column (4) of Table 3, the cross coefficient of TCSR and DID is significantly negative, indicating that TCSR enhanced the resource crowding-out effect of ETR. In this regard, hypothesis 2b is supported.
Robustness Tests
Excluding Other Policies’ Interference
In 2014, the Ministry of Environmental Protection of China and 31 provinces (autonomous regions and municipalities directly under the central government) signed the “Air Pollution Control Target Responsibility” and passed the newly revised Environmental Protection Law. These government environmental protection measures have a direct impact on firms’ emissions, thus affecting firms’ GI decisions. Therefore, the sample interval was shortened to 2014-2020. The results of the new sample are shown in columns (1) and (2) of Table 4. The regression results do not change substantially, indicating that the baseline regression results are robust.
Table 4.
Excluding other policies’ interference.
On December 29, 2018, the General Office of the State Council of China issued a pilot work plan for the construction of “Waste-free Cities”. On April 30, 2019, the Ministry of Ecology and Environment of China announced 11 pilot projects to build “waste free cities”. In order to exclude the interference of this policy on the ETR’s effect on GI, the sample of pilot cities was deleted. The results of the new sample are shown in columns (3) and (4) of Table 4. The regression results do not change substantially, indicating the robustness of the baseline regression.
Placebo Test
Following Lu (2017)’s research [40], a non-parametric replacement test is employed to test both randomized events and randomly grouped placebo. To ensure the randomness of the counterfactual and reliability of analysis results, 500 random samples were carried out in this study. Fig. 2a) and 2b) plot the probability density distribution of green product innovation and green process innovation respectively, where the abscissa is the estimated coefficient value and the ordinate is the 𝐾𝑒𝑟𝑛𝑒𝑙 density of the coefficient distribution. The coefficients obtained by random sampling are mainly distributed around 0. Counterfactual tests have once again demonstrated the robustness of the benchmark regression.
Heterogeneity Analyses
The Chinese government has implemented a flexible emission tax system, allowing provinces to set tax standards based on national norms. Some regions impose high pollution tax standards, with Beijing as the ceiling. Across China, the mean per pollution equivalent of air pollutants was 3.96 with a variance of 3.32. The mean per pollutant equivalent of water pollutants was 3.55 with a variance of 3.70. Emission tax standards vary greatly in China, causing a significant gap in pollution costs for firms in different regions.
Table 5.
Differences in environmental tax standards.
Column (1) & (3) of Table 5 show ETR’s effect on green product innovation & process innovation in regions with high environmental tax standards, while Column (2) & (4) of Table 5 show its impact in regions with low standards. DID coefficients show that ETR has a stronger positive effect on green product innovation in regions with low emission tax standards (Column 1 & 2), whereas high emission standards may crowd out ETR’s green effect on process innovation (Column 3 & 4). Thus, high emission standards limit ETR’s positive effect on GI, while low emission standards enhance ETR’s green signaling effect, indicating that high emission tax standards have limited positive effect on GI.
Conclusions
The paper’s findings have important implications for research on environmental regulation and strategic GI. Firstly, the green signaling mechanisms of environmental regulation on GI are expanded. Secondly, the effect of government governance on GI is evaluated by focusing on EPT as a natural experiment. Thirdly, the paper expands the research on firms’ response to environmental regulation through multiple GI. Fourthly, the mechanism of ETR on GI is further discussed from the perspective of CSR, indicating that the effect of ETR on GI is enhanced under the drive of CSR. CSR amplifies the green signaling effect and resource crowding-out effect of ETR on GI, indicating that environmental regulation external drive plays a stronger role in GI under the driving force of CSR.
The key implication for policy and practice is that policies affect enterprise behavior in many ways and firms will respond according to different mechanisms of government policies. To enhance environmental governance, policy effects must be assessed, and appropriate measures taken. Firstly, ETR boosts firms’ green product innovation but high tax rates have crowded out green innovation resources, so an appropriate tax rate should be set. Secondly, ETR has a crowding-out effect, so the government should supplement GI resources with environmental tax and other regulatory measures. Thirdly, government should adopt other measures to target ownership heterogeneity and environmental investment to improve governance. Fourthly, firms can respond to ETR by increasing green product innovation and decreasing green process innovation.
Responsible enterprises also need sufficient resources to respond to policy changes. This research innovatively studies the response of enterprises to government governance through different green innovations from the CSR perspective. The response of enterprises to government policies from the perspective of corporate competence can be further explored in the future.

