


Introduction
A review of the available research literature reveals that a multitude of anthropogenic activities within the lake catchment area (LCA) and lake water body have resulted in the degradation of the lake environment [1-6]. A variety of human activities, including agriculture, plantations, livestock, industry, tourism, and power plants, have collectively contributed to the degradation of the lake environment, particularly in terms of eutrophication and siltation [7-10]. The silting process occurs due to land clearing and processing activities, which in turn create erosion [11- 13]. In addition, the contamination of lake water is a consequence of the discharge of waste from a multitude of sources, including settlements, agriculture, fisheries, plantations, cattle, industry, tourism, mining, and power plants, into rivers that ultimately flow into the lake [3, 14-16].
The waste is subjected to dilution and decomposition during its transit through the river and on land. The dilution process occurs in all forms of waste, whereas the decomposition of organic matter produces nutrients as a byproduct [17]. Biodegradable organics facilitate the decomposition of organic waste as it progresses from the LCA to the lake water body, thereby converting it into nutrients. This behavior gives rise to the assumption that when organic waste from the LCA enters the lake water body, a portion of it has undergone conversion into nutrients, while the remainder enters as organic matter to be decomposed at a later stage. In the meantime, community activities in water bodies that generate a considerable quantity of organic waste include fish farming with floating net cages (FNC), which are typically situated in coastal waters [18-20]. Fish farming using FNC is a capital-intensive operation that generates a considerable amount of organic waste [21-23]. The FNC waste sinks to the bottom of the lake, causing the accumulation of silt [24]. The remainder of the waste mixes with the lake water as colloids, dissolved solids, and suspended solids, which are dispersed into the surrounding waters by the current.
During the dispersal phase, the biodegradable organic component undergoes decomposition into nutrients, while the remainder undergoes decomposition at a later point in time. Thus, nutrient waste from fertilizer residues and organic waste from LCA and FNC activities will become nutrient pollutants in lake waters, causing eutrophication [25]. Pollutants from LCA and FNC enter lake waters through their respective inlets on the lake shore in various forms, including dissolved, particulate, and colloidal. These forms can be recognized as total nitrogen and total phosphorus. Pollutants that are already present in the lake’s coastal waters will settle, while the remainder will move in conjunction with the movement of the lake water. It is hypothesized that variations in the form, volume, and concentration of pollutants entering coastal areas may result in differing water quality levels and eutrophication in coastal waters where pollutants reach lakes. To ascertain the veracity of this assertion, a study was conducted in Lake Batur, one of Indonesia’s largest lakes located on Bali Island that has experienced eutrophication due to the influx of organic waste and nutrients from activities in the catchment area (LCA) and the lake water body.
In the Bangli Regency, Batur Lake in Bali Province is a caldera formed by Mount Batur’s volcanic activity. It has a surface area of 1,591 hectares and an average depth of 50.8 m along its 21.4-km coastline. The lake has a volume of approximately 815.38 million m3, resulting from precipitation in its catchment region. As a closed endorheic lake, it has a single inlet, namely the Tukad Balingkang River, which collects water during the rainy season. The anthropogenic waste generated by activities in the Tukad Balingkang sub-watershed and along the lake’s coastline significantly impacts the lake’s water quality.
The aquaculture sector at Lake Batur, which employs FNCs, has expanded dramatically since its introduction in 1997. In 2018, the number of FNCs exceeded the maximum water-carrying capacity of 10,047 plots, totaling 11,837. However, the number of FNCs has grown to 18,768 by 2022 [26]. This has resulted in the production of organic waste and environmental problems in the lake water.
This study aims to better understand the impact of anthropogenic pollution sources on the biophysical chemistry of lake water pollutant dispersion and eutrophication levels. In order to achieve these objectives, this study will: (a) collate data on the sources and anthropogenic pollutant loads of Lake Batur. (b) Analyze the current biophysical chemistry of the lake waters, including the param of water transparency, water temperature, dissolved oxygen (DO), total suspended solids (TSS), and chlorophyll a. (c) Discuss the distribution of pollutant indicators, including COD, TN, and TP param. (d) The level of eutrophication will be analyzed.
Materials and Methods
Sampling Location
The present study was conducted at Lake Batur, where water quality was sampled and analyzed in nine SLs (Fig. 1). Table 1 describes the nine sampling locations, from 1 to 9. Furthermore, to ensure consistency in the discussion, SL 1, SL 2, and SL 3 are designated as west coast waters (WCW), SL 4, SL 5, and SL 6 as mid-lake waters (MLW), and SL 7, SL 8, and SL 9 as east coast waters (ECW).
Sample Collection and Storage
On March 24, 2024, water samples were collected for the purpose of analyzing their physical, chemical, and biological properties. The water samples were collected at 9 SL, which is defined as the water between the water surface and a depth of 3.3 m in the euphotic zone [27]. The euphotic zone (0-3.30 m) was calculated using the number of Secchi disk measurements multiplied by 2.3 [28]. The water in 9 SL was sampled using a 3.60-m-long PVC pipe with a three-inch diameter.
The methodology employed for collecting water samples is delineated in Garno et al. 2024 [26]. A total of 5 L of water was transported to the mainland for the purpose of collecting samples of chlorophyll a (Chl-a), total suspended solids (TSS), nutrients, total nitrogen (TN), total phosphorus (TP), and chemical oxygen demand (COD). Chlorophyll a, TSS, and nutrients were collected by filtering 250 mL of water using GF/C filters, which were used twice. The residue from the initial filtration was preserved as a Chl-a sample, the residue from the second filtration was retained as a TSS sample, and the filtrate from both filtrations was kept as a nutritional sample. TN, TP, and COD samples were prepared by separating 100 ml of water and acidifying it to a pH of less than 2. All samples were stored and transported in iceboxes and subsequently delivered to BRIN’s laboratory for further analysis.
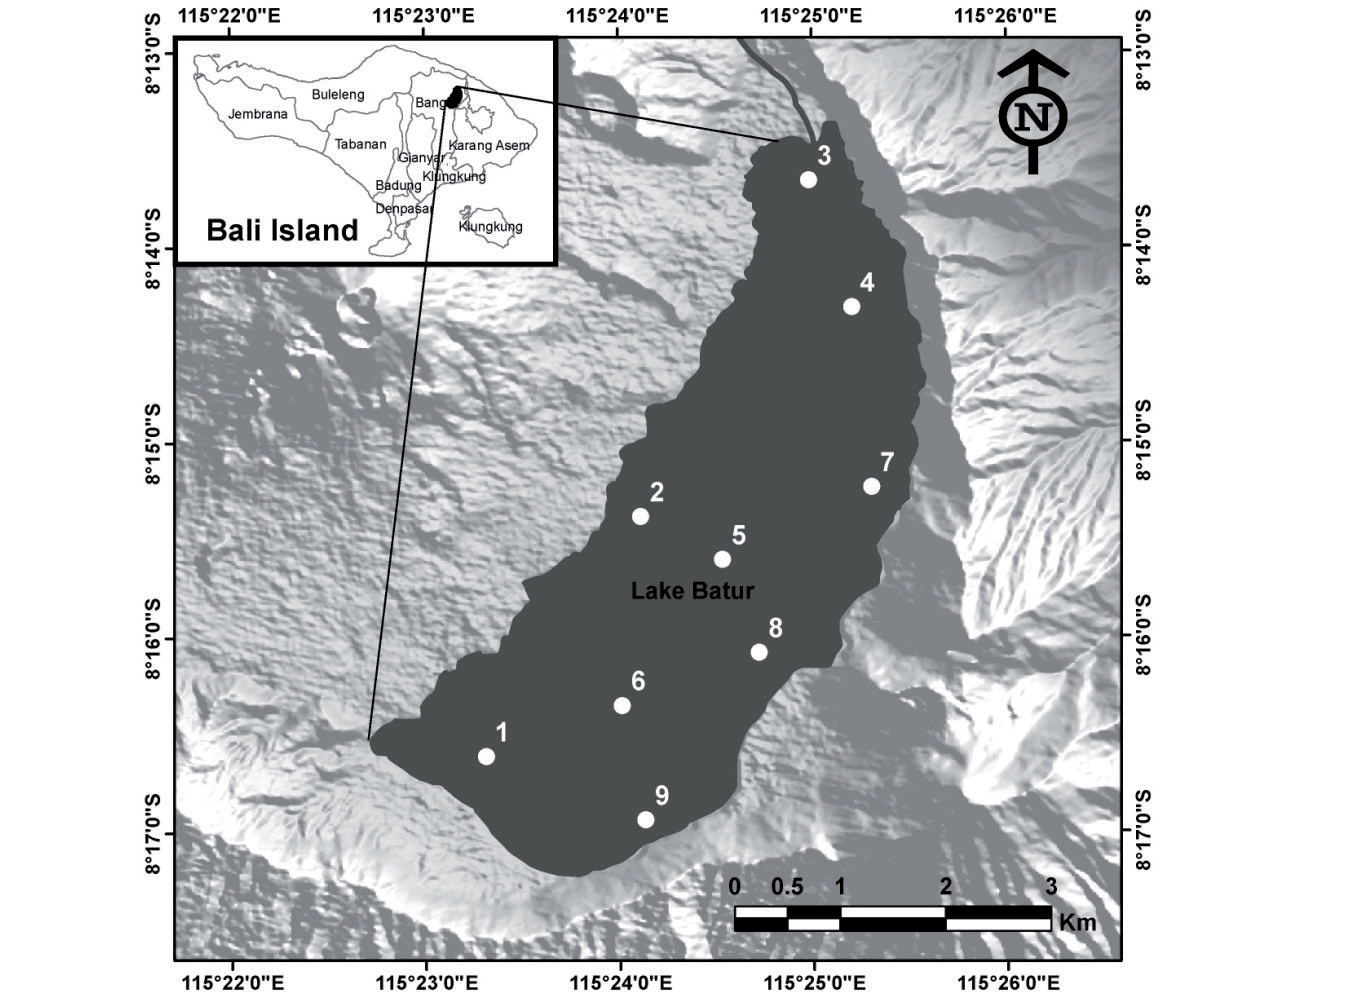
Table 1.
The sampling location (SL) in Batur Lake.
Measurement of Environmental Param
A Horiba U-50 multi-parameter water quality meter was employed to ascertain the temperature, pH, turbidity, conductivity, and dissolved oxygen levels in situ. Furthermore, a Secchi disk was employed to ascertain the transparency of the water. All measurements, with the exception of brightness, were taken at two distinct depth strata: 10 cm (surface) and 3.20 m (the border of the euphotic layer). Spectrophotometry was employed to ascertain the concentrations of nutrients, including ammonium-N, nitrate-N, nitrite-N, and orthophosphate-P, as well as total-N and total-P. The term “total suspended solids” (TSS) is defined in accordance with the Indonesian National Standard (SNI) No. 06-6989.3-2004 [29]. Similarly, the term “chemical oxygen demand” (COD) is defined in accordance with SNI No. 6989.72:2019 [30]. The concentration of chlorophyll-a (Chl-a) was determined through spectrophotometry.
The estimated potential pollutant loads (PPL) of the LCA activities, encompassing agriculture, households, livestock, and tourism, are discussed in detail in references [31, 32]. In order to estimate the PPL from FNC, we employed the following formula:
The emission factor utilized for FNC activities was identical to that employed by Widodo et al. [31], which entailed values of 76.68 g/m2/day for BOD, 14.96 g/m2/day for TN, and 4.15 g/m2/day for TP.
Determination of Trophic State
Trophic Status Index
The Trophic Status Index (TSI), developed by Carlson [33], was used to assess the level of eutrophication in Lake Batur. Carlson developed the TSI formula by combining Secchi depth transparency (SD), total phosphorus (TP), and chlorophyll-a (Chl-a) in the following Equation:
where TSI (SD) is the trophic status index based on Secchi disk transparency and SD is the Secchi depth (in m).
where TSI (TP) is the trophic status index based on total phosphorus, and TP is the total phosphorus concentration in milligrams per cubic meter.
where TSI (Chl-a) is the trophic status index based on chlorophyll a, and Chl-a is the chlorophyll concentration in milligrams per cubic meter.
where CTSI = Carslon trophic state index.
The CTSI levels were compared to the trophic state classification, with an index value of less than 40 indicating oligotrophic conditions, a value between 40 and 50 indicating mesotrophic conditions, a value between 50 and 70 indicating eutrophic conditions, and a value greater than 70 indicating hypertrophic conditions.
The Carlson Trophic Status Index (CTSI) is a recognized and effective method for evaluating the trophic status of lakes. It has been widely adopted because it combines user-friendly univariate analysis with the comprehensive accuracy of multivariate analysis [34-37]. The CTSI enables the determination of the water body’s trophic status, the dominant physical, chemical, and biological factors affecting it, and the presence and extent of nutrient limitation.
Results and Discussion
Sources and Loads of Anthropogenic Pollutants
Lake Batur has long been subjected to considerable quantities of waste, particularly following 2019, when the number of FNC (11,837 plots) exceeded the lake’s carrying capacity of 10,047 plots [26]. Meanwhile, Lake Batur is a closed lake with no outlet. Consequently, it is hypothesized that any pollutant entering the lake will settle at the bottom and disintegrate in the water [20, 38, 39]. In light of the considerable organic waste inflow, it is unsurprising that previous studies have identified accelerated eutrophication in Lake Batur, accompanied by evidence of mass fish mortality in the FNC [26, 32, 40].
Lake Batur receives waste input from both external (allochthonous) and internal (autochthonous) sources [40]. Allochthonous waste sources encompass activities within the LCA, including agriculture, domestic activities, tourism, and livestock [41]. In contrast, autochthonous waste sources pertain to activities within bodies of water, such as fish farming with FNC and tourist ports [42]. Table 2 illustrates the extent to which both polluting sources contribute to the waste burden in Lake Batur waters. The allochthonous pollutant load from the lake catchment area (LCA) is based on data provided by other researchers [31, 32], whereas the autochthonous load from the FNC is based on primary data.
Table 2 illustrates that Lake Batur receives allochthonous and autochthonous waste in the form of 14,776 tons of COD, 1,586 tons of N, and 461 tons of P per year. With a lake volume of 815,380,000 m3, each liter of Lake Batur water receives 18.12 mg of organic matter, 1.95 mg of nitrogen, and 0.57 mg of phosphorus. It can be seen that the autochthonous waste from FNC activities appears to be the dominant source of waste entering the lake waters, with the COD parameter from FNC at 74.4%, the N-total at 86.6%, and the P-total at 85.6%. The remainder of the waste entering the lake waters is thought to be the result of LCA activities. The majority of allochthonous waste from LCA activities is generated by agriculture, accounting for up to 15.5% of COD, 7.7% of TN, and 13.8% of TP. In contrast, other activities contribute to a lesser extent, with waste inputs of less than 6%.
The waste, which consisted of organic matter as COD (18.12 mg/L/Y), TN (1.96 mg/L/Y), and TP (464 mg/L/Y), reached Lake Batur in two ways. Firstly, the waste from LCA, via Tukad Balingkang, ditches, and canals, reached the lake’s coastal waters. Secondly, the waste from FNC reaches the coastal waters where the FNC is located. Therefore, the distribution of the effluent entering the shore of Lake Batur is not uniform, which raises the possibility that the impact on the coastal waters where the effluent enters is inconsistent. Fig. 1 illustrates the presence of nine SLs in Lake Batur, with six distributed along the coastline and three in the lake’s central region.
Table 2.
Pollutant load from anthropogenic activities entering Lake Batur.
The six SLs, three of which are situated in west coast waters (WCW) (SLs 1-3) and three of which are located in east coast waters (ECW) (SLs 7-9), are geographically proximate to the points of entry for allochthonous and autochthonous contaminants. Table 1 illustrates the diverse range of pollutant sources in WCW, including 7,140 plots from FNC, 7,741 settlers, and 4,818 hectares of used land. ECW identified pollution sources including 11,047 FNC plots, 21,983 settlers, and 4,818 hectares of used land. In contrast, the remaining three SLs (SLs 4-6) are situated in the mid-lake waters (MLW), which are situated at a considerable distance from the pollutant source. Table 3 presents the results of the pollutant load calculations for WCW and ECW, derived from the data presented in Fig. 1 and Table 2. As indicated in Table 3, the WCW receives an estimated 6,570.1 tons of COD, 644.3 tons of TN, and 188.2 tons of TP annually. In comparison, the ECW receives approximately 8,205.9 tons of COD, 941 tons of TN, and 272 tons of TP. It is evident that the eastern coastline receives a greater quantity of effluents (in terms of COD, TN, and TP) than the western coastline. The following section will examine the impact of varying effluent inputs to the ECW and WCW on water quality, pollutant distribution (specifically, COD, TN, and TP), and trophic status in the nine SLs.
Biophysicochemistry of Lake Batur Waters
The present study was conducted in the euphotic zone of Lake Batur, which is the water layer between the surface and a specific depth that receives less than 1% of solar energy [27]. Photosynthesis occurs in the euphotic zone, with a water transparency value of 2.3 times that of a Secchi disk [28]. At the time of the investigation, the average water clarity in Lake Batur was 1.39 m, indicating that the euphotic zone was approximately 3.20 m thick.
The transparency of Lake Batur’s waters in the nine study sites exhibited variability, with measurements ranging from 1.30 to 1.45 m. This variance in transparency across the nine sites can be attributed to the presence of pollutants from the surrounding community that have penetrated the waterways. It seems that differences in the input of pollutants from community activities into the waters have resulted in variations in the concentrations of TSS, nutrients, Chl-a, and COD in these waters (Table 4). The observed differences in transparency, TSS, and chlorophyll-a between the SLs suggest that the level of fertility (trophic state) may vary. A review of the existing literature reveals that the range of transparency observed in this study is narrower than that reported in earlier investigations conducted in the same six SLs. In May 2011, the transparency of the six study sites (SL) varied from 1.20 to 1.90 m [43]. In February 2014, it ranged from 1.75 to 2.40 m [44]. The observed variation in transparency over time suggests an increase in the fertility and productivity of Lake Batur.
Nitrogen and phosphorus are essential nutrients for phytoplankton growth via photosynthesis [45-47]. In aquatic environments, nitrogen can be classified as either organic or inorganic. Inorganic nitrogen is comprised of three primary forms: nitrite-N, nitrate-N, and ammonium-N. Of these, the latter two are particularly readily absorbed by phytoplankton. In addition, there are two distinct categories of phosphorus: organic and inorganic. Orthophosphate represents a form of inorganic phosphorus that phytoplankton can utilize. Phytoplankton utilize inorganic nitrogen in the forms of nitrate-N and ammonium-N, as well as inorganic phosphorus in the form of orthophosphate, during photosynthesis to produce biomass and dissolved oxygen. Therefore, it is evident that the nutrient concentration values obtained throughout the investigation represent residual concentrations. The concentration of nitrite-N in 9 SL was found to be consistently low, with a range of 0.001 to 0.002 mg/L. Nitrite-N is a labile nitrogen compound that can be readily oxidized in the presence of sufficient dissolved oxygen. Therefore, the low nitrite-N concentration in 9 SL is presumed to result from the elevated dissolved oxygen levels, which consistently oxidize existing nitrate-N to nitrate-N. Table 4 illustrates that the dissolved oxygen levels in 9 SL ranged from 8.82 to 9.39 mg/L at the surface and 7.25 to 9.18 mg/L at a depth of 3.30 m.
Table 3.
Distribution of sources and types of pollutants.
The nitrate-N produced by the oxidation of nitrite-N contributed to the existing nitrate-N concentration, resulting in a tendency for the nitrate-N concentration in 9 SL to be higher than the nitrite-N concentration in the same SL (0.025-0.314 mg/L). Conversely, nitrite-N concentrations were typically low (Table 4). The phytoplankton approach to nitrogen utilization suggests the potential for elevated nitrate-N concentrations in water bodies. Previous publications demonstrated that in freshwater systems with elevated nitrate-N and ammonium-N concentrations, phytoplankton prefers ammonium-N uptake over nitrate-N uptake [48-51]. Nitrate-N concentrations tend to remain high because phytoplankton have not yet utilized them.
The concentration of orthophosphate in each SL is typically less than 0.005 mg/L, with only SL 1 exceeding this threshold at 0.015 mg/L (Table 4). Orthophosphate is the dissolved phosphate fraction rapidly utilized by phytoplankton for photosynthesis [52]. The residual ortho-P concentration in SL 1 (0.015 mg/L) was higher than in other SLs, potentially due to phosphorus residual fertilizer input from the land above, which is both agricultural and residential [53, 54]. It is hypothesized that the deficit in ortho-P is a consequence of active photosynthesis in the euphotic zone. This hypothesis is supported by observations indicating that dissolved oxygen concentrations in the euphotic zone are relatively high, ranging from 7.25 to 9.82 mg/L (Table 4). The greater the intensity of the photosynthetic process or the higher the level of phytoplankton development, the greater the production of DO.
Chlorophyll-a is a measure of the density of phytoplankton engaged in photosynthetic processes within aquatic ecosystems [55-57]. It is one of the criteria used to determine the fertility of aquatic ecosystems. A number of other factors, including temperature, salinity, pH, dissolved oxygen, flow, nitrate, and phosphate levels, have been demonstrated to exert an influence on chlorophyll concentrations in water. It has been demonstrated that human activities exert an influence on the concentration of Chl-a in water bodies [58], indicating that a range of factors contribute to this phenomenon. Table 4 illustrates that the concentration of Chl-a in the nine SLs exhibited notable variation at the time of the study. The highest concentration of Chl-a was observed in SL 8, reaching 7.66 µg/L, while the lowest concentration was recorded in SL 2, at 2.66 µg/L. As documented in the extant literature, the concentration of Chl-a in the 6 SL waters of Lake Batur ranged from 3.65 to 5.71 μg/L in May 2023 and from 3.69 to 9.45 μg/L in October 2022 [32]. Over time, the observed variation in Chl-a concentrations indicates that Lake Batur’s productivity and trophic status have remained stable over the past three years. The disparate concentrations of Chl-a among the nine SLs in this study indicate that primary production in the nine SLs is heterogeneous, thereby suggesting that the trophic status is also likely to be disparate. In fact, the cause of the differences in primary production among the nine SLs can be attributed to variations in nutrients, SD, and TSS. However, Table 4 demonstrates no positive correlation between Chl-a and nutrients, SD, and TSS.
Table 4.
The physicochemical and biological characteristics of Lake Batur’s water at the time of the survey.
The initial hypothesis posited that the discrepancy in Chl-a between SLs was attributable to disparities in nutrient provision from pollutant sources. This assumption was subsequently demonstrated to be erroneous, as chlorophyll levels in the MLW were found to exceed those in the WCW (Table 4). It is crucial to acknowledge that the MLW (SL 4-6) is located in the central region of the lake, a significant distance from the source of pollution. Table 4 demonstrates that the concentration of Chl-a in SL 4-6 is greater than that in SL 2 and SL 3, yet it is less than that in SL 7-9 in the WCW. In accordance with the projected volume of effluent entering the water, the concentration of chlorophyll in SL 4-6 should be less than that of SL 1-3 and SL 7-9 (MLW < ECW < WCW). It is postulated that this phenomenon occurs as a consequence of the movement of effluent from the periphery to the center of the lake by the prevailing water current. The higher concentration of effluent in the ECW results in a more pronounced effect, leading to a greater MLW than the WCW.
The introduction of allochthonous waste from LCA and autochthonous waste from FNC into lake waters has been demonstrated to result in an increase in the concentration of OM, TN, and TP in the surrounding waters [59]. In this study, organic matter is represented by the COD value. The COD value represents the quantity of oxygen necessary to degrade all organic matter present in a given water sample [60, 61]. In the field of water research, COD is employed as an indirect indicator of the total quantity of organic matter or oxidizable pollutants present in a given water sample [62].
The organic matter present in water is composed of OM derived from photosynthesis (algae biomass) and other forms of OM, including detritus. Table 4 illustrates the variation in COD across the nine sampling locations, with the highest value observed in SL 8 (21.5 mg/L) and the lowest in SL 1 (5.28 mg/L). It is postulated that the disparity is attributable to differences in fertility levels and the availability of organic waste from polluting sources in the vicinity of the LS. Table 4 illustrates that the ECW exhibited a higher concentration of OM than the WCW and MLW. As anticipated, the highest OM concentration was observed in ESW. However, WCW exhibited a lower OM concentration than MLW, which was unexpected. This phenomenon is analogous to the Chl-a distribution, in which concentrations are higher at sites without pollution sources than at sites surrounded by pollutant sources. As with Chl-a, the high concentration of OM in MLW can be linked to the current that transports OM from the shore to the lake’s center.
In this study, the term “COD” represents the total OM, whereas the term “Chl-a” represents the OM derived from photosynthesis, specifically the biomass of algae. The concentration of Chl-a in a body of water serves as an indicator of its fertility, with higher concentrations generally corresponding to higher degrees of productivity [63-65]. Accordingly, the higher a water body’s Chl-a/COD ratio, the higher its level of fertility. Fig. 2 depicts the Chl-a/COD ratio in the nine SLs. In Fig. 2, it can be seen that the Chl-a/COD ratio is highest in SL1 and lowest in SL 5. This indicates that the most productive water site in Lake Batur is SL 1, situated in the WCW, and SL 5, located in the lake’s center (MLW), is the least productive.
A further point of interest is the discrepancy between the waters with the lowest production (SL 5) and those with the highest production (SL 1) in terms of their respective COD levels. It should be noted that the COD is composed of OM derived from photosynthesis (algal biomass) and other sources of OM [66]. Consequently, the conjunction of low productivity and elevated COD in SL 5 waters indicates that detritus constitutes the predominant form of organic matter. In contrast, the most productive SL 1 waters exhibited low COD levels, indicating that the OM in SL 1 was predominantly composed of living algal biomass (Chl-a). Another component of OM is detritus [67].
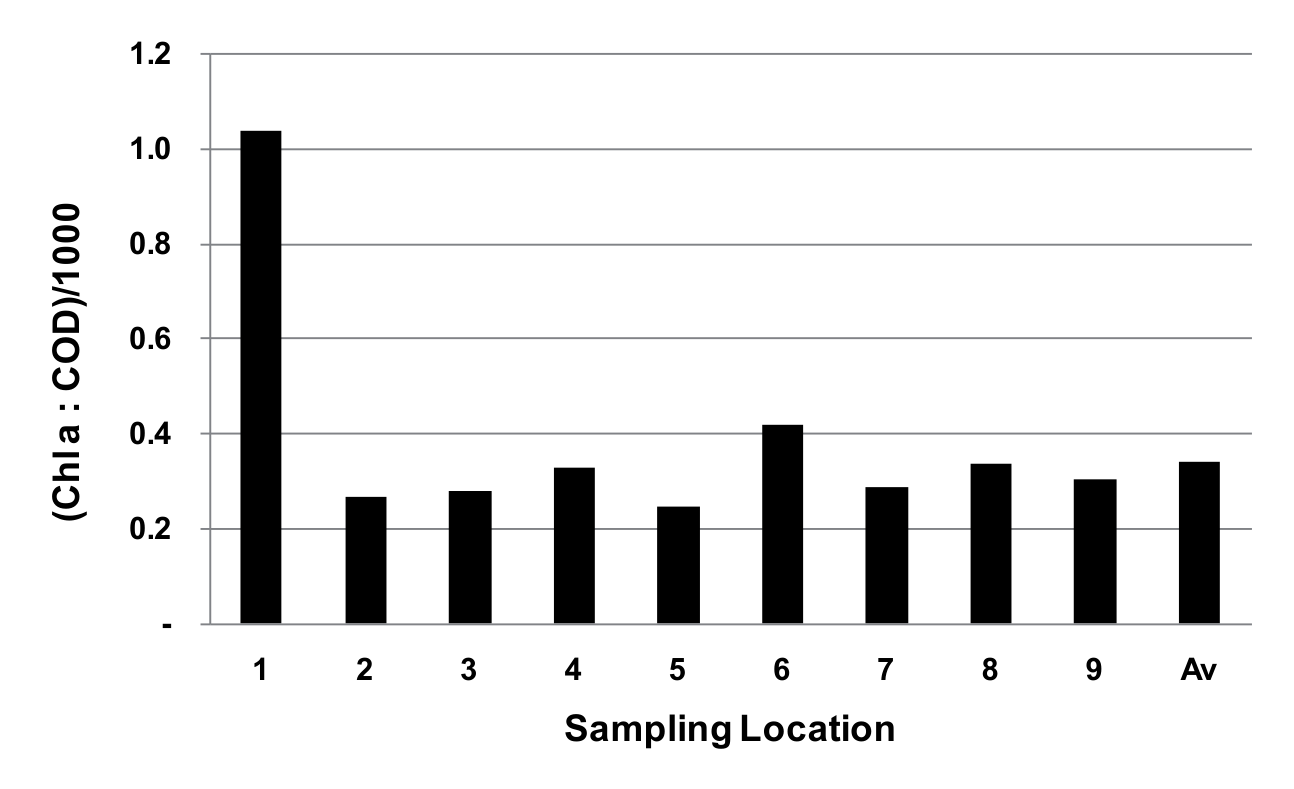
A high Chl-a/OM ratio is indicative of not only a high Chl-a concentration in the water but also a low detritus content. Accordingly, Fig. 2 indicates that SL 5 had the highest detritus concentration and SL 1 had the lowest. The discovery of the highest detritus concentration in SL 5 waters, which are not in proximity to any direct pollutant sources, and the lowest in SL 1, which is surrounded by a multitude of pollutant sources, gives rise to significant concerns and necessitates further investigation. The sole hypothesis that can currently be put forth is that the stream of Lake Batur has gradually transported detritus (pollutants) from the shore to the lake’s center.
Distribution of Total Nitrogen and Total Phosphorus
Nitrogen and phosphorus are the primary nutrients for phytoplankton [47, 68, 69]. An increase in N and P concentrations invariably leads to enhanced phytoplankton productivity, which in turn gives rise to an expansion in secondary production, including zooplankton and fish. Up to this point, the surrounding community has typically supported eutrophication, given that an increase in secondary production, particularly fish, is highly valuable for them. Regrettably, a sustained increase in nitrogen and phosphorus nutrients will facilitate the proliferation of existing aquatic flora, including water hyacinths, grasses, and phytoplankton [70-73]. One of the most deleterious consequences of eutrophication is the formation of algae that are typically dominated by blue-green algae [74, 75]. These algae are characterized by a slimy texture and an unpleasant, rancid odor and are unsuitable for consumption by zooplankton and fish. Some species are even toxic [76-78]. Following an algal bloom, algae will die due to nutrient depletion [79], which will then result in a period of oxygen depletion. This is because the breakdown of dead algae necessitates a considerable amount of dissolved oxygen. Oxygen depletion can potentially kill fish in the lake [80, 81]. Consequently, it is essential to consider the impact of excessive nitrogen and phosphorus concentrations in lake waters [82, 83].
Table 5.
Water quality assessment according to CTSI.
In general, water contains both organic and inorganic nitrogen [84]. This study assessed total nitrogen (TN) and inorganic nitrogen (TIN), which is the sum of nitrite-N, nitrate-N, and ammonium-N. Table 4 illustrates that the highest TN concentration was observed in SL 8, at 0.73 mg/L, while the lowest TN concentration was observed in SL 9, at 0.12 mg/L. It is presumed that the notable discrepancy is attributable to a differential in wastewater discharge from proximate community activities. At the outset of the discussion, it was proposed that the inorganic nitrogen (IN) detected in this study represents the IN that phytoplankton did not utilize for photosynthesis. It is important to note that, despite being residual, the proportion of IN is still relatively significant, ranging between 19 and 56% of TN. This is markedly distinct from the phenomenon observed when the concentration of phosphorus increases.
Similarly, phosphorus (TP) in water is composed of organic phosphorus (OP) and inorganic phosphorus (IP). This study aimed to determine the concentrations of total phosphorus (TP) and inorganic phosphorus (IP). Table 4 illustrates the composition of total phosphorus (TP), inorganic phosphorus (IP), and organic phosphorus (OP) in nine surface layers (SLs) of Lake Batur. Table 4 also illustrates that the concentration of total phosphorus (TP) in the nine SLs ranged from 0.023 to 0.036 mg/L, with the highest concentration observed in SL 5 (0.036 mg/L) and the lowest concentration observed in SL 6 (0.023 mg/L). Furthermore, Table 4 illustrates that the TP concentration, which ranged from 0.023 to 0.036 mg/L, exhibited a relatively low IP concentration, comprising only a small portion of the TP in the majority of samples (9-20%), with an average of 13%. This phenomenon is markedly distinct from the IN concentration, which, with the exception of SL 2 (9%), was found to range from 37 to 56% with an average of 47%. This observation gives rise to the hypothesis that element N is sufficient, whereas phosphorus is deficient. In other words, it can be stated that the availability of phosphorus limits the growth of phytoplankton in the 9 SLs in Lake Batur.
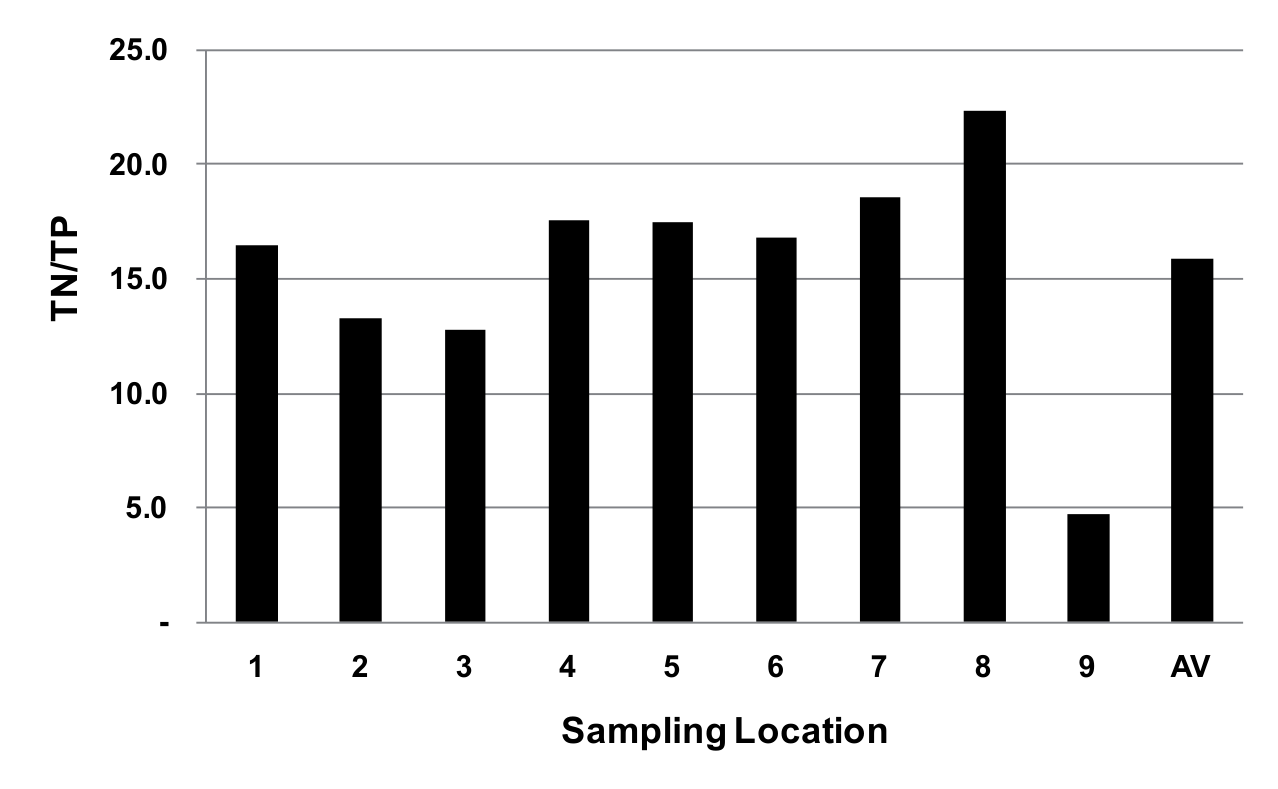
The ratio of nitrogen to phosphorus concentration is a common metric for evaluating the limiting factor of water fertility [85, 86]. According to Jorgensen, a water’s N/P ratio of less than 12 indicates that N is the limiting factor, whereas a ratio greater than 12 indicates that P is the limiting element [87]. As illustrated in Fig. 3, the nitrogen/phosphorus ratio in the 9 SLs of Lake Batur ranges from 4.8 to 22.3, with an average value of 15.9. The TN/TP ratio in SL 9 was found to be less than 12, while the remaining eight SLs exhibited ratios that exceeded 12. This observation suggests that, with the exception of SL 9, the availability of element P is a determining factor in the nutrient content of the waters within Lake Batur.
Trophic Status
The eutrophication of Lake Batur waters in the 9 SLs can be attributed to the influx of pollutants from anthropogenic activities in the LCA and FNC [88, 89]. Given the diversity of sources of pollutants that deliver pollutants to the 9 SLs, it is reasonable to conclude that the trophic status in the 9 SLs varies. Table 5 illustrates the trophic status of the waters in the nine SLs, as estimated using Carlson’s formula [33]. TSI values for all param (Chl-a, TP, and SD) were expected to be identical. However, due to the presence of numerous obstacles in the process of equalizing the SD and TP parameter values to the algal biomass parameter (Chl-a), the TSI (TP) and TSI (SD) values exhibited discrepancies. As Carlson notes, in cases where TSI values differ, it is preferable to utilize TSI (Chl-a), given that chlorophyll serves as a direct estimator of algal weight [33]. The use of TP and SD as indirect measures related to algal biomass is limited by certain restrictions; consequently, they are employed solely for the purpose of establishing trophic state in instances where chlorophyll data are unavailable. Carlson put forth the notion of utilizing the divergence of one or more variables from chlorophyll as a means of identifying non-nutrient limiting factors and probable classification errors [90]. Carlson presented a table to analyze TSI value discrepancies (Table 6) [90]. In this research, the trophic condition (CTSI) of Lake Batur in 9 SL is represented by the biomass parameter [TSI (Chl-a)], and the deviation of variables is employed as a means of examining the underlying cause.
Table 6.
Conditions associated with differences between the Trophic State Indices.
Table 5 illustrates that, based on the TSI (Chl-a) value, eight of the nine SLs in Lake Batur are classified as eutrophic. Only one body of water, SL 2, is in mesotrophic conditions, with a TSI (Chl-a) of 49.2. The mesotrophic condition of SL 2 is inextricably linked to the fact that it has the lowest concentration of TP (Table 4) and TSI (TP). Table 5 illustrates that the TSI (Chl-a) value for SL 2 is less than that of TSI (SD) yet greater than that of TSI (TP). This can be expressed as TSI (TP)<TSI (Chl-a)<TSI (SD). As indicated in Table 6, the occurrence of TSI (Chl-a)>TSI (TP) suggests that phosphorus is the limiting factor for algae growth in SL 2 waters. The presence of TSI (Chl-a)<TSI (SD) suggests that non-algal particles exert a greater influence on lake water clarity. The discovery of a low TP concentration (Table 4) lends support to the hypothesis that phosphorus is the limiting factor in SL 2. It is postulated that the non-algae particles affecting transparency are organic materials that have been left over from the FNC around SL 2. Similarly, the phenomenon of TSI (TP)<TSI (Chl-a) <TSI (SD) was observed in the eutrophic waters ofSL 4. As evidenced by Table 4, SL 4 exhibits a greater TP content than SL 2, which is classified as mesotrophic. With higher TP concentrations, SL 4 is capable of producing more biomass (Chl-a), resulting in a TSI value that surpasses that of SL 2.
Conclusions
Discussion of the research results reveals that Lake Batur receives a considerable quantity of anthropogenic waste on an annual basis, including 14,776 tons of organic matter (COD), 1,486 tons of total nitrogen (TN), and 461 tons of total phosphorus. The primary source of these effluents was autochthonous effluents from FNC operations, which constituted 74.4% of the COD, 86.6% of the TN, and 85.6% of the TP. The distribution of effluents from community activities across the ECW, WCW, and LCW resulted in variability in the concentrations of total suspended solids (TSS), nutrients, chlorophyll-a (Chl-a), chemical oxygen demand (COD), total nitrogen (TN), total phosphorus (TP), and fertility levels in the nine LS. The Chl-a/COD ratio indicated that SL 1, situated in the ECW, exhibited the highest fertility, whereas SL 5, located in the LCW, demonstrated the lowest. The fertility level was constrained by phosphorus, as evidenced by a TP/TN ratio exceeding 12 in eight SLs. The Trophic Status Index (TSI) was calculated using Carlton’s formula, and the results indicated that, with the exception of SL 2, which was categorized as mesotrophic, the remaining eight SLs were eutrophic. Given that the Trophic Status Index TSI (Chl-a) is greater than the TSI (TP), it can be reasonably concluded that phosphorus is the limiting factor for algal development in seven of the nine SLs. The TSI (Chl-a) values for some SLs (SLs 2-4) were observed to be lower than the TSI (SD) values, indicating that non-algal particles may have exerted a greater influence on lake water clarity.
LCA = Lake Catchment Area
FNC = Floating Net Cages
DO = Dissolved Oxygen
TSS = Total Suspended Solids
Chl-a = Chlorophyll-a
COD = Chemical Oxygen Demand
TN = Total Nitrogen
TP = Total Phosphorus
TP/TN = Total Phosphorus/Total Nitrogen
OM = Organic Matter
SL = Sampling Location
IN = Inorganic Nitrogen
ON = Organic Nitrogen
IP = Inorganic Phosphorus
OP = Organic Phosphorus
WCW = West Coast Waters
MLW = Mid-Lake Waters
ECW = East Coast Waters
SD = Secchi Disk Transparency
TSI = Trophic Status Index
TSI (Chl-a) = Trophic Status Index (Chlorophyll-a)
TSI (TP) = Trophic Status Index (Total Phosphorus)
TSI (SD) = Trophic Status Index (Chlorophyll-a)
CTSI = Carslon Trophic Status Index
ln = Logaritma Natural
PPL = Potential Pollutant Loads
BRIN = National Research and Innovation Agency
PVC = Polyvinyl Chloride
GF/C filters = Whatman Filter Paper Grade
SNI = Indonesian National Standard

