

Introduction
Water pollution in urban rivers is serious in China. Eutrophication and other issues are prominent [1]. With the continuous expansion of urban scale, population growth, and rapid economic development, a large amount of domestic and industrial wastewater [2] containing nutrients has been generated. Human activities [3, 4] lead to excessive loads of nitrogen [5] and phosphorus in the lake water, which effectively act as “fertilizer” and affect water quality [6-8]. Eutrophication problems of lakes have harmed people’s living environment and physical and mental health. The basis for understanding the state of the water environment and water quality management is the assessment of reservoir water quality and eutrophication. The choice of a method for water quality assessment requires an individual approach to each water body [9]. Careful selection and implementation of appropriate assessment techniques are essential to provide a fair and accurate representation, serving as the basis for comprehensive water environment management plans.
Lake eutrophication has been thoroughly studied and yielded significant findings by researchers in China and other countries. The study falls into two main categories. Firstly, the term “lake eutrophication” [10] is defined by scholars as the maximum extent to which lake resources can be used for population, industrial, agricultural, and urban development at a given stage of socioeconomic development, all while maintaining the stability of social and ecological systems. This definition has been proposed and refined over time. Secondly, several researchers have undertaken quantitative investigations on lake eutrophication using a variety of models and techniques. There is also no shortage of scholars who have used enhanced and relevant models and algorithm methods to contribute to water resource management, water quality, and other related topics.
The water quality evaluation should be chosen from more comprehensive indexes and a more reasonable calculation method. Xu et al. [11] proposed fuzzy comprehensive evaluation (FCE) and the principal component analysis (PCA) were simulated to assess the water quality of the Nansi Lake Basin. The water quality of Nansi Lake Basin was relatively good, especially in spring and summer. Wang et al. [12] proposed a variable fuzzy set and the information entropy theory. The model was applied to assess the water quality status of Taihu Lake. Results show that the proposed model can determine the water quality level and provide an acceptable alternative based on optimized objectivity in determining the water quality level. Traditional methods for evaluation of eutrophication include the fuzzy comprehensive evaluation (FCE), principal component analysis (PCA), Neural Network (BP), set-pair analysis (SPA) [4, 13-18] and others. These methods apply under particular conditions and have certain limitations. Although these methods of eutrophication assessment are helpful, they do not systematically consider two uncertainties: randomness and fuzziness.
Set-pair-analysis (SPA) was a mathematical tool dealing with uncertain information. As a fundamental data mining method, it played an important role in many fields [19-22]. The approach of set-pair analysis has not been applied widely in lake eutrophication. Several recent advances have improved the reliability and efficiency of SPA. Gong et al. [23, 24] applied the set-pair analysis method [25-27] to water resources evaluation and management. Wang et al. [28] used an entropy-weighted SPA model to evaluate the water resource security of a city. There were still some obvious shortcomings due to the characteristics of the methods, such as the evaluation values being too close and the evaluation grades not being clear. A five-element connectivity [29] is introduced to improve traditional set pair analysis.
Cheng et al. [30] used the AHP and entropy weights combined to reduce the influence of subjective and objective single weights. The model provides a new idea for the study of groundwater geology. Zhao Jun et al. [31] applied the fuzzy hierarchical analysis process combined with the entropy weighting method to determine the objective and subjective weights of the evaluation indicators for a regional water security evaluation model for the Jiangsu region. To overcome the limitations of single empowerment on evaluation results. A new combined weighting fuzzy method [32] was proposed and applied to the comprehensive evaluation of regional water resources security in China. The combination [33] of both subjective and objective approaches to determine the weights can complement each other and make the evaluation results more realistic and credible.
Lake eutrophication requires a more effective evaluation and management strategy. We applied the lake composite weighting approach and the fuzzy set pair analysis clustering assessment method. This method would allow us to more correctly determine lake eutrophication and evaluate each lake based on its nature and health.
The study aims were as follows: (1) to develop a eutrophication evaluation approach that takes into account the uncertainties of monitoring data, by providing more meaningful information for eutrophication control and prevention. (2) To apply the developed methodology to the assessment of the eutrophication status of representative lakes and validate the method. This paper used the combination of the subjective weight of the accelerated genetic analytic hierarchy process and the objective coefficient of variation method. Compared with the traditional analytic hierarchy process, the accelerated genetic algorithm introduces the optimization function of the genetic algorithm to solve the limitations and shortcomings of AHP. Compared with the traditional set pair analysis, the combination of fuzzy clustering and set pair analysis overcomes the randomness of the uncertainty coefficient, and fully considers the fuzziness of the grade standard boundary.
Experimental Procedures
The Principle of SPA
The lake eutrophication evaluation requires consideration of a complex set of factors with uncertain values. We introduce the correlation degree to express the uncertainty of the system and to quantify and identify the uncertainty. Let set pair H = (X, Y) be composed of set X and Y. The set pair H could be separated to obtain N characteristics, in which, X and Y share the opposite number of characteristics S and P, and the remaining characteristics are F, which can be expressed using the following Equation (1):
where μ is the connection degree between sets X and Y. n represents the total number of attributes in the set pair. S stands for the same characteristic number of a set pair analysis. The number of contradictory attributes is P. The characteristic number of sets X and Y is denoted by F. The same degree, difference, and opposite degree of sets X and Y are denoted by the characters S/n, F/n, and P/n, respectively. The sets X and Y include the identity degree, discrepancy degree, and contradictory degree. i is the discrepancy coefficient with an unknown value between -1 and 1. i stands for the transformation of the degree of ambiguity and certainty. With a value of -1, j represents the coefficient of the opposite degree. Concurrently, the essential components of SPA are the discrepancy coefficient (i) and connection degree (μ). i and j are indicators of the degree of antagonism and ambiguity surrounding differences. If we assume that a = S/n, b = F/n, and b = P/n, then the degrees of similarity and difference and uncertainty are represented by a, b, and c, respectively. Equation (1) can therefore be made simpler as:
where a, b, and c all satisfy the normalization condition, namely, a + b + c = 1. The difference b in Equation (2) is unclear, while the similarity a and the difference c are certain, according to SPA. The aforementioned quantitative analysis and the size relationship between a, b, and c can be used to assess the lake’s quality.
Fuzzy Set Pair Clustering Assessment Method
The fuzzy set-pair clustering assessment method (FSPCAM) is an extension of the set pair analysis method. For instance, the state space in which the research item is located is divided into three sections by the connectedness Equation (2). While this is highly accurate for a large number of problems, there are significant drawbacks. As such, the connection Equation (2) can be examined under various circumstances and at various levels. For example, if b is further subdivided, Equation (2) can be expanded to:
and when k = 5, Equation (3) may be written as:
Meanwhile a + b1 + b2 + b3 + c = 1, i1 ∈ [0,1], i2 ∈ [0,1], i3 ∈ [–0,1], j = 1; i1, i2, i3 and j are used as markers in cases where their values are ignored. Meanwhile, a, b1, b2, b3, and c are respectively referred to as similarity, positive difference, negative difference, and opposite. The subsequent Equations (7)-(8) give the five-element connectivity and, in similar fashion, the n (n = 7, 8)-element connectivity degree can be obtained. Let the set A of the evaluation sample and the level 1 evaluation standard of all indicators be set B, then the five-connection number of set A and B is
Where: ωl is t index weight; al is the contact degree value of t index. Contact Degree of Each Indicator μl. The value can be used to determine the current level of this indicator. Equations (7)-(8) are incorporated into Equation (5), and the contact degree value of each indication determines the total number of indicators on the upper level, resulting in total lake eutrophication. The contribution of each indicator to the degree of linkage varies, and different weights can be assigned.
The following confidence criterion is defined:
Where
The Equation for calculating the number of contacts for evaluation indicators is as follows: For a smaller and better indicator, the correlation expression of the measured index value of each evaluation indicator is relative to the evaluation grading standard. For a smaller and better indicator, the five-element connectivity degree can be described as follows:
(7)
where Xl indicates the measured index value of the water quality in each sampling point that needs to be evaluated, and Al and Bl denotes the m sampling point to be evaluated and the k evaluation index, separately. Where, s1, s2, s3, s4, and s5 represent the limit standard values of Class I, II, III, IV, and V water quality, respectively.
For the larger and better indicator, the five-element connectivity degree can be described as follows:
Weighting Method
The evaluation findings are obtained using several indicator weights with considerable variances. The weight of the index directly influences the overall evaluation outcomes of many indicators. As a result, it is critical to properly relate the indications to the significance of the data. The evaluation findings produced by the related processes yield weights that differ significantly when generated by different weighting methods. Thus, the proper weighting method category should be chosen based on various circumstances. The assignment of the variable index of the water sample is determined by taking into account both the subjective nature of the expert experience and the objectivity of the chemical element properties in the lake. Thus, we build an empowering algorithm that combines objective and subjective weighting methods (each with 1/2.) to discover a fair way to meet the specific needs of lake eutrophication while assigning values to the lake variable index.
Analytic Hierarchy Process (AHP)
The analytic Hierarchical Process is a widely used comprehensive analysis method, its advantages being systematicity, simplicity, and practicality. In the context of the analysis hierarchical process, the subject under consideration is treated as a system, and decision-making proceeds through a process involving decomposition, comparison, judgment, and synthesis. It effectively integrates qualitative and quantitative aspects to address practical problems that may surpass the capabilities of traditional optimization techniques. Its applicability spans a wide range of domains, and it is characterized by its simplicity in calculation, producing clear results that are easily comprehensible and can be readily understood and applied by decision-makers. The main problem with the analysis hierarchical process is the consistency of the judgment matrix. The following are the precise steps in the AHP: (1) The target, middle, and index layers are the three tiers into which the study factors are divided. (2) To create a judgment matrix, the significance of every index in the index layer is compared pairwise. (3) Each index’s weight is determined. (4) To evaluate the reasonableness of each index’s weight, a consistency test of the judgment matrix is performed, and the random consistency ratio (CR) is computed. The judgment matrix’s outcome is deemed to have adequate consistency if CR<0.1.
AGA-AHP
A novel modeling technique called the Accelerating Genetic Algorithmic Hierarchy Process (AGA-AHP) Systematic Model was developed in order to successfully remove the subjective mistakes of the conventional analytic hierarchy process. This study presents a method to compute rank weights and simultaneously check the consistency of the judgment matrix in order to address the consistency issue of the judgment matrix in AHP. The accelerating genetic algorithm is a population-based evolutionary algorithm. Throughout the optimization process, the population of answers evolves to optimize the problem [34]. It is one of the intelligent optimization algorithms with the advantages of fast search, generality, and global search capability.
Using the consistency ratio (CR) as an optimization objective, the accelerating genetic algorithm analytic hierarchy process (AGA-AHP) approach can potentially accomplish the reduction target of standard AHP. The upgraded model may perform better when it comes to consistency rate optimization. Under the condition of guaranteeing the similarity between the original and optimized matrix, the approach may produce higher consistency and more reasonable evaluation matrix and weights because it preserves the limit of the searching range of the solution in the constraint requirements. Effective use of the analytic hierarchy process depends on the ranking weights of judgment matrices in AHP being calculated reasonably. AGA-AHP has the characteristics of substitution invariance, compatibility, symmetry, and complete coordination that a reasonable ranking method in the analytic hierarchy process should have [14]. It is directly based on the definition of the judgment matrix to derive the consistency index function that describes the degree of consistency of the judgment matrix. Steps:
(1) The analytic hierarchy process method based on the accelerating genetic algorithm (AGA-AHP), was used to determine the subjective weights of each forewarning index. The fuzz complementary judgment matrix can be defined as:
where bij is the relative importance between indices, i and j. It means that index j is more important than index i. Element bij indicates the relative importance of element Bi to element Bj in terms of the judgment criterion A. The C-level corresponding to the B-level element Bk of the judgment matrix is
(2) In practical applications, due to the fuzziness and complexity of the evaluation system and the diversity and instability of a person’s cognition, there is no uniform and exact yardstick to measure the importance of indices. Therefore, in practical applications, conditions that matrix A, given by the decision-maker, cannot satisfy with consistency, often occur.
The smaller the Equation (10) on the left, the more accurate the consistency of the judgment matrix. When Equation (10) is established, the judgment matrix is completely consistent.
Where CIF(n) is the Consistency Index Function. ωk is an optimized variable. The judgment matrix B is deemed to have sufficient consistency when the value of CIF (n) is smaller than a standard value.
(3) The preferred ranking of each decision-making scheme is established based on the total ranking weights (i = 1~m) of each element in the C layer. This gives decision-makers a scientific foundation upon which to make decisions and helps them select the best plan.
Variation-Coefficient Method
The variation-coefficient (VC) method can avoid equal division of weight and make results more reasonable. The weights were calculated using the coefficient of variation method with the following Equation:
Where CVj is the coefficient of variation of the j indicator, and σj, x̅ j is the standard deviation and mean value of the j indicator respectively. The method is a method of determining weights based on the principle of entropy, and the larger the entropy value, the larger the weight.
Combined Weight
There are many kinds of combinatorial weights, and there is no fixed selection criterion. The current combination weighting methods include addition weighting, multiplication weighting, range maximization, etc. Additive combination weighting is a method used in evaluating systems with multiple hierarchical indicators. It involves the aggregation of weights assigned to lower-level indicators within their respective middle-level indicators, and further aggregation of these middle-level weights within the overall system of higher-level indicators. This approach ensures that the relative importance of each indicator, regardless of its level in the hierarchy, is appropriately reflected in the final evaluation.
Where ωj is a subjective weight indicator and ωj is an objective weight indicator.
Results
Data Source
The terrain of China is high in the west and low in the east. Lakes are influenced by other factors such as topography. The Meng-Xin Plateau, Yunnan-Guizhou Plateau, Qinghai-Tibetan Plateau, eastern lowlands, and northeastern plains and mountains are the five natural distribution zones of China’s lakes. Twenty important lakes in China were selected for eutrophication evaluation, see Table 1.
Evaluation Indicators and Standards
Lakes are a complex system that is influenced by various factors such as society, economy, nature, and environment. Various factors have varying degrees of impact on lake eutrophication. The key to evaluation work is to scientifically and reasonably screen evaluation indicators and determine indicator evaluation standards. Five grades can be used to evaluate the eutrophication of lakes (1 to 5). The Quality Standard for Lake categorizes single-factor indices into five grades, and each index and assessment standard in the evaluation area is meant to be integrated. The assessment indices that meet or surpass the V-class standard and adhere to the I-class norm. See Table 2.
Table 1.
Sampling point data [35].
The construction of the comprehensive evaluation index system for lake eutrophication should involve selecting parameters based on the specific conditions of the study area. It is advisable to choose factors that authentically and objectively reflect the degree of lake water eutrophication from various perspectives and angles. Based on those considerations, the primary cause of lake eutrophication is an excessive rise in the nutrient content of the lake, particularly in nitrogen and phosphorus. Water bodies may become more eutrophic due to the physical index SD and chemical index CODMn. The concentration of total nitrogen (TN) and total phosphorus (TP) is a major factor in water eutrophication, which raises the level of Chl-a. The true nutrient status of various lakes cannot be reflected since the eutrophication index frequently overestimates or underestimates the overall nutrient status of lakes when examining a single indicator of lakes [1]. The traditional comprehensive eutrophication index evaluates national water quality using a common set of measures that may not adequately reflect the distinctive physical and chemical properties of every lake. This research ultimately resulted in the standard index system for evaluating lake eutrophication. It includes the characteristics of Chl-a, TP, TN, CODMn, and SD. The assessment standard index system is used to counteract the one-sidedness of a single-factor evaluation of eutrophication.
Table 2.
Evaluation criteria of lake eutrophication [35].
Evaluation of Lake Eutrophication Results
Finding the Average Connectivity
The connectivity of each evaluation index relative to each sample of lake eutrophication to be evaluated was calculated using Equations (7) and (8) as shown in Table 3.
According to the collected data, the data in Table 2 combined with the standard values of each indicator and the Equation (7) were used to calculate the connection degree of each lake. Taking Er Hai Lake as an example, the indicator Xl was defined as set Al, and the corresponding indicator level 1 was set Bl. The set pair H (Al, Bl) was constructed and the values of a, b1, b2, b3, and c were calculated. The standardized values of each index are obtained, as shown in Table 3, and transformed into the form of the comprehensive correlation Equation (5) through deformation, as shown in Table 4. Then, according to the AGA-AHP method and variation-coefficient method, the Equations (9-13) is used to calculate the weight, and the results are shown in Table 5.
As can be seen from Table 4, the eutrophication status of each lake sample is distributed in the range of Ⅲ to Ⅴ, in which the Erhai, Gaozhoushuiku, and Qionghai belong to the medium eutrophication (Ⅲ), Bositenghu, Dianshanhu, Yuqiaoshuiku, Guchenghu, Cihu, and Chaohu belong to the light eutrophication (Ⅳ), and the Dalih, Dianchiwaihai, Dianchicaohu, Xihu, Gantanghu, Moguhu, Moshuihu, Xuanwuhu, Jingbohu and Nanhu lake belong to the heavy eutrophication (Ⅴ).
Indicator Weighting Results
The calculation results of the AGA-AHP method show that the method highlights indicators such as Chl-a and weakens CODMn and TN. As a direct indicator of lake eutrophication, it is reasonable to highlight the importance of Chl-a. The comprehensive weight proposed synthesizes the information of subjective weights and objective weights in this paper, not only considering the direct impact of Chl-a on eutrophication, but also considering the impact of CODMn and SD on the environment, reflecting the comprehensive value of subjective weights.
Discussion
Discussion of the Rationalization of Evaluation Results
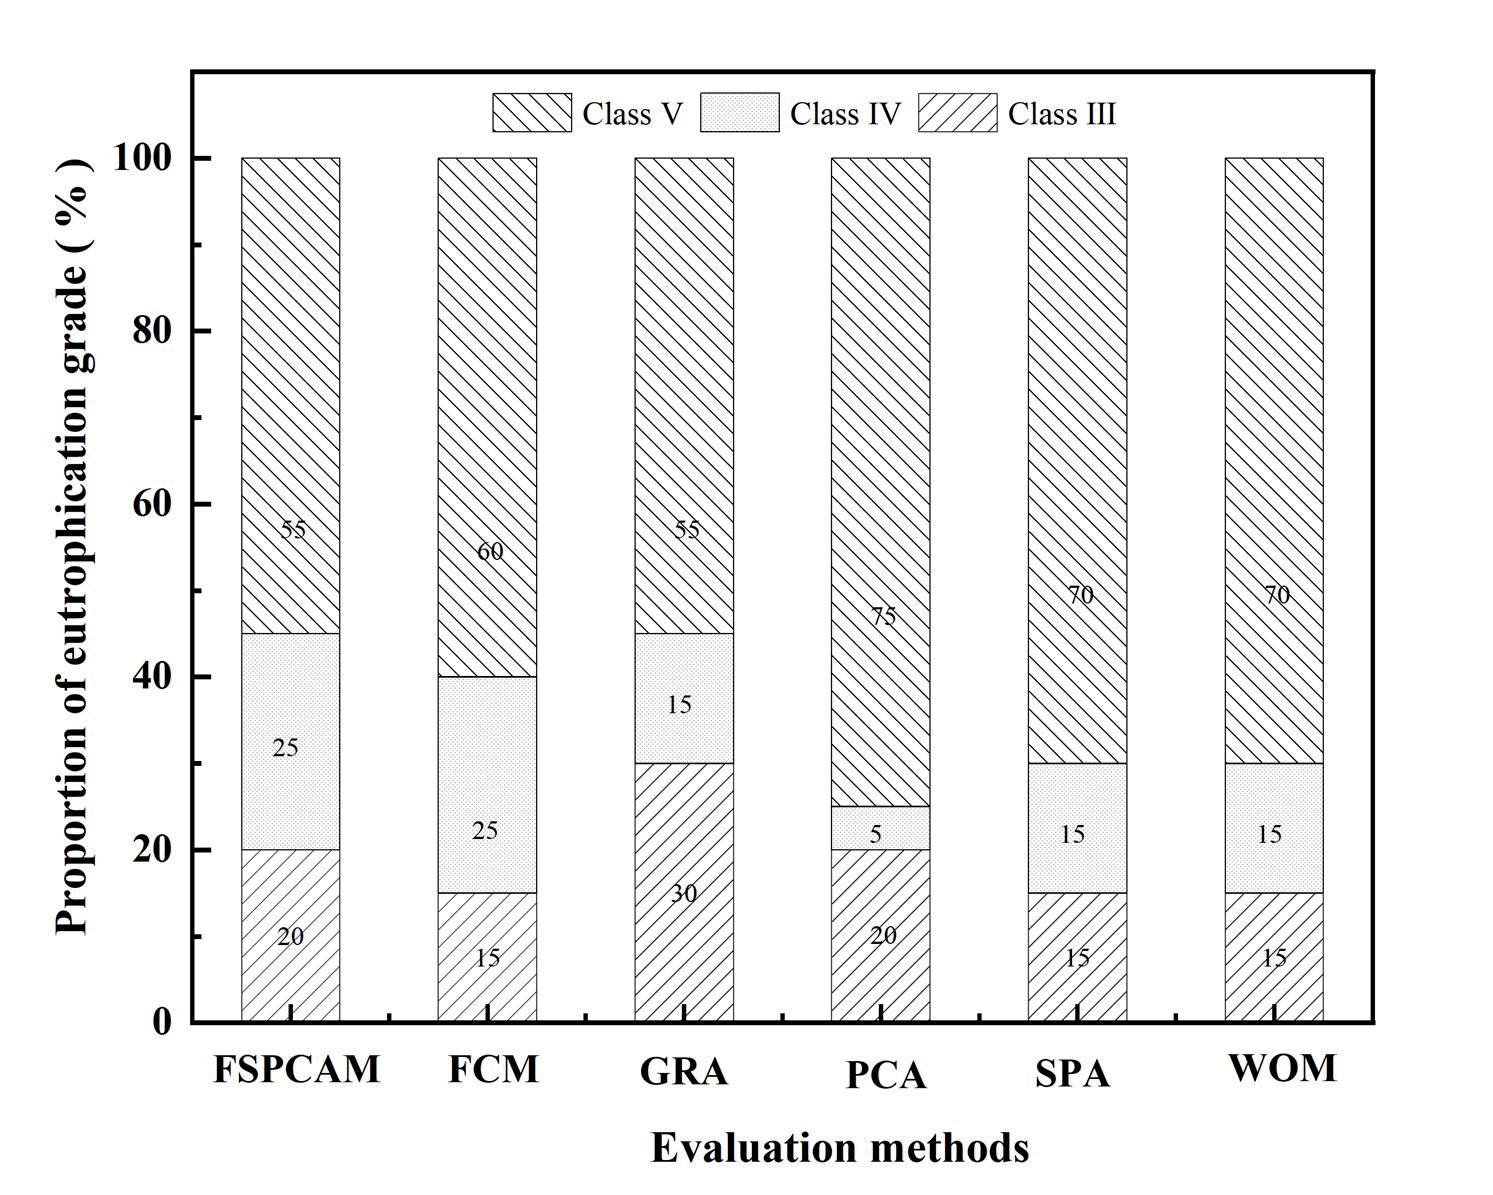
The evaluation of lake eutrophication is divided into five levels, namely I, II, III, IV, and Ⅴ. Class Ⅰ represents the least degree of eutrophication, with the increase of Class of lake eutrophication pollution degree gradually intensified, and Class V indicates the most severe eutrophication. The evaluation results of the fuzzy set-pair clustering assessment method, fuzzy comprehensive analysis method, grey correlation analysis, principal component analysis, set pair analysis, and weighted order method are shown in Table 6. The results of the six evaluation methods are relatively consistent, and there are obvious differences in some lakes. This may be attributed to the different evaluation principles and calculation models adopted by the six comprehensive evaluation methods.
From Fig. 1, the results of each evaluation method show that the proportion of heavy eutrophication and light eutrophication lakes in the water quality of the twenty lakes is relatively large, exceeding 50%. There is no Class I and Class Ⅱ, and the pollution is serious.
The evaluation results of the fuzzy comprehensive method are as follows: Erhai, Gaozhoushuiku, and Qionghai lake are in Class III; Bositenghu, Dianshanhu, Yuqiaoshuiku, Cihu, and Chaohu are in Class IV; Guchenghu, Nansihu, Dalihu, Dianchiwaihai, Dianchicaohu, Xihu lake, Gantanghu, Moguhu, Moshuihu, Xuanwuhu lake, Jingbohu, and Nanhu lake are in Class V. The uncertainty that exists in eutrophic evaluation is effectively resolved by this method, which gives distinct weights to several evaluation indices. However, it does not completely exclude the possibility of errors resulting from the choice of various evaluation indices.
The following are the outcomes of the grey relation analysis: Class IV results are for Guchenghu, Cihu, and Dianchiwaihai; Class V results are for Nansihu, Dalih, Chaohu Lake, Dianchicaohu, Xihu Lake, Gantanghu, Moguhu, Moshuihu, Xuanwuhu, Jingbohu, and Nanhu Lake. Erhai, Gaozhoushuiku, Bositenghu, Dianshanhu, Yuqiaoshuiku, and Qionghai are all in Class III. The results will be greatly influenced by the relative weights of each indication, and judgment is undoubtedly subjective. Consequently, it is imperative to enhance the scientific validity of index weight.
The results of the set pair analysis showed that the eutrophic state of lakes in the Erhai and Gaozhoushuiku Lake is Class III. The results of Bositenghu, Dianshanhu, Guchenghu, and Qionghai Lake are in Class IV. The lake status of Yuqiaoshuiku, Nansihu, Cihu Lake, Dalih, Chaohu Lake, Dianchiwaihai, Dianchiwaihai, Xihu Lake, Gantanghu, Moguhu, Moshuihu, Xuanwuhu, Jingbohu, Nanhu is in Class V. Insufficient information may lead to poor results. In addition, it is also crucial to consider how to effectively distinguish between similarity and dissimilarity.
The weighted order method results indicated that Erhai, Gaozhoushuiku, and Qionghai lakes are classified as Class III due to eutrophication. The results of Guchenghu, Nansihu, Cihu Lake, Dalihu Lake, Chaohu Lake, Dianchiwaihai, Dianchicaihu, Xihu Lake, Gantanghu, Moguhu, Moshuihu, Xuanwuhu, Jingbohu, and Nanhu Lake are in Class V. The results of Bositenghu, Dianshanhu, and Yuqiaoshuiku are in Class IV. The maximum pollution value of multiple indicators should be taken into account in addition to each indicator’s level of pollution when calculating the indicators’ weight. When analyzing a single sample, the calculation is rather straightforward; however, it becomes more complex when examining many samples.
Table 3.
Calculated values of connection degree.
Table 4.
Comprehensive evaluation table of lake eutrophication.
Table 5.
The evaluation index weight.
The results of the principal component analysis showed that the eutrophication status of Erhai, Gaozhoushuiku, Bositenghu, and Qionghai is Class III; the eutrophication status of Dianshanhu, Yuqiaoshuiku, Guchenghu, and Nansihu is Class IV; and the eutrophication status of Cihu Lake, Dalihu, Chaohu Lake, Dianchiwaihai, Dianchicaohu, Xihu Lake, Gantanghu, Moguhu, Xuanwuhu, Jingbohu, Moshuihu and Nanhu Lake is Class V. Although it has the characteristics of reducing dimension and simplifying data, there is no guarantee that the selected principal component contains most of the original information.
The evaluation results of the fuzzy set pair clustering assessment method are similar to those of other evaluation methods. It adopts the principle of maximum member for clustering evaluation, but does not consider the specific distribution of correlation, resulting in data loss and affecting the evaluation accuracy. Emphasizing the “major factors” often leads to deviations in evaluation results.
Discussion of the Advancement of Evaluation Results
The comparison of evaluation results highlights the complexity and impracticality of most models. This research introduces the fuzzy set-pair clustering assessment method, which considers the impact of randomness and ambiguity of eutrophication evaluation factor weights on water quality assessment. It also addresses the challenge of determining uncertainty coefficients of variance. By utilizing this method for lake eutrophication evaluation, a more accurate depiction of eutrophication changes is achieved, aligning with real-world scenarios and reducing uncertainty in the evaluation results. Moreover, this approach better captures the vague definition of lake eutrophication levels and thoroughly examines the intricate uncertainty relationship between measured values of lake eutrophication.
Table 6.
Results of lake eutrophication with different evaluation methods.
Fig. 1.
Proportion of eutrophication grade for six evaluation methods. Fuzzy set pair clustering assessment method (FSPCAM), Fuzzy comprehensive method (FCE), Weighted order method (WOM), Grey relation analysis (GRA), Principal component analysis (PCA), Set pair analysis (SPA). Methodological sources [36].
Assumptions and Prospects
In order to enhance the accuracy of lake eutrophication evaluations, it is advisable to take into account both the temporal and spatial distribution of data. Horizontal comparisons between lakes within a specific year and vertical/spatial comparisons over time within a particular lake can provide a more comprehensive assessment. This study assumes the use of real values for evaluation indicators, but it is suggested to also consider uncertain data types such as fuzzy numbers, random numbers, or intervals. Prior to applying the model, simulated sampling should be utilized to address these uncertainties. The lack of sensitivity analysis in the current model is due to the complex nature of eutrophic assessment, which involves unstructured data and presents challenges for sensitivity analysis. While the paper has made some progress with weighted data, it is recommended to incorporate the model into deep neural networks and artificial intelligence methods for a more thorough eutrophication evaluation in the future.
Conclusions
A new approach to lake eutrophication evaluation has been proposed in this paper. According to the unavoidable fuzzy and random characteristics in the evaluation of water eutrophication, the method was introduced into the evaluation of water eutrophication in 20 typical lakes in China.
The method is more specific on the identity, discrepancy, and contradictory character of matter, while avoiding discussion of coefficient value. At the same time, we use the original relation degree malleability to set up a five-grade evaluation new model of lake eutrophication. In this model, in order to determine the weight of each indicator, the evaluation index system and the grade standards of lake eutrophication were established according to the actual situation of the study area. An accelerating genetic algorithm analytic hierarchy process was used to calculate the subjective weight of each index. The variation-coefficient method was used to calculate the objective weight of each index. The regional lake eutrophication evaluation model has been established on this foundation. This model combined objective information in the field of study with the knowledge of experts. Furthermore, the computation’s outcomes made sense. Through modification of the index system and grade requirements for universality, this can be applied to various cases of lake eutrophication.
Additionally, this methodology has a higher application value and offers a form of evaluation and decision-making process for lake eutrophication assessment that is more reasonable and scientific. About 75% of China’s lake water resources are polluted by obvious eutrophication. The main freshwater lakes are seriously eutrophic and some lakes have lost the function of water resources. Therefore, it is necessary to take the principle of controlling source and intercepting pollution and long-term water control. We need to formulate treatment plans according to the degree of pollution, comprehensively considering various factors.

