

Introduction
With the rapid advancement of industrialization and urbanization, coal-resource-based cities, while providing energy support for national economic development, are also facing severe challenges from soil heavy metal pollution [1]. The soil environmental quality in the near-river areas of the main urban zones, as an integral part of cities, directly impacts urban ecological security and residents' health [2]. Therefore, studying the characteristics of heavy metal pollution in these areas, assessing their potential ecological risks, and conducting quantitative source apportionment are of significant importance for formulating effective soil pollution prevention strategies and ensuring sustainable urban development [3].
Research indicates that extensive coal mining and utilization have led to a general increase in heavy metal concentrations in the soil of near-river areas in the main urban zones of surrounding cities [4]. Heavy metal pollution in soil primarily originates from waste emissions generated during coal mining, washing, transportation, and combustion processes [5]. The accumulation of heavy metals such as lead, cadmium, mercury, and arsenic in soil poses significant potential threats to the ecological environment and human health [6]. In terms of ecological risk assessment, scholars have employed indices such as the potential ecological risk index (RI) and pollution load index (PLI) to evaluate the ecological risks of heavy metal pollution in soil [7]. These indices effectively reflect the degree of heavy metal pollution and the level of potential ecological risks in soil [8]. Quantitative source apportionment, as a critical tool for understanding the sources and migration-transformation mechanisms of heavy metal pollution in soil, currently relies on methods such as multivariate statistical analysis, geostatistical methods, isotope tracing techniques, and model-based quantitative analysis [9]. These methods help identify and quantify the contribution rates of different pollution sources to soil heavy metal pollution, providing a scientific basis for formulating effective soil remediation and pollution control strategies [10].
Existing studies show that advanced geochemical analysis techniques and isotope technologies are being widely applied in research on heavy metal pollution in soil [11]. These technologies provide higher-resolution data, enabling more precise identification of pollution sources and pathways [12]. Additionally, researchers have developed new mathematical models and algorithms to more accurately assess the ecological and health risks of heavy metal pollution in soil [13]. These research achievements offer robust scientific support for the management of heavy metal pollution in coal-resource-based cities [14].
This study takes Suzhou, a coal-resource-based city in northern Anhui Province, China, as an example. It aims to systematically investigate heavy metal pollution in the soil of near-river areas in the main urban zone, reveal the distribution characteristics of major heavy metal elements in the soil, assess their potential risks to the ecological environment, and conduct quantitative source apportionment using statistical analysis methods. The findings will provide scientific evidence for relevant management departments, aiding in the implementation of targeted soil remediation and pollution control measures, thereby improving urban soil environmental quality and safeguarding public health and ecological security.
Materials and Methods
Study Area Overview
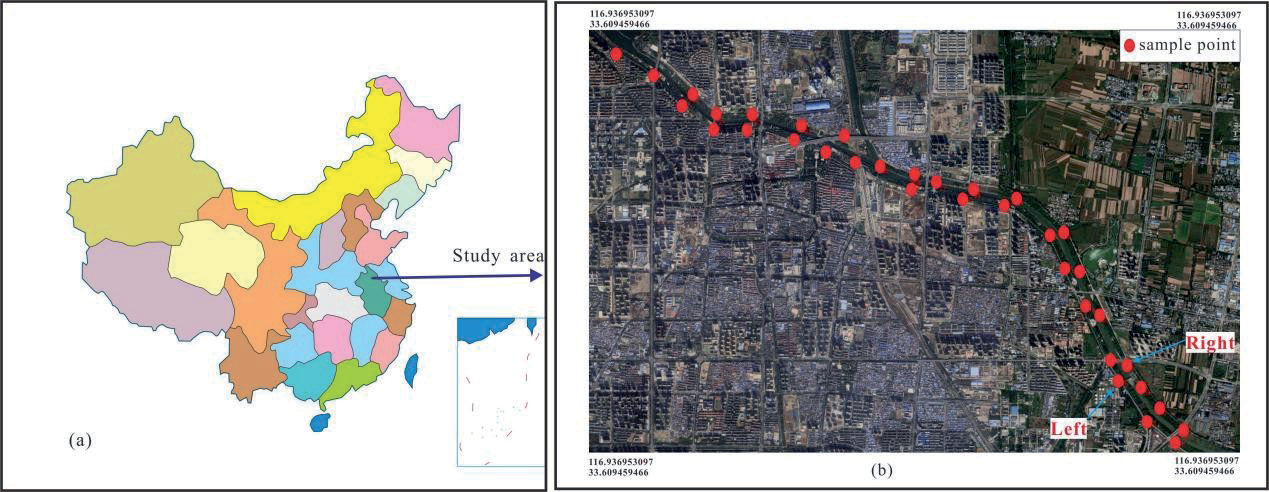
Suzhou City is located in northeastern Anhui Province, China (116°09′-117°10′E, 33°18′-34°38′N), situated on the southern margin of the Huang-Huai-Hai Plain. The urban area exhibits an east-west elongated distribution pattern, with a north-south width of 5-8 km and an east-west length of 10-15 km. It is a typical coal-resource-based city (Fig. 1a). The city is rich in coal resources, with a long history of mining, and serves as an important energy base in East China. The coal types in Suzhou are primarily anthracite, along with bituminous coal, lignite, and other varieties, characterized by large reserves and high quality, providing significant support for local economic development [15]. However, long-term coal mining has also brought notable environmental pressures, including land subsidence and soil erosion, which have damaged the local ecological environment. Additionally, pollutants such as exhaust gases, wastewater, and waste residues generated during coal mining have caused severe environmental pollution, affecting residents' quality of life and hindering the sustainable development of Suzhou. The city is surrounded by a moat that is closely related to residents' daily lives. The main trunk of the moat is approximately 10 kilometers long, with a width of about 28 meters, and a nearby residential area spanning about 8.5 kilometers.
Sample Collection, Processing, and Testing
A total of 36 sampling points were established for this study, distributed along both sides of the main stream of the moat in Suzhou City. Among these, 19 sampling points were located on the left bank, and 18 on the right bank, with an interval of approximately 500 meters between adjacent points. The distribution of sampling points considered different functional zones, including engineering construction areas, economic development zones, urban residential areas, park-school zones, and commercial areas. Specific locations included shopping malls, hospitals, bus stations, auto repair shops, and parks (Fig. 1b).
Surface soil samples (0-10 cm depth) were collected using stainless steel shovels. After removing surface debris, the samples were placed in clean, sealed bags and labeled. The locations of the sampling points were recorded using GPS devices. The samples were transported to the laboratory, where they were air-dried, crushed, and sequentially sieved through 60-mesh, 80- mesh, 100-mesh, and 200-mesh nylon screens. The "quartering method" was used to reduce the sample size to approximately 1 kilogram. Subsequently, 5 grams of soil sample were accurately weighed using an analytical balance and pressed into pellets using a 20-ton press for further analysis.
The concentrations of Cu, Pb, Zn, Cd, Ni, Cr, and As in the samples were determined using an X-ray fluorescence spectrometer (ICP-2000). Quality control was performed using soil component analysis reference materials (GBW07430, GSS-16), with recovery rates ranging between 85% and 110%. The relative deviation between samples was less than 5%, and the test results met quality control requirements.
Data Processing and Analysis Methods
Statistical Analysis
IBM SPSS Statistics 27 software was used for data processing and analysis, including descriptive statistical analysis of heavy metal elements, Pearson correlation analysis, and principal component analysis (PCA). The EPA PMF 5.0 software was employed for source apportionment of soil heavy metals, while box plots and bar charts were generated using Origin 8.0 software.
Methods for Pollution Level and Ecological Risk Assessment
(1) Single Factor and Nemerow Comprehensive Pollution Index Methods
The single-factor pollution index method evaluates the pollution level of individual heavy metal elements by comparing the measured concentrations with background values or evaluation standard values [16]. The Nemerow comprehensive pollution index method integrates both the average and maximum values of the single-factor pollution indices. The calculation formulas are given by Equations (1) and (2), and the evaluation criteria for pollution levels are presented in Table 1 [17].
Table 1.
Classification Standards for Soil Heavy Metal Pollution Levels.
In the formula, Pi represents the individual environmental quality index; Pn represents the Nemerow integrated pollution index; Ci represents the measured content of the element i; Si represents the reference standard content of the element i; Pi,ave represents the average environmental quality index of the element at the sampling point; Pi,max represents the maximum environmental quality index of the element i at the sampling point.
(2) Geo-Accumulation Index Method
The geo-accumulation index, proposed by German scientist Muller in 1969, is used to quantitatively assess the degree of heavy metal pollution in sediments [18]. Its calculation formula is given by Equation (3), and the classification criteria for pollution levels are presented in Table 1.
In this study, the concentration of the representative element n in the soil is denoted as Cn; Bn represents the reference value for the element, with the soil background value of Anhui Province used as the reference; and K denotes the variation coefficient of the background value caused by diagenesis, typically set at 1.5.
(3) Potential Ecological Risk Assessment Method
The potential ecological risk index is employed to evaluate the potential risks, ecological sensitivity, and toxicity of heavy metal concentrations, reflecting the pollution levels of individual or mixed pollutants [19]. Its calculation formula is provided by Equation (4).
In the formula, RI represents the potential ecological risk index of multiple heavy metals; Eir represents the potential ecological risk index of a single heavy metal; Cio represents the actual measured value of the element; Cin represents the reference value of the element; Tir represents the toxicity response coefficient of the element.
Source Analysis Methods
In this study, a PCA-PMF integrated model was employed to identify the sources of soil heavy metals in the study area, combining Principal Component Analysis (PCA) and Positive Matrix Factorization (PMF). The PCA was primarily utilized to extract the principal components of heavy metal contamination, while PMF was applied to quantitatively assess the contribution rates of individual pollution sources. The integration of these two methods can enhance analytical accuracy and reduce predictive uncertainty.
Principal Component Analysis (PCA)
Principal component analysis (PCA) is a multivariate statistical technique that transforms a set of potentially linearly correlated original variables into a set of linearly uncorrelated variables (principal components) through orthogonal transformation, maximizing the retention of variability in the original dataset [20]. PCA first calculates the covariance matrix of the dataset and then solves for its eigenvalues and eigenvectors. Eigenvalues reflect the magnitude of variance in the direction of the corresponding eigenvectors, while eigenvectors determine the direction of data transformation into the new space. Principal components are sorted by the magnitude of eigenvalues, with larger eigenvalues explaining more variance in the data. In practical applications, factors with eigenvalues greater than 1 are typically selected as principal factors [21].
PMF Model
Positive Matrix Factorization (PMF) is a multi-element analysis technique that decomposes sample data into factor contribution matrices and factor distribution matrices. Its main advantage lies in associating sample content and estimated uncertainties with sample data, weighting individual points, and easily handling missing data [22]. The PMF model performs constrained and iterative calculations using weighted least squares, with the objective function Q minimized according to Equations (5) and (6).
In formulas (5) and (6): Xij denotes the measurement matrix of the j-th elemental component within a set of i samples; gjk represents the contribution matrix of the k-th source factor with respect to the total number of i samples; fki signifies the source profile of the j-th elemental component associated with the k-th source factor; and eij corresponds to the residual value of the j-th elemental component measured within the i-th sample.
In addition, the establishment of the PMF (Positive Matrix Factorization) model requires the uncertainty of the concentration of sample species, and the calculation formulas are (7) and (8).
In the formula: c is the concentration of the element in the sample; MDL is the detection limit of the determination method; EF is the determination precision.
Results and Discussion
Characteristics of Soil Heavy Metal Concentrations
In this study, 36 soil samples were collected from both sides of the moat, and the concentrations of Cu, Pb, Zn, Cd, Ni, Cr, and As were measured. The statistical results are presented in Table 2. The results indicate that the average concentrations of heavy metals on both sides of the riverbank were generally consistent, with slight differences in the rankings of Ni and Pb. On the left bank, the ranking was: Zn > Cr > Cu > Pb > Ni > As > Cd, while on the right bank, it was: Zn > Cr > Cu > Ni > Pb > As > Cd. Differences in element concentrations were observed between the two banks. The left bank exhibited higher concentrations of Zn (70.36 mg/kg), Cr (52.19 mg/kg), Pb (27.82 mg/kg), and As (17.74 mg/kg), whereas the right bank showed higher concentrations of Cu (40.47 mg/kg), Cd (7.46 mg/kg), and Ni (33.03 mg/ kg).
Compared with the background values of heavy metals in Anhui Province [23], the mean concentrations of all heavy metals except Zn exceeded the background values, indicating varying degrees of heavy metal pollution in the soil on both sides of the river. On the left bank, the mean concentrations of Cd, As, and Cu were 0.20 mg/kg, 17.74 mg/kg, and 28.73 mg/kg, respectively, which were 2.86, 1.98, and 1.44 times the background values of Anhui Province. On the right bank, the mean concentrations of Cd, Cu, and As were 0.16 mg/kg, 40.47 mg/kg, and 15.77 mg/kg, respectively, also 2.86, 1.98, and 1.44 times the background values, suggesting that Cd, Cu, and As contributed to soil pollution in the study area. Compared with the risk screening values in the "Soil Environmental Quality - Risk Control Standard for Soil Contamination of Agricultural Land (GB 15618-2018)" [24], except for some sampling points where As exceeded the standard, the concentrations of other elements were below the screening values.
Table 2.
Statistical characteristics analysis of heavy metal content in soil samples.
Fig. 2.
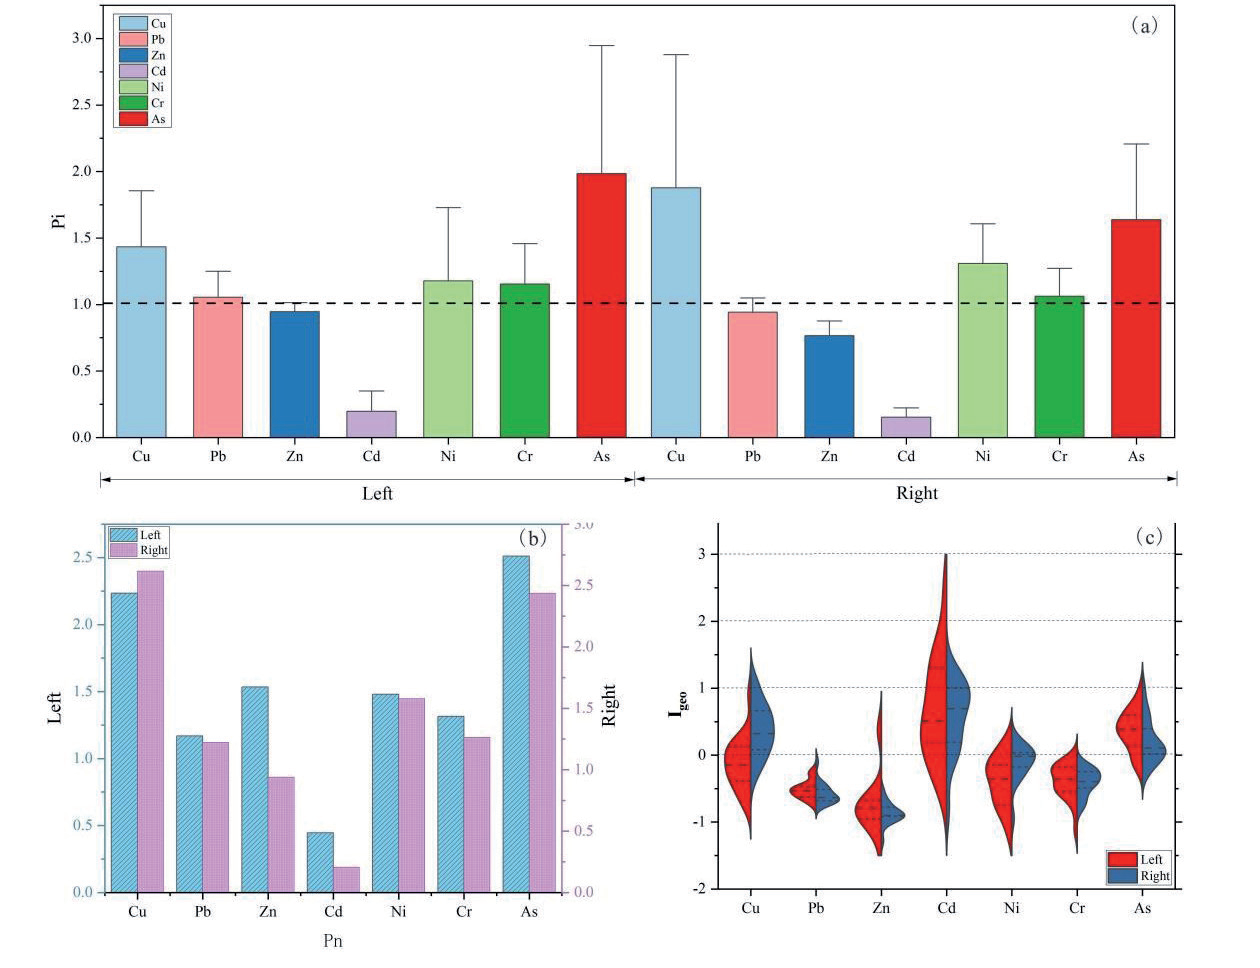
Statistical table of evaluation results of soil heavy metal pollution degree, a) represents Single Factor Index Method, b) represents Nemerow Comprehensive Pollution Method, c) represents Geological Accumulation Index Method.
In terms of skewness, heavy metals on the left bank were predominantly right-skewed, with only Cr showing left-skewness. On the right bank, Cd, Ni, Cr, and As exhibited left-skewness, while Cu, Pb, and Zn were right-skewed. Regarding kurtosis, the data generally followed a normal distribution, with most showing significant peaks, indicating that the data were concentrated around the mean. The distributions of Ni on the left bank and Cd on the right bank were relatively flat with wider tops, suggesting more dispersed data.
Assessment of Soil Heavy Metal Pollution
The single-factor pollution index was used to evaluate the pollution level of soil in the study area, with the background values of surface soil in Anhui Province as the reference standard. The results are shown in Fig. 2a. Overall, the pollution indices of multiple elements on the right bank were higher than those on the left bank, indicating more significant pollution on the right side. On the left bank, the single-factor pollution indices were ranked as Cd > As > Cu > Ni > Cr > Pb > Zn, while on the right bank, the ranking was Cd > Cu > As > Ni > Cr > Pb > Zn. Cd, As, and Cu were the primary pollutants in the study area. The mean pollution index of Cd was 2.59, indicating moderate pollution, while the mean pollution indices of As and Cu were 1.88 and 1.71, respectively, indicating mild pollution. The pollution levels of these three elements were higher on the right bank than on the left bank. Ni, Cr, and Pb exhibited lighter pollution, with the mean pollution indices of Ni and Pb being higher on the right bank, while Cr pollution was more severe on the left bank. The mean pollution index of Zn was 0.89, indicating no pollution.
Based on the Nemerow comprehensive pollution index (Fig. 2b), the pollution levels on both banks showed some similarities. Pb, Ni, and Cr were classified as mildly polluted, while Cu and As were moderately polluted. Differences were mainly observed for Zn and Cd. On the left bank, Zn was mildly polluted, while on the right bank, it was close to the warning line. Cd was heavily polluted on the left bank and moderately polluted on the right bank.
The geo-accumulation index results (Fig. 2c) revealed that mild pollution was prevalent. On the left bank, the proportions of mildly polluted elements were As (84.21%) > Cd (52.63%) > Cu (42.11%) > Ni (15.79%) > Zn (10.52%), while on the right bank, they were As (76.47%) > Cu (64.71%) > Cd (58.82%) > Ni (41.18%) > Zn (10.52%). Cd reached moderate pollution levels at 31.58% and 29.41% of the sampling points on the left and right banks, respectively, indicating some degree of pollution accumulation for Cd, Cu, and As. Cr and Pb were classified as unpolluted.
Ecological Risk Assessment
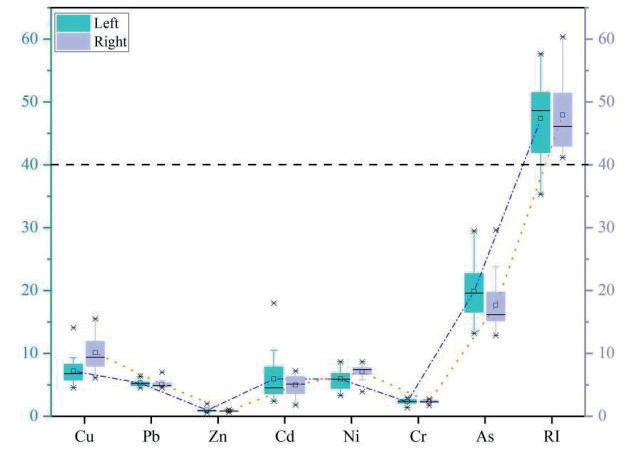
The results of the Hankanson potential ecological risk assessment are shown in Fig. 3. On the left bank, the mean potential ecological risk values of heavy metals were ranked as As (19.54) > Cu (7.17) > Cd (5.91) > Ni (5.89) > Pb (5.27) > Cr (2.31). On the right bank, the ranking was As (17.64) > Cu (10.11) > Ni (7.05) > Pb (5.07) > Cd (4.94) > Cr (2.29). According to the Hankanson potential ecological risk classification criteria presented in Table 1, the potential risk index values Eir for all elements were below 40 [25], suggesting that each element exhibited a slight ecological risk level. The total potential risk index (RI) for heavy metals at each sampling point ranged from 35.32 to 57.64 on the left bank and from 41.17 to 60.36 on the right bank, indicating that the soil heavy metals in the study area posed a slight ecological risk.
Source Apportionment
Correlation and Principal Component Analysis
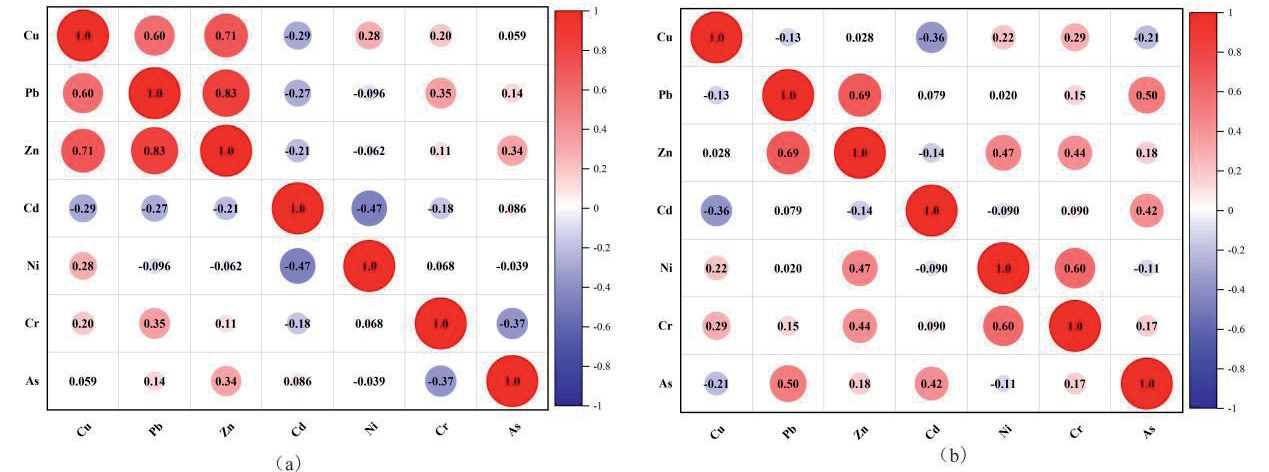
Studies have shown that significant correlations between heavy metal concentrations can reflect common sources or similar geochemical processes among elements. If elements exhibit significant or highly significant correlations, it suggests the possibility of homologous sources or composite pollution scenarios [26]. Fig. 4 presents the Pearson correlation coefficient heatmap for seven heavy metals on both sides of the river. The results indicate significant positive correlations between Zn-Pb (0.83) and Zn-Cu (0.71) on the left bank, with a moderate positive correlation between Pb-Cu (0.60). On the right bank, a significant positive correlation was observed between Zn-Pb (0.69), with moderate positive correlations between Cr-Ni (0.60) and Pb-As (0.50). This suggests that Pb, Zn, and Cu may share similar sources, while Cr-Ni and Pb-As may undergo similar geochemical processes [27]. Additionally, weak negative correlations between heavy metal elements indicate insignificant inhibitory effects among them.
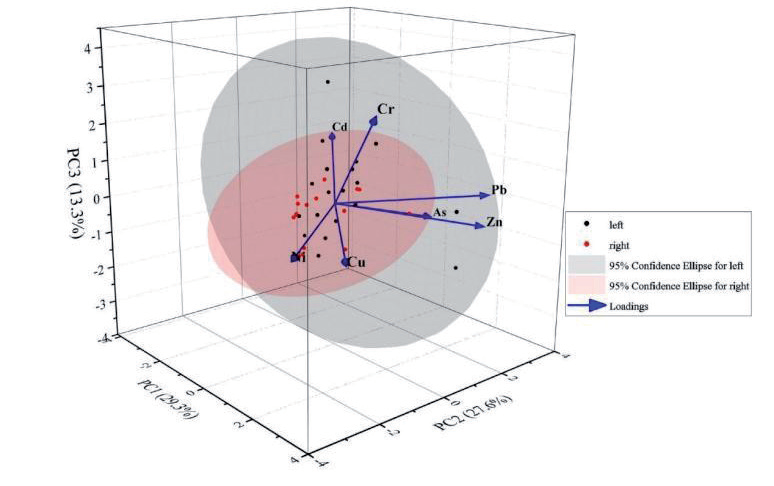
To explore the potential pollution sources of heavy metals in the study area, principal component analysis (PCA) was employed for factor analysis. The KMO test result was 0.569, meeting the minimum requirement of 0.5, and the Bartlett’s sphericity test yielded a Sig value of 0, indicating that PCA is suitable for analyzing the intrinsic relationships among variables [28].
Three principal components were extracted from the study area samples, with factors having eigenvalues greater than 1 selected as principal factors (Fig. 5). The variance contributions of the first three principal components were 29.30%, 27.59%, and 13.26%, respectively, with a cumulative variance contribution of 70.16%, reflecting the majority of the variability in the samples. The first principal component was characterized by Zn, Pb, Cu, and Ni; the second by As and Pb; and the third by Cr and Cd. High loadings of characteristic elements in different principal components suggest they may originate from different pollution sources or be associated with distinct geochemical processes [29].
The first principal component, comprising Zn, Pb, Cu, and Ni, is commonly associated with industrial activities and traffic emissions [30, 31], likely reflecting the impact of human activities on soil heavy metal concentrations. The second principal component, featuring As and Pb, may be linked to natural geological processes or specific types of industrial pollution [32]. The third principal component, characterized by Cr and Cd, could originate from agricultural activities or specific industrial emissions [33, 34]. PCA provided preliminary insights into potential pollution sources, offering important clues for subsequent precise source apportionment methods.
PMF Model
The Positive Matrix Factorization (PMF) model was applied to further analyze the sources of seven heavy metals on both sides of the river in the study area. Using the PMF 5.0 software developed by the U.S. Environmental Protection Agency (EPA), heavy metal concentration data and their uncertainty information were input into the model to ensure an optimal signal-to-noise ratio [35].
The PMF model employs constrained iterative calculations through weighted least squares optimization, minimizing the objective function Q as defined in Equations (5) and (6). Implementation using EPA PMF 5.0 software achieved optimal convergence at the 15th iteration, where the Q function reached its minimum value, satisfying the computational objectives [36]. The results revealed pollution sources and their contribution proportions for both banks (Fig. 6).
Factor 1: Dominantly loaded with Cr (68.7%) and Pb (43.5%). High Cr concentrations are typically associated with industrial activities, such as industrial waste treatment, sewage sludge, and residues, while high Pb loading may be linked to fuel combustion, gasoline additives, and engine use [37]. Thus, Factor 1 was identified as an industrial activity source.
Factor 2: Primarily loaded with Ni (30.7%). The distribution of Ni may be related to metal processing, electroplating, or traffic emissions [38-39], leading to the identification of Factor 2 as a composite source of light industry and traffic.
Factor 3: Dominantly loaded with Cu (69.5%) and Zn (46.1%). High Cu loading may be associated with urban sewage sludge treatment and irrigation equipment use, while Zn sources include agricultural fertilizer use and metal smelting waste [40, 41]. Therefore, Factor 3 was identified as a human activity source.
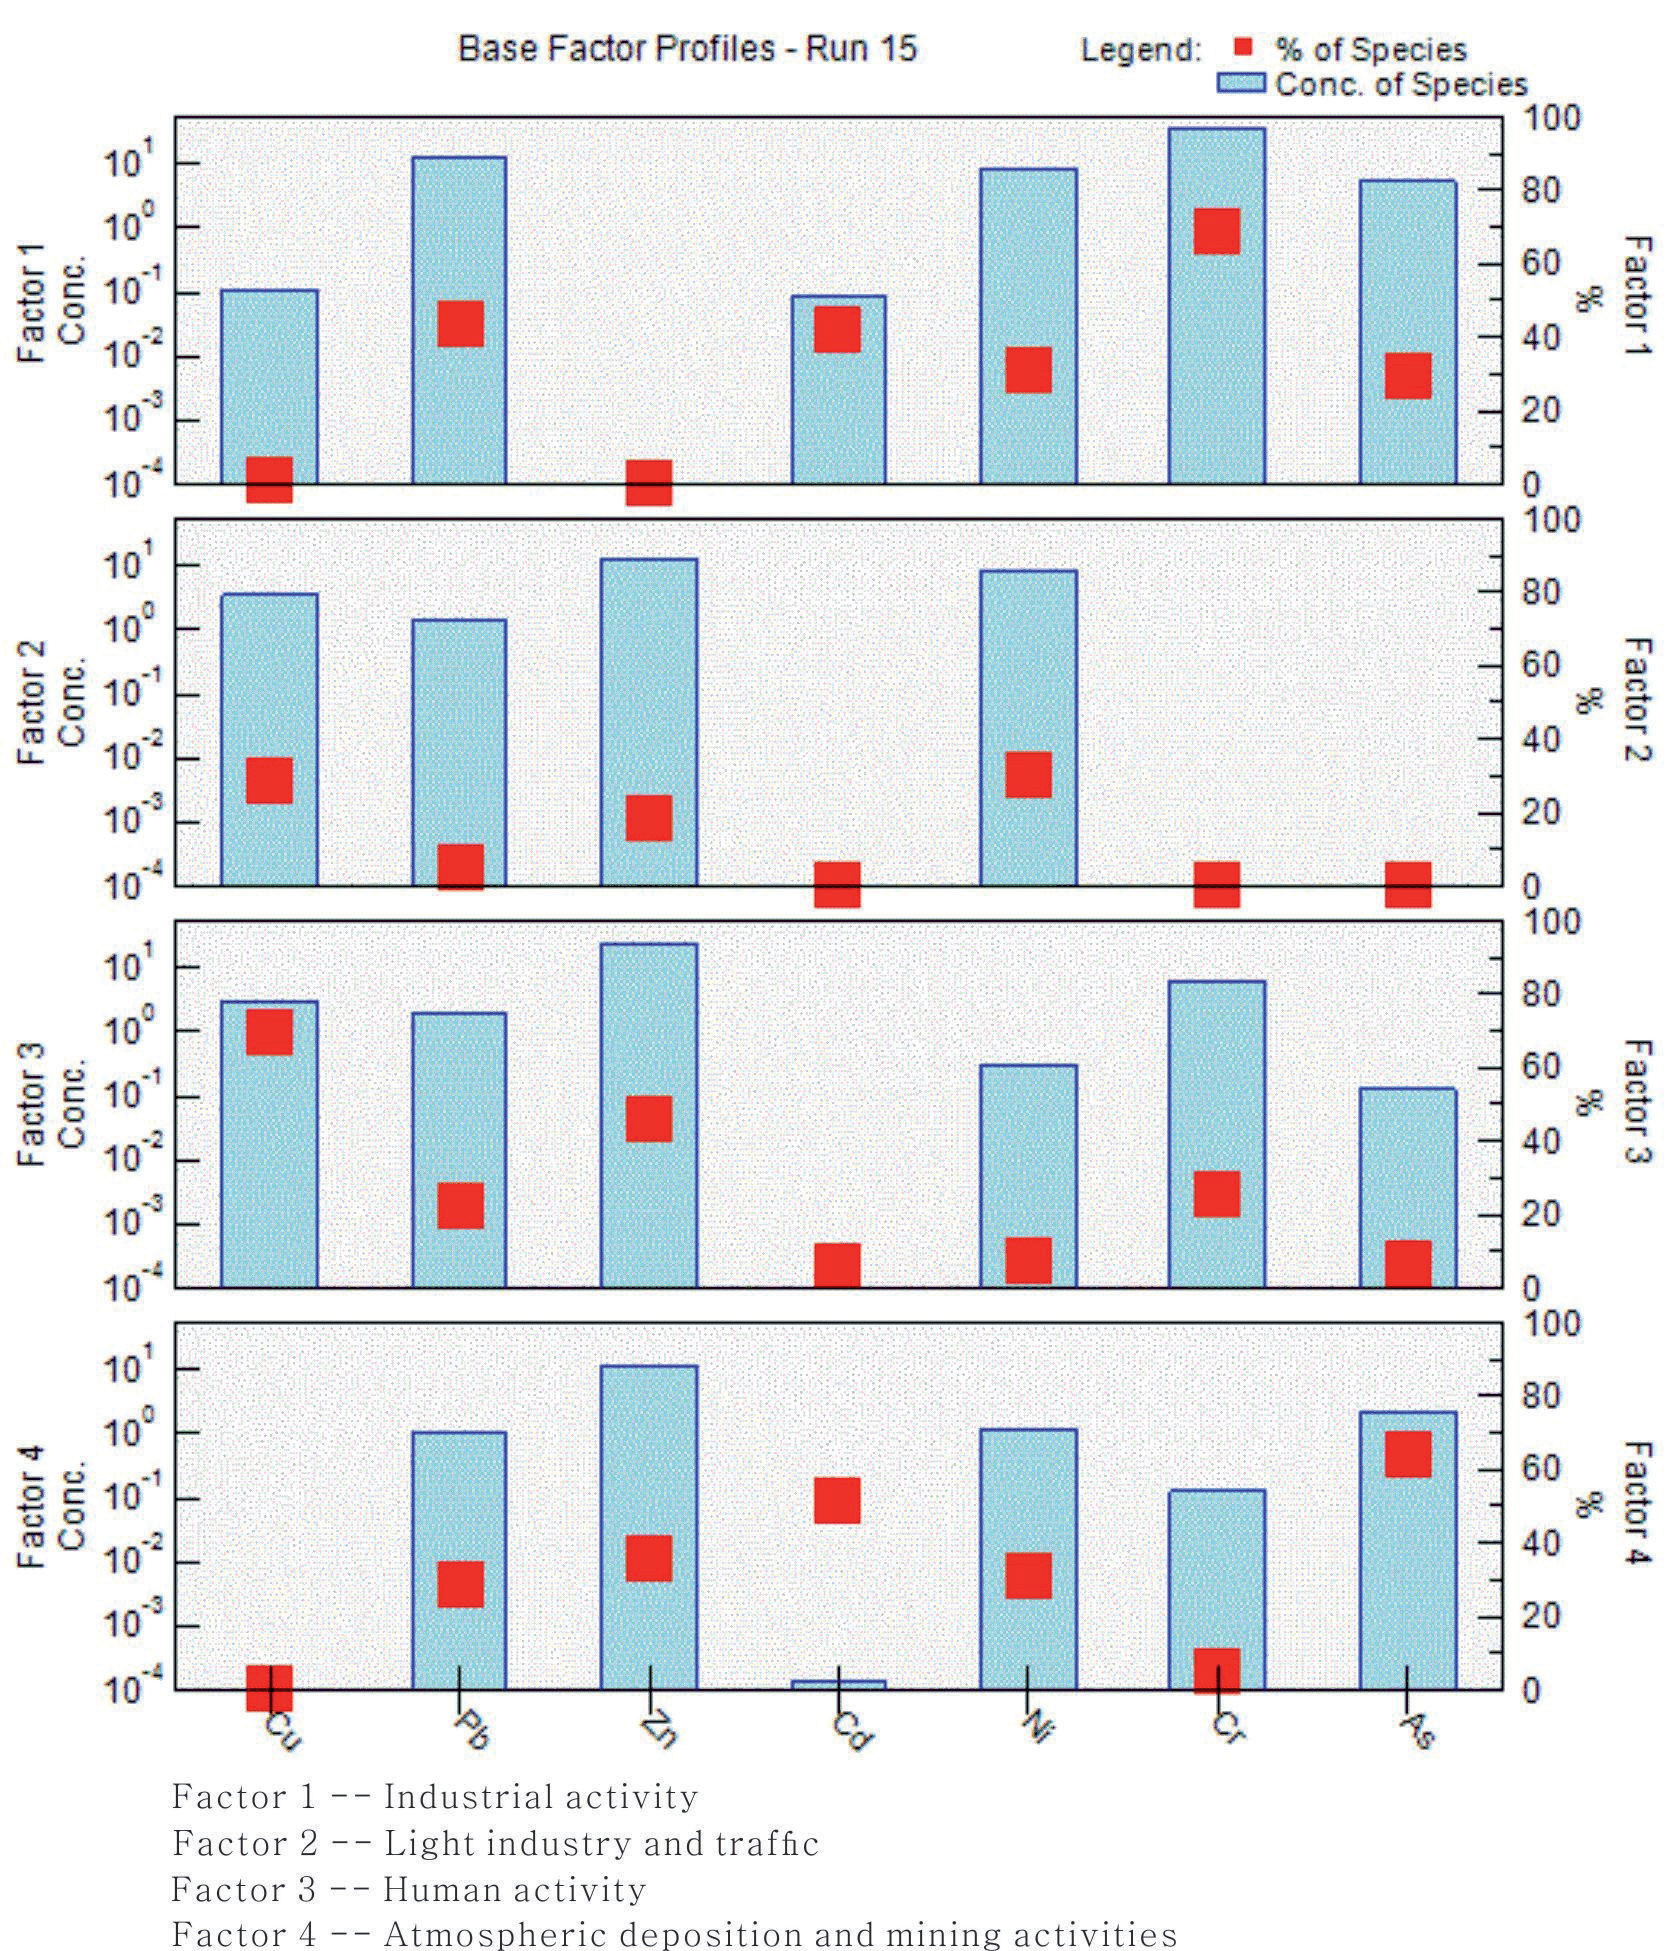
Factor 4: Primarily loaded with As (64.3%) and Cd (51.7%). High As loading may be linked to coal combustion fly ash and mining activities [42], while Cd sources include natural geological processes and emissions from battery production and chemical industries [43]. Thus, Factor 4 was identified as a composite source of atmospheric deposition and mining activities.
Based on the factor fingerprint analysis of heavy metal elements [44], the contribution proportions of each pollution source were calculated [45]. The results showed that the composite source of atmospheric deposition and mining activities had the highest contribution (31.63%), followed by industrial activity sources (31.00%), human activity sources (26.67%), and the composite source of light industry and traffic (12.11%). The primary sources of heavy metal pollution in the study area were coal mining, combustion, and chemical industrial activities.
The PMF model clarified the sources and contribution proportions of heavy metal elements, revealing the impact of different pollution sources on soil heavy metal concentrations on both sides of the river. This provides a scientific basis for formulating targeted pollution prevention strategies.
Conclusions
In light of the aforementioned investigations and analyses, this study culminates in the following conclusions:
(1) Heavy metal concentrations in soil on both riverbanks were generally consistent but varied slightly. Most metals, except Zn, exceeded Anhui Province's background values, indicating pollution. Cd, Cu, and As were the primary pollutants, though most concentrations remained below the thresholds set by the "Soil Environmental Quality - Risk Control Standard for Soil Contamination of Agricultural Land (GB 15618- 2018)". Data distributions were mostly centered around the mean, with Ni on the left bank and Cd on the right bank showing greater dispersion.
(2) Ecological risk assessments identified As, Cu, and Cd as the main pollutants, with an overall slight ecological risk. The total potential risk index (RI) ranged from 35.32 to 60.36 across both banks. Single-factor pollution indices indicated higher pollution levels on the right bank, with Cd classified as moderately polluted and As and Cu as mildly polluted. Nemerow and geo-accumulation indices revealed mild pollution for Pb, Ni, and Cr, moderate pollution for Cu and As, and higher pollution levels for Cd. Targeted measures should prioritize controlling Cd, Cu, and As pollution.
(3) PCA and PMF models were employed to identify heavy metal sources. PCA extracted three principal components, explaining 70.16% of the variance, indicating diverse pollution sources. The PMF model identified four sources: industrial activities (31.00%), light industry and traffic (12.11%), human activities (26.67%), and atmospheric deposition combined with mining activities (31.63%). Industrial and mining activities were the primary contributors. These findings offer a scientific basis for pollution prevention strategies.

