

Introduction
The extensive utilization of antibiotics, which are difficult to break down in the environment, has led to a growing threat of antibiotic pollution in natural ecosystems [1]. This issue arises from two main sources: first, the use of antibiotics in livestock farming, where they are not fully metabolized and are subsequently released into the environment through animal waste [2]; second, the limited effectiveness of conventional wastewater treatment processes, which rely on microbial activity, in breaking down antibiotics due to their inherent antimicrobial properties [3]. Tinidazole, a member of the nitroimidazole class, is extensively employed in aquaculture, poultry farming, and treating human infections, such as respiratory and pelvic diseases, as well as parasitic infections, including trichomoniasis and amoebiasis [4]. Due to its resistance to decomposition, approximately 32%-37% of tinidazole is excreted unchanged in urine and feces [5], eventually entering aquatic environments through pathways such as runoff, wastewater discharge, and soil infiltration [6]. Notably, tinidazole concentrations as high as 90 mg/L have been detected in hospital wastewater [7], while trace amounts (1.8-17.8 ng/L) have also been identified in tap water [8]. Long-term exposure to antibiotics, even at low concentrations, can contribute to developing bacterial resistance, posing a significant challenge to public health [9]. Furthermore, tinidazole has been associated with genotoxic and cytotoxic effects [8], highlighting the urgent need for advanced water treatment technologies capable of effectively breaking down this persistent pollutant.
Compared to traditional methods such as adsorption and biological treatment technologies, advanced oxidation processes (AOPs) have garnered significant attention in recent years for treating refractory pollutants due to their ability to generate highly reactive sulfate radicals (SO4-∙) and hydroxyl radicals (∙OH). Among these, ultraviolet (UV)-based AOPs have gained increasing popularity in the field of refractory organic pollutant degradation due to their high efficiency, environmental friendliness, and the absence of a need for catalyst recovery. However, there is limited literature on applying UV-based AOPs for the degradation of tinidazole. Luo et al. [10] employed a UV/chlorine process to degrade tinidazole in water, achieving a degradation rate of 90.6%. Despite the high efficiency, the reaction time was as long as 40 minutes, and the UV lamp power reached 40 W, indicating relatively high energy consumption. Subsequently, Luo et al. [11] improved the process by introducing bromide ions into the UV/chlorine system, achieving approximately 87% degradation of tinidazole within 20 min, significantly enhancing the process efficiency. Nevertheless, the high UV lamp power and prolonged reaction time still imply substantial energy consumption, particularly in large-scale industrial applications. Therefore, developing a more efficient and cost-effective process holds significant engineering value.
Due to its high efficiency, the UV/persulfate (UV/PS) process has been widely applied for the degradation and mineralization of refractory organic pollutants. For instance, Hou et al. [12] utilized the UV/ PS process to degrade dichloroacetonitrile in water, achieving a degradation efficiency of approximately 90% within 7 min. Similarly, Cai et al. [13] employed a UV/PS/NO₂⁻ process to degrade 2,4,6-tribromophenol, attaining over 90% degradation within 5 min, demonstrating excellent performance. This process achieved rapid pollutant degradation within minutes rather than tens of minutes, with UV lamp power in the range of a few watts rather than tens of watts. Thus, the UV/PS process represents a promising technology for treating refractory pollutants, particularly in low-power and low-cost applications. However, there are currently limited reports on the efficiency, process evaluation, and economic assessment of the UV/PS process for treating tinidazole.
To address this gap, this study investigates the degradation of tinidazole in water using the UV/PS process, focusing on the following aspects:
(1) degradation kinetics, (2) the effects of factors and water matrix, and (3) the calculation of optimal operational conditions and economic evaluation. This research aims to advance the practical application of the UV/PS process in treating antibiotic-contaminated water.
Materials and Methods
Chemicals
Tinidazole (purity>98.0%) was purchased from Aladdin Co., Ltd. (Shanghai, China). Potassium persulfate (analytical grade), sodium hydroxide (analytical grade), sodium chloride (analytical grade), and sodium sulfate (analytical grade) were obtained from Sinopharm Chemical Reagent Co., Ltd. (Chongqing, China). Sodium dihydrogen phosphate (analytical grade), disodium hydrogen phosphate (analytical grade), and sodium bicarbonate (analytical grade) were supplied by Tianjin Damao Chemical Reagent Factory (Tianjin, China). A dilute sulfuric acid solution (0.5 M) was provided by Codow Pharma Tech Co., Ltd. (Guangdong, China). Sodium nitrate standard solution (0.5 M) was acquired from Kermel Chemical Reagents Co., Ltd. (Tianjin, China). Ethanol (analytical grade) and tert-butanol (analytical grade) were purchased from Xilong Scientific Co., Ltd. (Guangdong, China). Methanol (analytical grade) was sourced from Shanghai Hushi Laboratory Equipment Co., Ltd. (Shanghai, China).
Analytical Methods
The concentration of tinidazole was determined using a UV-Vis spectrophotometer (Hach, DR6000, USA). Full-spectrum scanning of tinidazole revealed a maximum absorption peak at 317 nm. Therefore, the concentration of tinidazole was quantified by measuring the absorbance of the samples at 317 nm. The pH of the reaction solution was monitored using a pH meter (Hanna, HI98107, Italy), which was calibrated prior to use. Additionally, full-spectrum scanning of 3 quenching agents – ethanol, tert-butanol, and methanol – was performed using the spectrophotometer. The results indicated that their absorbance at 317 nm was negligible, confirming that these quenching agents do not interfere with the measurement of tinidazole concentration.
Experimental Procedure
The reaction solution (1 L) was placed in a cylindrical glass reactor with a height of 40 cm and a diameter of 6.1 cm. A magnetic stirrer was positioned at the bottom of the reactor to ensure thorough mixing of the reaction solution, and the temperature was maintained at 25ºC using a water bath. A UV lamp (GPH287T5L/4, 14 W, Heraeus, Germany) enclosed in a quartz sleeve was vertically inserted into the center of the reactor, allowing uniform distribution of UV light throughout the reaction solution. Phosphate buffer solution (6 mM) was used to maintain the pH of the reaction solution, as phosphate has been shown to have minimal impact on the oxidation efficiency of radicals [14]. To adjust the UV lamp power, aluminum foil was wrapped around specific sections of the lamp to shield portions of the light-emitting area. After the reaction was initiated, approximately 2.5 mL of the reaction solution was sampled at regular intervals and immediately transferred to a 1 cm cuvette for measurement.
Results and Discussion
The Degradation of TNZ in the UV/PS Process
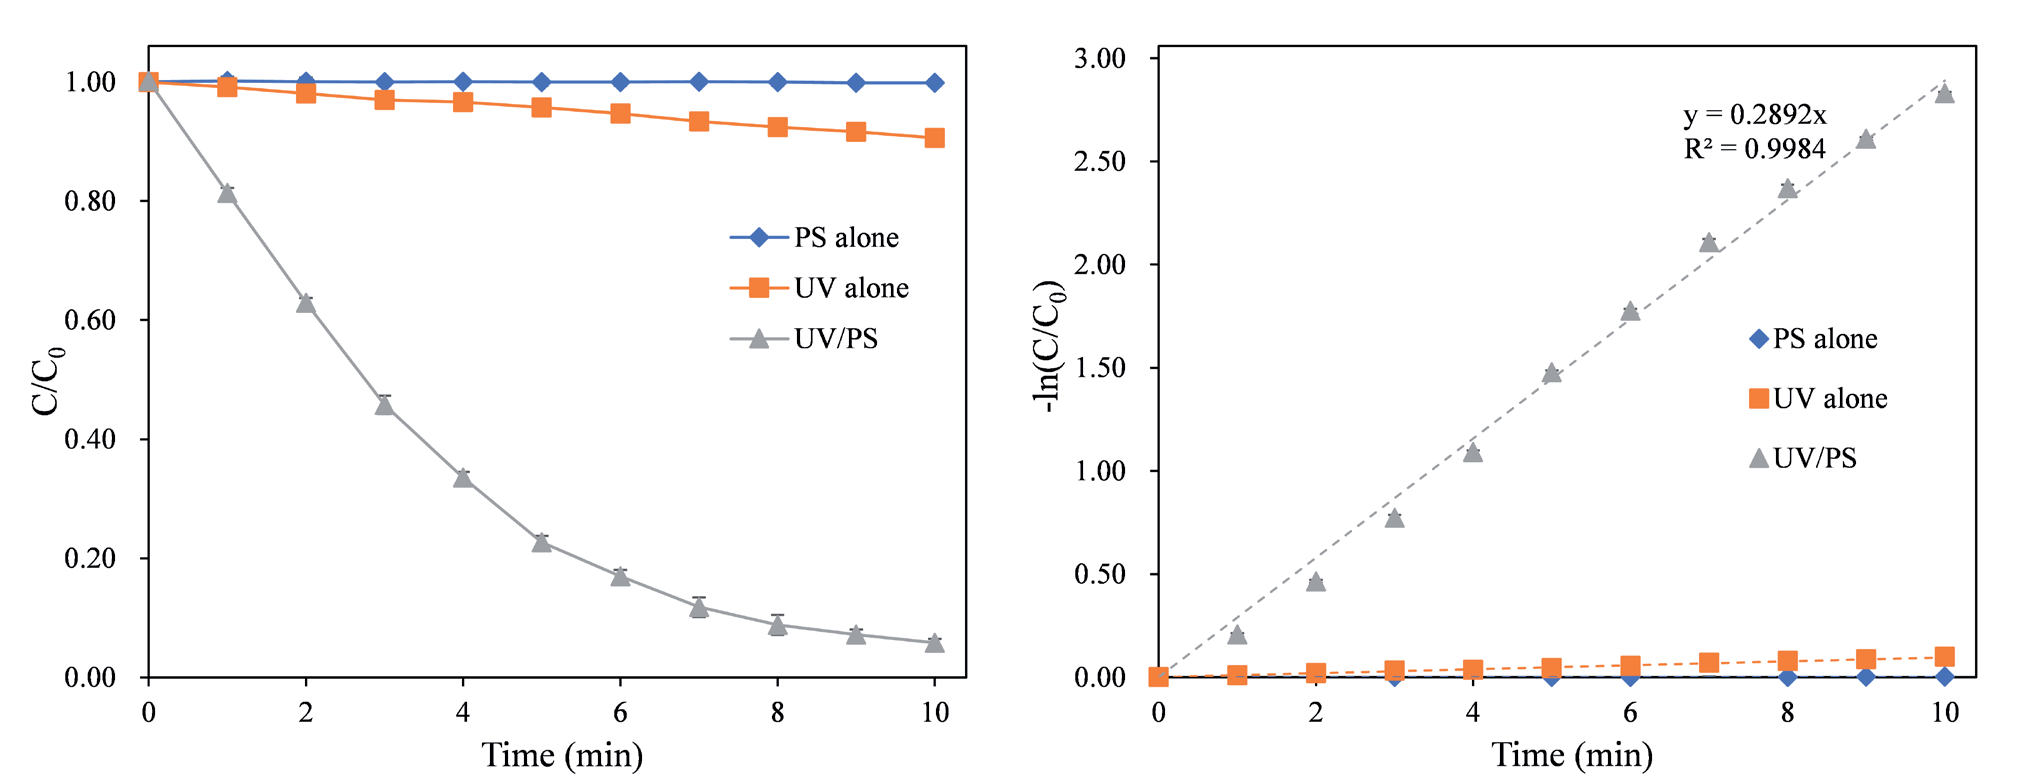
As shown in Fig. 1, compared with the degradation efficiency under UV alone (9.4%) and PS alone (negligible degradation), the UV/PS process was demonstrated to effectively degrade tinidazole (TNZ), achieving a degradation efficiency of 94.1% within 10 min under conditions of 40 μM initial concentration of TNZ, 0.3 mM dosages of PS, 25°C temperature, 7.0 pH, and 14 W UV power. The high efficiency might be attributed to the generation of sulfate radicals (SO4-∙) through the decomposition of PS under UV irradiation (Eq. (1)). SO4-∙, a highly reactive radical with a redox potential of 2.5-3.1 V, and its derived hydroxyl radicals (∙OH, Eq. (2)), with a redox potential of 1.8-2.7 V, are both capable of efficiently oxidizing most organic pollutants [15, 16]. The degradation process was fitted using zero-order, first-order, and second-order reaction models, with regression coefficients (R²) of 0.884, 0.998, and 0.948, respectively. The results indicate that the reaction follows pseudo-first-order kinetics, consistent with previous studies [17]. This behavior is likely due to the excess amount of oxidant relative to TNZ, where the reaction rate primarily depends on the concentration of TNZ within a certain range. The pseudo-first-order rate constant was determined to be 4.82×10⁻³ s-1.
Effects of Factors in the UV/PS Process
From the graph presented in Fig. 2, as the dosages of PS increased from 0.1 mM to 0.5 mM, the degradation efficiency of TNZ within 10 min rose from 64.9% to 98.5%, and the reaction rate constant increased from 1.62×10⁻³ s-1 to 7.25×10⁻³ s-1. Similarly, as illustrated in Fig. 3, when the UV power was gradually increased from 3.5 W to 14 W, the degradation efficiency of TNZ within 10 min improved from 69.0% to 94.1%, and the reaction rate constant increased from 1.85×10⁻³ s-1 to 4.82×10⁻³ s-1. This could be attributed to the fact that, with higher dosages of PS or increased UV power, the generation of SO4-∙ and ∙OH from the photolysis of PS also increased, leading to a higher probability of collisions between TNZ and radicals, thereby accelerating the reaction.
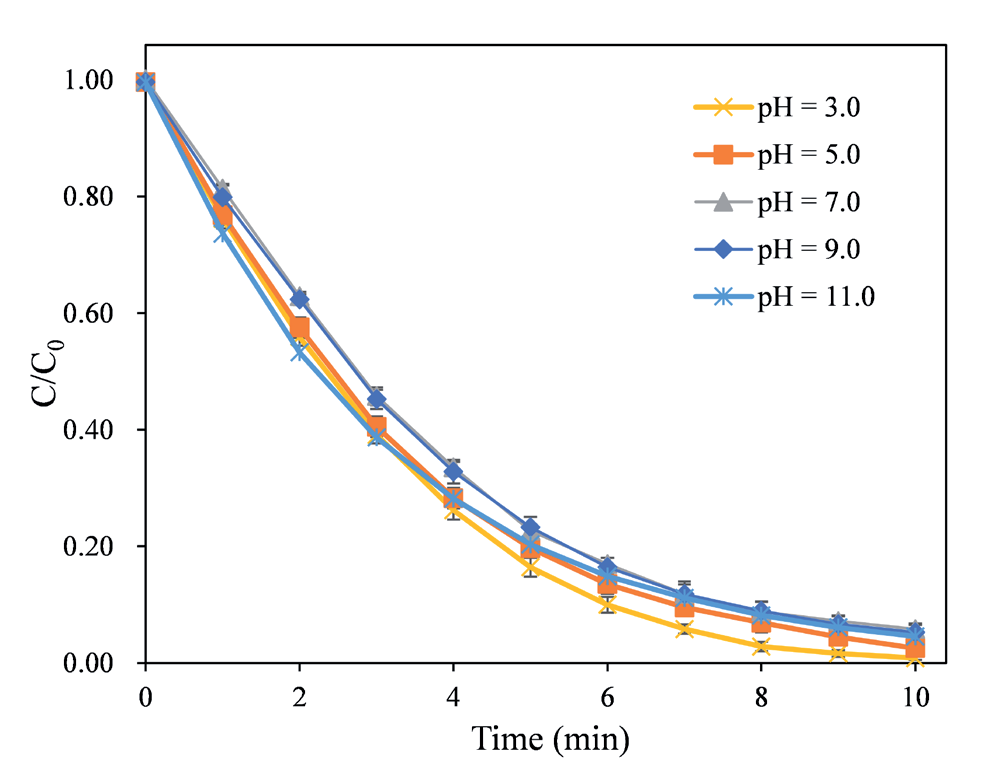
As depicted in Fig. 4, compared to neutral and acidic conditions, the reaction rate slightly increased under acidic conditions, in line with earlier research findings [18]. This phenomenon might be explained by the following reasons: (1) Under both acidic and neutral conditions, the primary radicals in the UV/PS system are SO4-∙. As the pH increases, SO4-∙ is gradually converted into HO•, which has a lower redox potential (Eq. (3)) [19]. Furthermore, ∙OH could be further transformed into O-∙, which has an even lower redox potential, under alkaline conditions (Eq. (4)) [20]; (2) Under acidic conditions, the redox potential of ∙OH is higher (2.7 V) compared to that under neutral conditions (1.8 V) [21];
Fig. 1.
The degradation of TNZ in the UV, PS and UV/PS process. Conditions: initial concentration of TNZ = 40 μM, dosages of PS = 0.3 mM, temperature = 25ºC, pH = 7.0, UV power = 14 W. The regression equations of TNZ degradation in the UV/PS process is y = e0.2892x (R2 = 0.998).
(3) The quantum efficiency of PS photo-dissociation is almost unaffected by pH changes. However, under strongly acidic conditions, the dissociation of PS in aqueous solution is enhanced [22].
Effects of the Water Matrix
Chloride ions (Cl-), bicarbonate ions (HCO3-), sulfate ions (SO42-), and nitrate ions (NO3-) were added to the UV/PS reaction system to investigate the effects of common inorganic ions in the water matrix on the degradation process.
According to the illustration in Fig. 5a), when 0.1 mM Cl- was added to the reaction system, a slight promoting effect on the degradation process was observed, with the reaction rate constant increasing from 4.82×10⁻³ s-1 to 5.14×10⁻³ s-1 and the degradation efficiency of TNZ showing a modest enhancement from 94.1% to 95.5%. However, when the chloride ion concentration was increased to 1 mM, the reaction rate constant decreased to 3.95×10⁻³ s-1 with 91.6 % degradation efficiency of TNZ, and a further increase to 10 mM resulted in a reduction of the rate constant to 2.87×10⁻³ s-1 as well as the degradation efficiency of TNZ to 83.2%. This phenomenon could be explained as follows: at low chloride ion concentrations, Cl- could react with excess SO4-∙ and ∙OH in the system to generate Cl∙ (Eqs. (5)-(7)) [22], which has a comparable oxidation capability (redox potential of 2.4 V) to these radicals, thus exhibiting a slight promoting effect on the degradation process. On the other hand, at high chloride ion concentrations, Cl∙ reacts with excess Cl- to form Cl2-∙ (Eq. (8)) [23], which has a much lower redox potential (1.36 V) compared to SO4-∙, ∙OH, and Cl∙. The formation of large amounts of Cl2-∙ consumes Cl∙ and indirectly depletes SO4-∙ and ∙OH, thereby significantly inhibiting the degradation process.
Fig. 2.
Effects of dosages of PS on the TNZ degradation in the UV/PS process. Conditions: initial concentration of TNZ = 40 μM, temperature = 25ºC, pH = 7.0, UV power = 14 W.
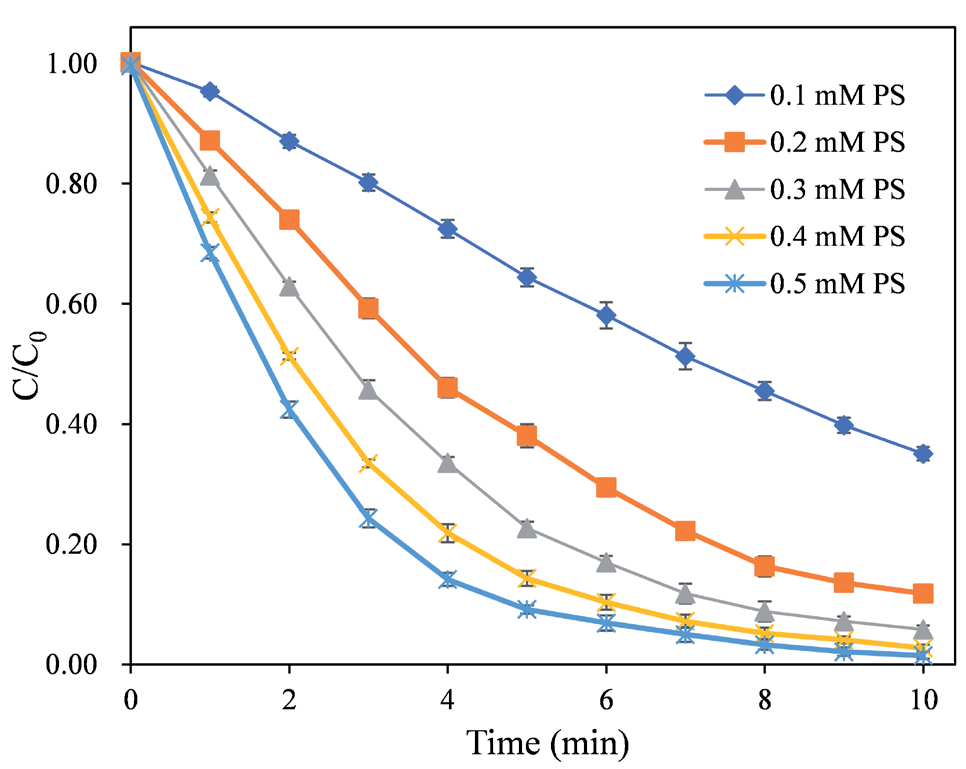
Fig. 3.
Effects of UV power on the TNZ degradation in the UV/PS process. Conditions: initial concentration of TNZ = 40 μM, dosages of PS = 0.3 mM, pH = 7.0, temperature = 25ºC.
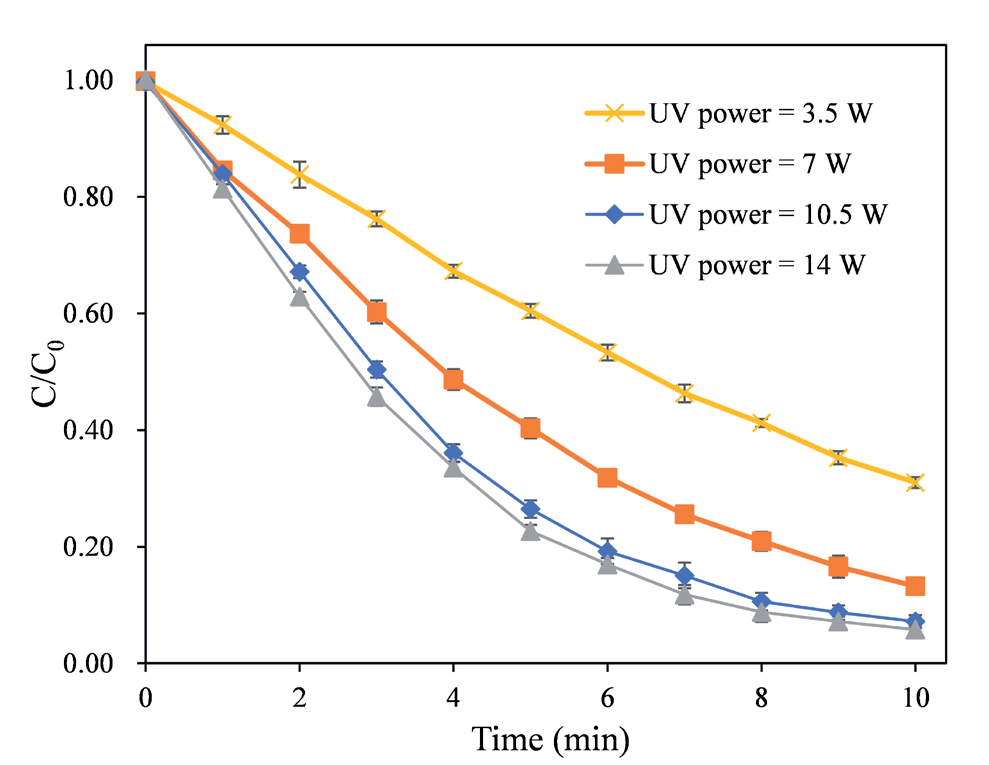
Fig. 4.
Effects of pH on the TNZ degradation in the UV/PS process. Conditions:initial concentration of TNZ = 40 μM, dosages of PS = 0.3 mM, temperature = 25ºC, UV power = 14 W.
As revealed in Fig. 5b), introducing 0.1 mM and 1 mM HCO3- into the reaction system had almost no effect on the degradation process. Even when the concentration was increased to 10 mM, only a slight reduction in the reaction rate was observed. HCO3- could react with SO4-∙ and ∙OH to form carbonate radicals (CO3-∙) (Eqs. (9) and (10)) [22]. Although the reaction rate constant of CO3-∙ with organic pollutants is slightly lower, the higher concentration of CO3-∙ could partially compensate for the decrease in reaction rate [24, 25]. As a result, the reaction rate remained relatively stable, which is consistent with the previous studies’ findings [13].
Fig. 5c) shows that adding SO42- to the reaction system resulted in stable degradation efficiency and reaction rates, which is aligned with the findings reported by Chen et al. [26]. This is attributed to the fact that SO42- reacts very slowly with ∙OH and SO4-∙, thus having almost no impact on the degradation process [27].
Generally, NO3- exhibits two opposing effects in AOPs: (1) Under UV irradiation, NO3- can generate O-∙, which is further transformed into ∙OH (Eqs. (11) and (12)), thereby promoting the degradation reaction; (2) NO3- can react with SO4-∙ generated in the UV/PS process to form NO3∙ (Eq. (13)) [28], which has a weaker oxidation capability, thus inhibiting the degradation reaction. As indicated in Fig. 5d), NO3- had almost no effect on the degradation process. This might be attributed to the fact that the promoting and inhibiting effects of NO3- were approximately balanced, resulting in minimal overall impact on the degradation efficiency.
The Role of Radicals
Quenching experiments were conducted to identify the radicals present in the reaction system, as different types of quenchers exhibit varying reactivity toward radicals. According to previous literature, tert-butanol (TBA) reacts rapidly with ∙OH (k = 3.8-7.6×10⁸ M-1∙s-1) but slowly with SO4-∙ (k = 4.0-9.7×10⁵ M-1∙s-1), making TBA a suitable quencher for hydroxyl radicals [18]. Methanol (MeOH), on the other hand, reacts with ∙OH at a second-order reaction rate constant of 9.7×10⁸ M-1∙s-1 and with SO4-∙ at a second-order reaction rate constant of 0.2-2.5×10⁷ M-1∙s-1 [29], allowing MeOH to serve as a quencher for both hydroxyl and sulfate radicals.
As shown in Fig. 6, when 0.15 M TBA was added to the UV/PS reaction system, the degradation efficiency of TNZ within 10 min decreased from 94.1% to 83.5%, and the reaction rate constant decreased from 4.82×10⁻³ s-1 to 2.81×10⁻³ s-1. The significant inhibitory effect of TBA on the degradation process indicates the presence of ∙OH in the reaction system. When 0.15 M MeOH was introduced, the degradation efficiency of TNZ within 10 min dropped sharply to 38.8%, with a corresponding reaction rate constant of 8.33×10⁻⁴ s-1. The much stronger inhibitory effect of MeOH compared to TBA suggests that both SO4-∙ and ∙OH coexist in the reaction system, with SO4-∙ playing a dominant role in the degradation process.
Fig. 5.
Effects of water matrix on the TNZ degradation in the UV/PS process. Conditions: initial concentration of TNZ = 40 μM, dosages of PS = 0.3 mM, dosages of Cl- = 0-10 mM, dosages of NaCl = 0-10 mM, dosages of NaHCO3 = 0-10 mM, dosages of Na2SO4 = 0-10 mM, temperature = 25 ºC, pH = 7.0, UV power = 14 W.
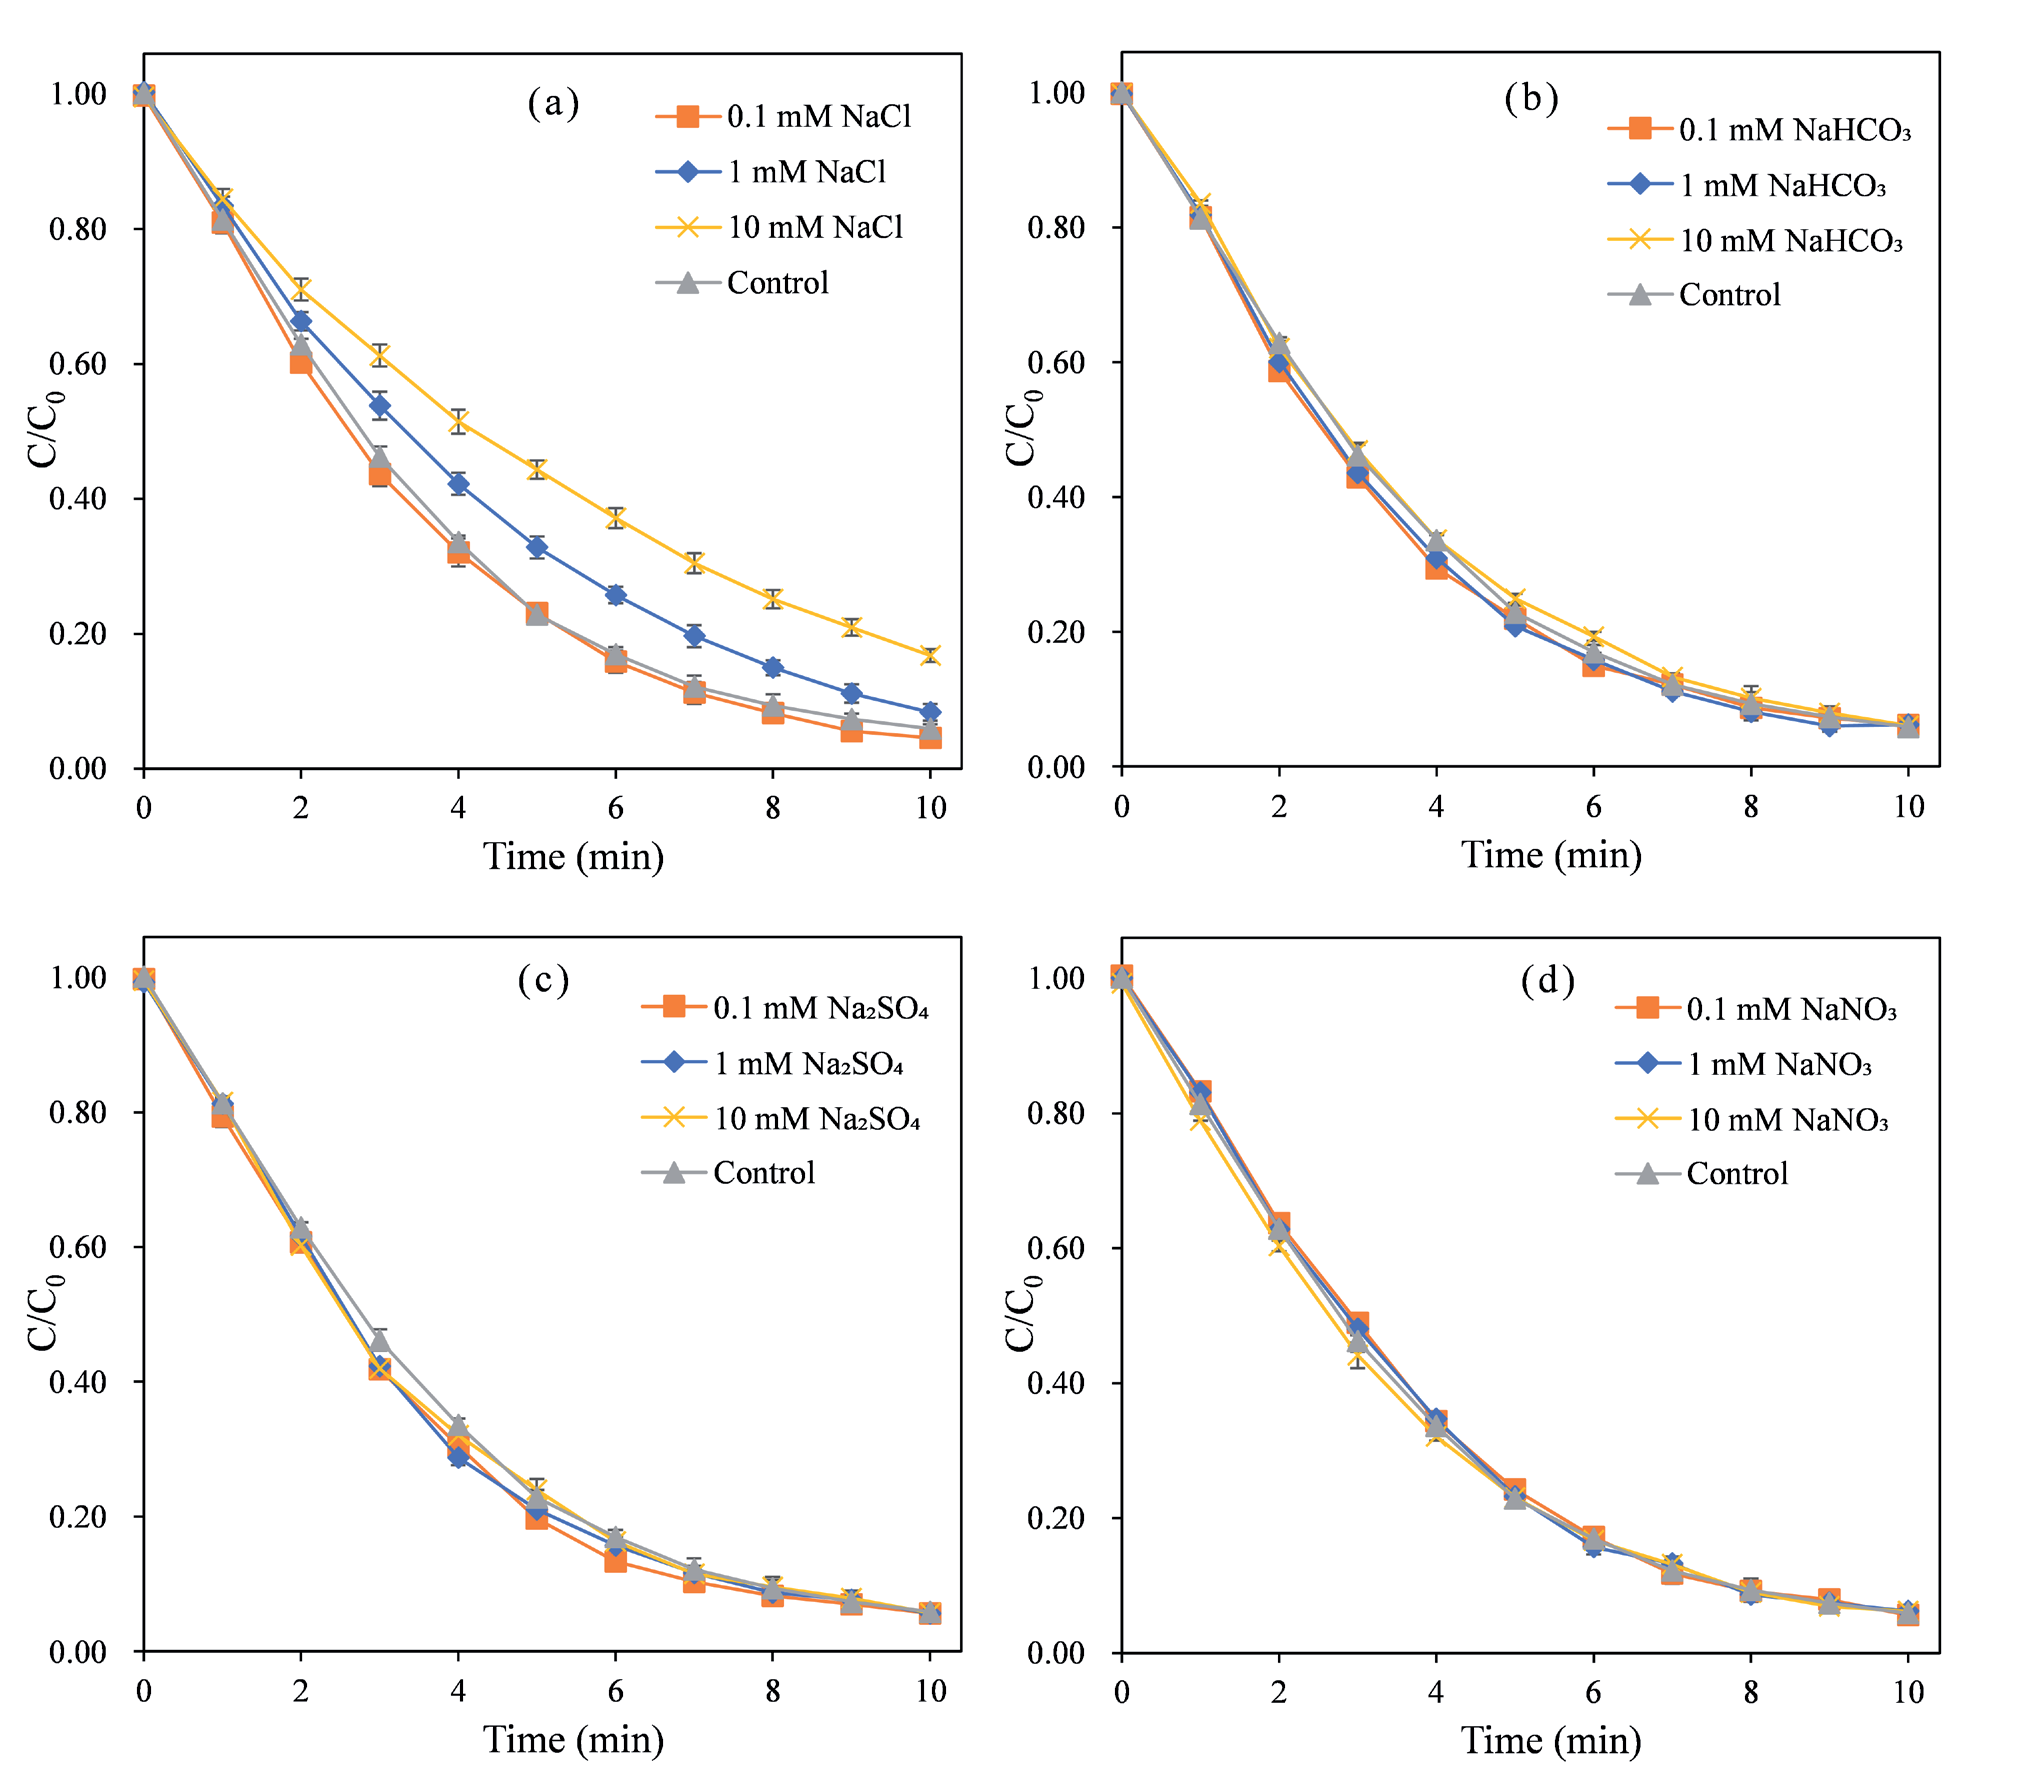
Fig. 6.
The influence of ethanol, methanol and tert-butanol on the degradation of TNZ in the UV/PS process. Conditions: initial concentration of TNZ = 40 μM, dosages of PS = 0.3 mM, temperature = 25ºC, pH = 7.0, UV power = 14 W.
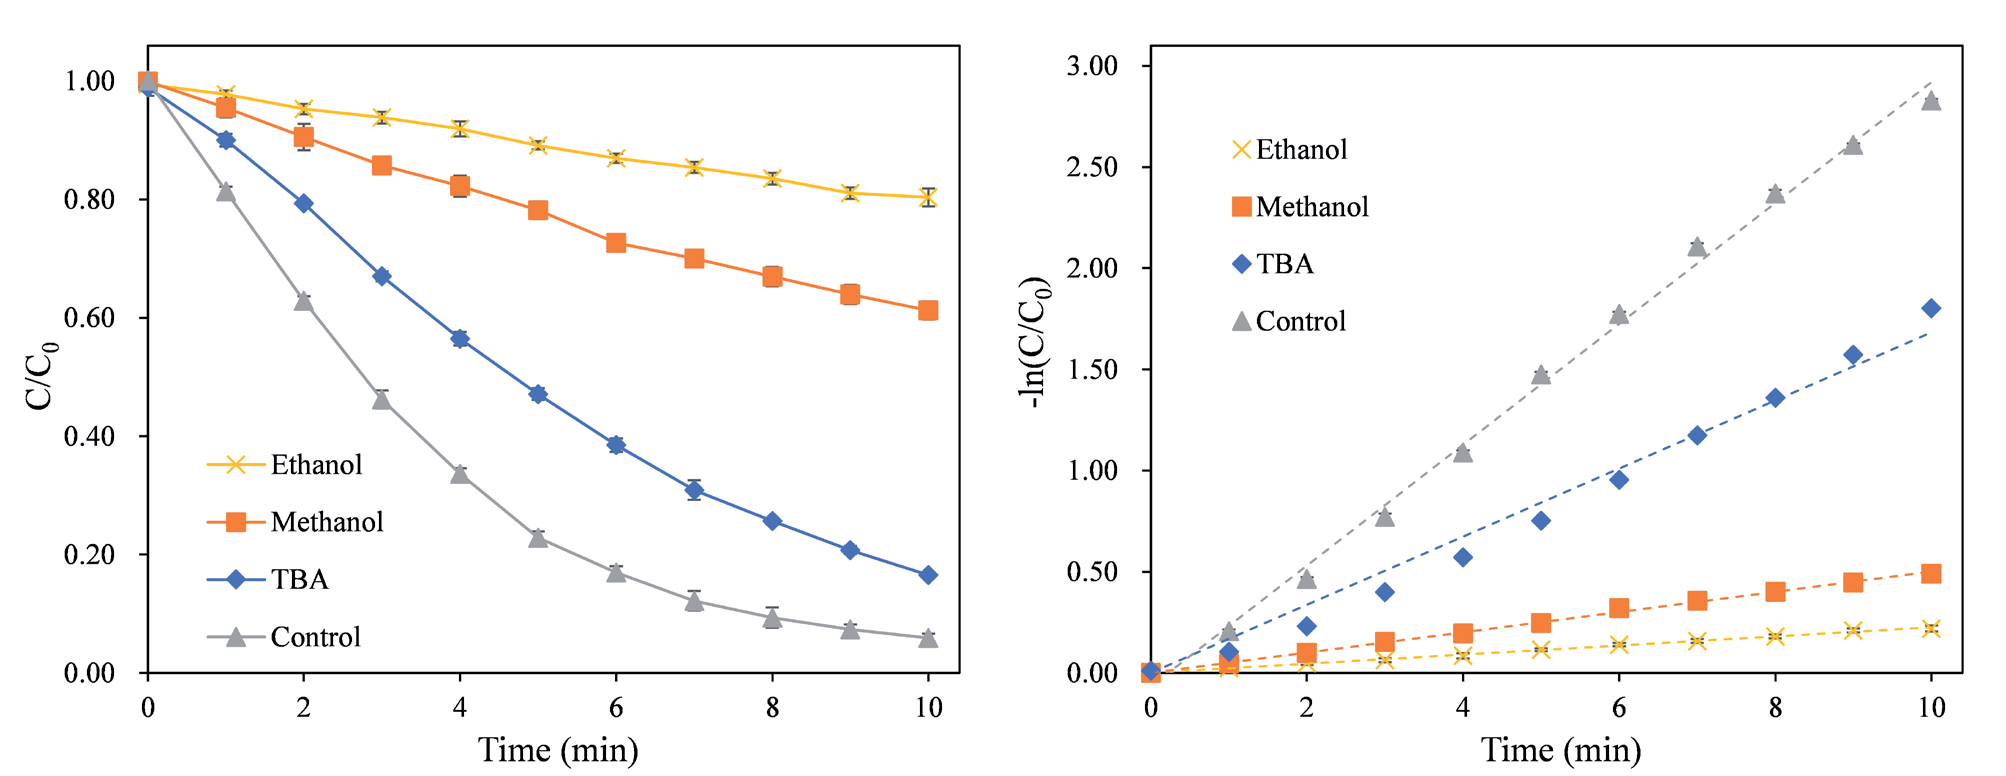
To further validate this conclusion, ethanol (EtOH), which exhibits even higher reactivity toward radicals, was introduced into the reaction system. Compared to MeOH, EtOH has higher rate constants for reactions with SO4-∙ (k = 1.6-7.7×10⁷ M-1 s-1) and ∙OH (k = 1.2-2.8×10⁹ M-1 s-1) [30]. After adding 0.15 M EtOH to the reaction system, the degradation efficiency of TNZ within 10 min further decreased to 19.6%, with a corresponding reaction rate constant of 3.75×10⁻⁴ s-1. These results further confirm the above conclusion.
Economic Optimization
Based on preliminary experimental data, it is evident that dosages of PS, UV power, and reaction time significantly influence degradation efficiency. This study employed response surface methodology (RSM) combined with BBD to optimize the process. A polynomial model was established with the degradation efficiency of TNZ as the dependent variable and dosages of PS, UV power, and reaction time as independent variables. To ensure that the degradation efficiency of TNZ falls within a high-performance range, the ranges of the independent variables were determined based on preliminary studies and literature, as shown in Table 1.
The ranges of the independent variables listed in Table 1 were imported into the Design Expert software, generating 17 experimental runs (Table 2). After conducting the experiments, 17 sets of actual degradation efficiency values were obtained. These experimental values were then input into the software, resulting in a quadratic polynomial model as shown in Eq. (14), where Y represents the degradation efficiency of TNA, A represents the dosages of PS in mM, B represents the power of the ultraviolet lamp in watts (W), and C represents the reaction time in minutes (min).
(14)
Table 1.
Ranges and levels of the variables for experimental design.
| Variables | Code | Unit | Ranges and levels | ||
|---|---|---|---|---|---|
| -1 | 0 | 1 | |||
| Dosages of PS | A | mM | 0.1 | 0.3 | 0.5 |
| UV power | B | W | 3.5 | 8.75 | 14 |
| Reaction time | C | min | 5 | 9 | 13 |
Table 2.
Experimental design matrix and the value of responses.
Model Analysis
The model’s suitability was evaluated using an analysis of variance (ANOVA) [31, 32]. The model F-value of 235.48 indicates that the model is significant. The “Lack of Fit F-value” of 2.73 suggests that the lack of fit is not significant relative to the pure error. The “Pred R-Squared” value of 0.9629 is in reasonable agreement with the “Adj R-Squared” value of 0.9925. “Adeq Precision” measures the signal-to-noise ratio, with a ratio greater than 4 being desirable. A ratio of 49.503 indicates an adequate signal. This model can be used to navigate the design space. Based on these model metrics, it can be concluded that the quadratic polynomial model (Eq. (14)) effectively reflects the relationship between TNZ degradation efficiency and the variables of dosages of PS, UV power, and reaction time (Table 3).
Construction of the Objective Function
The operating costs of the UV/PS process primarily consist of two components: (1) the electrical energy consumption during the degradation process, specifically the energy consumed by the UV lamp, and (2) the cost of chemicals, namely the potassium persulfate.
The concept of electrical energy per order (EE/O, kW∙h/m3/order) was introduced to calculate electrical energy consumption. EE/O represents the electrical energy required to reduce the concentration of a pollutant by one order of magnitude in 1 m³ of the reaction solution, as calculated by Eq. (15) [14]. In the equation, P denotes the power of the UV lamp in W, t represents the operating time of the UV lamp in min, and V is the volume of the reaction solution in cubic meters (m3). Similarly, the concept of PS cost was introduced, representing the cost of the potassium persulfate required to reduce the pollutant concentration by one order of magnitude in 1 m3 of the reaction solution. Therefore, the total operating cost of the UV/ PS process is the sum of the electrical energy cost and the potassium persulfate cost, as expressed in Eq. (16). By substituting the local industrial electricity price and the industrial price of potassium persulfate into Eq. (16), Eq. (17) was derived, where total operating cost represents the total operating cost of the process to reduce TNZ in 1 m3 of solution or wastewater by one order of magnitude, expressed in units of CNY/m3/order; A denotes the dosages of PS, measured in mM; B represents the power of the ultraviolet lamp, measured in W; and C is the time required to achieve 90% degradation efficiency, measured in min. The detailed calculation process is provided in Supplementary Material S1.
Table 3.
Analysis of variance for the quadratic model of TNZ degradation in the UV/PS process.
Optimal Operating Condition Solution
The above problem can be summarized as a mathematical model shown in Eq. (18), which aims to minimize the objective function total operating cost under the constraints of dosages of PS, UV power, reaction time, and total degradation efficiency. Using the NumPy and SciPy libraries in Python, along with the minimize function, the optimal operational conditions were calculated, as presented in Table 4. The Python code for this calculation is provided in Supplementary Material S2. Under the optimal conditions listed in Table 4, validation experiments were conducted. The results showed that the degradation efficiency of TNZ reached 89.29%, which is in close agreement with the model-predicted value of 90%, thereby confirming the model’s reliability.
Conclusions
The UV/PS process demonstrated high efficiency in degrading TNZ in water, achieving a degradation efficiency of 94.1% within 10 min. The reaction followed pseudo-first-order kinetics, with a rate constant of 4.82×10⁻³ s-1, under 40 μM initial concentration of TNZ, 0.3 mM dosages of PS, 25ºC temperature, 7.0 pH, and 14 W UV power. Increasing PS dosages or UV lamp power enhanced the degradation process by promoting the generation of radicals. Overall, the effect of pH on the degradation process was limited, with a slight increase in degradation efficiency observed only under strongly acidic conditions, while neutral and alkaline conditions showed little difference. In the water matrix, Cl- had a significant impact on the degradation process. Low Cl- (0.1 mM) concentrations exhibited a slight promoting effect, whereas higher concentrations (1 mM and 10 mM) showed significant inhibition. In contrast, HCO3-, SO42-, and NO3- had almost no effect on the degradation process. To identify the radicals present in the reaction system, quenching experiments were conducted by adding MeOH, EtOH, and TBA to the system. The results indicated that both SO4-∙ and ∙OH coexisted in the oxidation process, with SO4-∙ playing a dominant role.
Response surface methodology combined with Box-Behnken design was employed to construct a quadratic polynomial model with TNZ degradation efficiency as the dependent variable and dosages of PS, UV power, and reaction time as independent variables. ANOVA analysis revealed that the model was significant, with a “Pred R-Squared” of 0.9629 in reasonable agreement with the “Adj R-Squared” of 0.9925, indicating that the quadratic polynomial model effectively reflected the relationship between TNZ degradation efficiency and the variables. An objective function for total operating cost was established to determine the optimal operational conditions for the UV/PS process, considering both electrical energy consumption and potassium persulfate costs. Using Python software with NumPy and SciPy libraries, the optimal operational conditions were calculated as follows: dosages of PS of 0.4202 mM, UV power of 9.9311 W, and reaction time of 7.0526 min. Validation experiments conducted under these conditions yielded a TNZ degradation efficiency of 89.29%, which closely matched the model-predicted value of 90%. At this optimal condition, the total operating cost was minimized to 1.3970 CNY/m3/order.

