Introduction
As one of the most pivotal medical advancements in human history, antibiotics have saved countless lives with their application in the medical industry. Nevertheless, the abuse of antibiotics in the medical field has sparked widespread concern in recent years [1]. A significant challenge arises from the fact that most antibiotics are not fully metabolized by humans, leading to antibiotics being released into the natural environment via feces and urine [2]. Moreover, the extensive use of antibiotics in the livestock industry, particularly the administration of antibiotics in animal feed as a prophylactic measure against bacterial infections, further exacerbates the risk of antibiotic contamination in the environment [3].
Chloramphenicol (CAP), a prototypical antibiotic, has been widely employed in recent years due to its cost-effectiveness and broad-spectrum antibacterial activity [4]. Potential sources of CAP contamination in aquatic environments encompass pharmaceutical manufacturers, sewage treatment plants, and hospital wastewater treatment facilities [5]. Kimosop et al. [6] observed concentrations of CAP ranging from 60 to 100 ng/L in some hospital wastewater. Furthermore, CAP concentrations as high as 100-500 ng/L have been detected in some wastewater treatment systems [7-9]. It has been documented that the presence of CAP in natural surface waters, with concentrations of 1-15 ng/L identified in Singapore’s surface water sources [10] and 15.52-24.35 ng/L in Malaysian rivers [11]. Relevant literature has also been reported in China, where CAP as high as 11-266 ng/L was found in the Pearl River [12], and 4.2-28.4 ng/L CAP was found in the Huangpu River in Shanghai [13]. Notably, many of these rivers serve as drinking water sources, posing a significant concern. Unwitting ingestion of antibiotics, even under healthy conditions, will promote bacterial resistance, exacerbating the challenge of finding effective treatments against bacterial infections. Moreover, studies have shown that CAP, which readily bioaccumulates through the food chain into humans, exhibits bone marrow toxicity and may lead to aplastic anemia [14, 15]. Owing to the antibacterial nature of CAP, traditional biological treatment processes struggle to achieve satisfactory results. Consequently, oxidation-based processes have garnered increasing attention [16, 17].
Advanced oxidation processes (AOPs), renowned for their exceptional oxidative capabilities, have been noticed as a research frontier in recent years for the degradation of recalcitrant organic compounds such as personal care products and antibiotics [18, 19]. Within this category, various means, including heat, transition metals, photocatalysts, ultrasonics, and ultraviolet (UV) radiation, are employed to activate oxidants, generating free radicals that subsequently oxidize organic pollutants [20]. However, thermal activation, due to the large specific heat capacity of water, necessitates substantial energy consumption to elevate water temperatures, thereby limiting its applicability. While transition metal-mediated activation demonstrates effectiveness, its high cost and the toxicity of most transition metal ions pose challenges for large-scale implementation in water treatment processes. Nanocatalysts, though promising, face difficulties in practical applications due to difficulties in recovery and susceptibility to poisoning after repeated use. Among these, clean and green activation methods have garnered significant attention, particularly in settings with limited technological resources, such as remote islands, where ecological sensitivity is high and constraints exist in terms of sewage treatment equipment, chemicals, and recovery conditions.
In recent years, UV-based advanced oxidation (UV-AOPs) processes have emerged as a research focus and highlight the degradation of CAP due to their green, environmentally friendly, and non-secondary pollution characteristics. Despite the promising overall degradation efficiency achieved by previously reported UV-AOPs, these methods often suffer from prolonged retention time. For instance, Rizzo et al. [21] achieved near-complete degradation of CAP within 2 hours using the UV/hydrogen peroxide (UV/H2O2) process. Similarly, Tan et al. [22] reported a degradation efficiency exceeding 90% with the UV/persulfate (UV/PS) process, but this was also accompanied by a long retention time of approximately 2 hours, resulting in the electrical energy per order (EE/O) of 16.76 kWh/m³/order.
As the current economic inefficiency of UV-based processes, this study aims to explore more efficient and cost-effective alternative technologies. Previous experiments and literature reviews have revealed that the UV/PMS (peroxymonosulfate) process exhibits promising performance in degrading various organic pollutants, particularly in the treatment of oxytetracycline, another antibiotic, where it outperformed UV/H2O2 significantly [23]. However, to our knowledge, there is a lack of reported assessments on the degradation efficiency of CAP with PMS activated by UV, let alone VUV. Compared to UV lamps, VUV lamps could emit light at 185 nm, featuring a shorter wavelength and higher photon energy, which holds the promise of further reducing the retention time required for the oxidation process and, consequently, lowering the overall energy consumption, rendering it more economically viable for industrial applications. Additionally, VUV retains the environmentally friendly advantages of UV. Therefore, the combination of VUV with PMS represents a highly promising process for the oxidative degradation of antibiotics, potentially enabling stable operation at a lower cost while achieving green and efficient degradation of pollutants. Consequently, this study endeavors to investigate the degradation efficiency of CAP by the VUV/PMS process and optimize the process parameters utilizing RSM, thereby offering an environmentally friendly and cost-effective CAP treatment approach that combines high effificiency with low costs.
Materials and Methods
Chemical
Peroxymonosulfate (KHSO5·0.5KHSO4·0.5K2SO4, AR grade) was procured from Aladdin (Shanghai, China). Chloramphenicol was purchased from Biosharp Life Sciences Co., Ltd. (Beijing, China). Ethanol (AR grade) was sourced from Xilong Scientific Co., Ltd. (Guangdong, China). The sulfuric acid standard solution (0.5 M) was acquired from Codow Pharma Tech Co., Ltd. (Guangdong, China). Isopropyl alcohol (AR grade) was purchased from Hengxing Chemical Preparation Co., Ltd. (Tianjin, China). Sodium nitrate standard solution (0.5 M) was obtained from Kermel Chemical Reagents Co., Ltd. (Tianjin, China). Sodium hydroxide (AR grade), sodium chloride (AR grade), and sodium sulfate (AR grade) were purchased from National Chemical Reagent Co. (Chongqing, China). Disodium hydrogen phosphate (AR grade), sodium dihydrogen phosphate (AR grade), and sodium bicarbonate (AR grade) were sourced from Tianjin Damao Chemical Reagent Factory (Tianjin, China). Solutions were prepared with double deionized water (18.2 MΩ cm).
Analysis
The concentration of CAP was measured utilizing the spectrophotometric method. At predetermined time intervals, samples were withdrawn from the reaction mixture and injected into a 1 cm quartz cuvette equipped with an ultraviolet-visible spectrophotometer (Hach DR6000, USA). The absorbance of the samples at 278 nm was then recorded to quantify the CAP concentration [24]. The pH of the solutions was measured using a pH meter (Hanna, HI98107, Italy).
Experimental Procedures
The photodegradation was conducted within a cylindrical glass reactor with a diameter of 10 cm and a height of 30 cm, placed in a constant temperature water bath maintained at 25ºC. A magnetic stirring bar rotating at 400 rpm was positioned at the bottom of the reactor to ensure uniform mixing of the reaction mixture. An ultraviolet lamp (GPH287T5VH/4, 14 W, Heraeus, Germany) encased in a quartz sleeve was vertically inserted into the cylindrical reactor to ensure even distribution of radiation throughout the reaction system. The low-pressure mercury lamp used in the experiment primarily emitted UV light at wavelengths of 185 nm and 254 nm. A specific dosage of PMS was added to 2 L of the reaction mixture, with an initial CAP concentration of 6 μM. Phosphate buffer solution (6 mM) was employed to adjust the pH of the reaction system, as phosphates exhibit negligible interference with radical-mediated oxidation processes [25]. The specific pH adjustment procedure involved slowly adding sulfuric acid or sodium hydroxide to a phosphate buffer solution (6 mM) with an initial pH of 7.0 while continuously monitoring and recording the pH of the solution. The addition of sulfuric acid or sodium hydroxide was halted once the desired pH was achieved. Specific lengths of aluminum foil were used to wrap the UV lamp tube and modulate its power output. Following a designated reaction time, 2.5 mL of the reaction mixture was immediately withdrawn for analysis and measurement.
Response Surface Experiment Design
The degradation process was optimized by RSM, utilizing dosages of PMS, UV power, and reaction time as independent variables, while the degradation efficiency of CAP and the total operating cost of the process serve as the response values for optimization. The Box-Behnken Design (BBD) was adopted for the optimization experiments due to its simplicity and operability. The ranges of the independent variables were determined based on single-factor experiments and previous literature reports, selecting efficient intervals with high degradation efficiency. The specific coded values and ranges are presented in Table 1. A retention time that was too short resulted in insufficient degradation of CAP, failing to achieve the desired degradation effect. Conversely, an excessively long retention time increased electrical consumption while contributing minimally to further enhancements in the degradation efficiency of CAP. According to prior experiments, when the retention time was within the range of 4-14 min, the degradation efficiency of CAP was relatively high. A quadratic polynomial was used to fit and analyze the reactions, facilitated by the Design-Expert 13 software, as shown in Equation (1).
In the Equation, Y represents the response value (degradation efficiency of CAP), β0 denotes the constant term, βi and βii represent the linear and quadratic coefficients, respectively, of the independent variable Xi, βij represents the interaction coefficient between Xi and Xj, and ε stands for the residual term [26].
Results and Discussion
Photodegradation of CAP by VUV Activated PMS
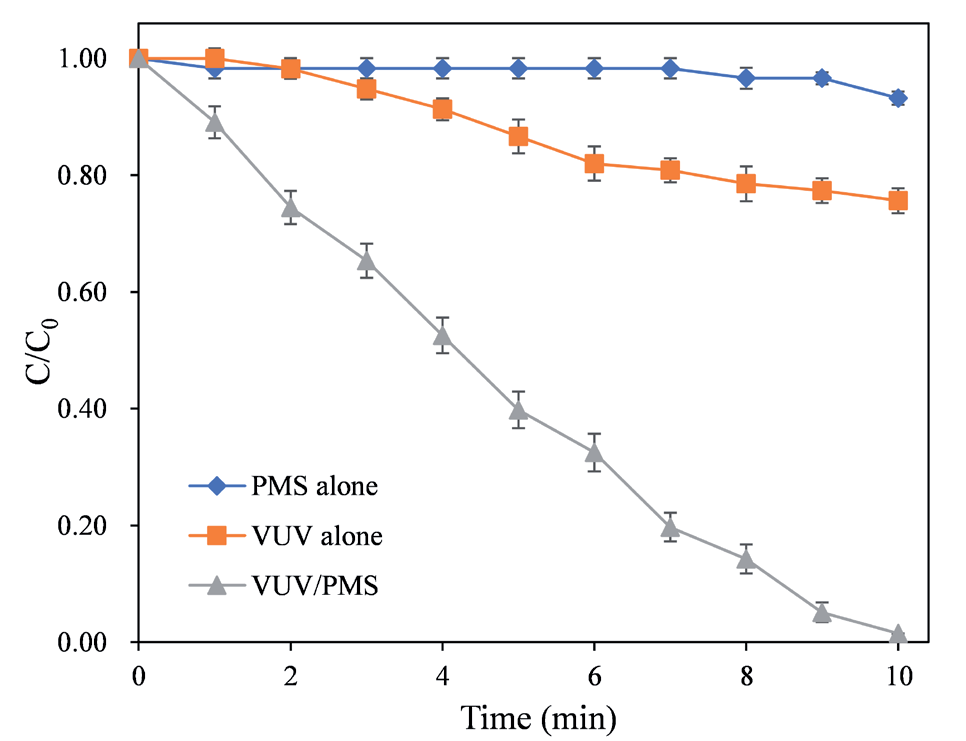
The results of CAP degradation by VUV alone, PMS alone, and the VUV/PMS process were presented in Fig. 1. As shown in the Fig. 1, the degradation efficiency of CAP under VUV alone was 24%, while that under PMS alone was 7%, and the degradation efficiency achieved by the VUV/PMS process was 99% after 10 min. These observations indicated that the efficiency of the VUV/ PMS oxidation process far exceeded that of VUV or PMS acting individually. This superiority stemmed from the stronger oxidizing capacity of the generated radicals compared to PMS. UV radiation could activate and decompose PMS to produce SO4–∙ (sulfate radicals) and •OH (hydroxyl radicals) (Equations (2) and (3)), which possessed redox potentials of 2.5-3.1 V and 1.8-2.7 V, respectively, under neutral conditions. These potentials were higher than that of PMS (1.82 V), enabling the effective degradation of a wide range of pollutants [27-29].
The fitting results of the degradation kinetic models are presented in Table 2. Among the pseudo-zero-order, pseudo-first-order, and pseudo-second-order kinetic models, the pseudo-zero-order model exhibited the highest R2 of 0.993, indicating that the reaction follows pseudo-zero-order kinetics. This finding slightly differed from previous studies but aligned with those on thermally activated PS or PMS [30, 31]. Considering that the second-order reaction rate constants between free radicals and organic pollutants were generally high [32], it could be approximated that the lifetime of free radicals in the reaction system was very short, with virtually all generated radicals being instantly consumed by organic compounds. In comparison with other similar UV-activated PMS studies, the present degradation system featured a larger reactor diameter of 10 cm and a higher reaction volume of 2 L, significantly exceeding those in other comparable investigations. Moreover, the intensity of UV irradiation attenuated rapidly with distance, suggesting that the rate-limiting step might be the photon absorption and decomposition of PMS rather than the concentration of CAP. Consequently, the reaction follows pseudo-zero-order kinetics.
As shown in Fig. 2, when the pH was increased to 11 while other conditions remained constant, PMS was activated under alkaline conditions (where the decomposition rate of PMS has been reported to accelerate significantly at pH values greater than 9.4 [23]). Consequently, the decomposition rate accelerated, resulting in the generation of more free radicals. In this case, the decomposition rate of PMS ceased to be the rate-limiting step, and the degradation rate of CAP significantly decreased as the concentration of CAP decreased. The R2 of the pseudo-second-order kinetics was 0.990 (R2 = 0.756 for the zero-order model and R2 = 0.961 for the first-order model), and the reaction followed the pseudo-second-order kinetics. In this case, the reaction rate was related to both the concentration of CAP and the residual concentration of PMS. This phenomenon verifies the above hypothesis that the reaction conformed to the pseudo-zero-order kinetics under neutral conditions.
Effect of pH
As depicted in Fig. 2, the reaction rate significantly accelerated with the decrease in pH. At pH 5.0, although the overall degradation efficiency was comparable to that at pH 7.0, the reaction rate notably accelerated, with CAP’s concentration decreasing by an order of magnitude within 7 min, resulting in a degradation efficiency of 90%, while under neutral conditions, it was 80%. When pH was adjusted to 3.0, the degradation efficiency approached 90% within approximately 5 min, whereas the degradation efficiency at 5 min was 60% under neutral conditions. This observation aligned with previous research findings, indicating that acidic conditions could enhance the degradation efficiency of the VUV/PMS process. This might be attributed to the fact that under acidic conditions, the redox potential of •OH·is higher, at 2.7 V, exceeding 1.8 V under neutral conditions, thereby accelerating the reaction rate [33].
With the increase in pH, the reaction rate notably accelerated. When the pH rose from 7 to 9, the degradation efficiency of CAP at 7 min increased from 80% to 89%. At pH 11, despite the overall degradation efficiency being lower than under neutral conditions, it is observable that the initial reaction rate was substantially higher than that under neutral conditions. This phenomenon could be attributed to the accelerated decomposition rate of PMS under alkaline conditions, particularly when pH>9.4. Despite the enhanced reaction rate, the overall degradation efficiency at pH 11 was reduced compared to that at pH 7, which could be explained by the excessively rapid decomposition of PMS leading to a significant increase in the number of radicals within a short period. Consequently, excessive radicals underwent self-quenching reactions (Equations (4) and (5)) and self-combination reactions (Equations (6) and (7)), thereby reducing the overall degradation efficiency [34].
Effect of PMS Dosage
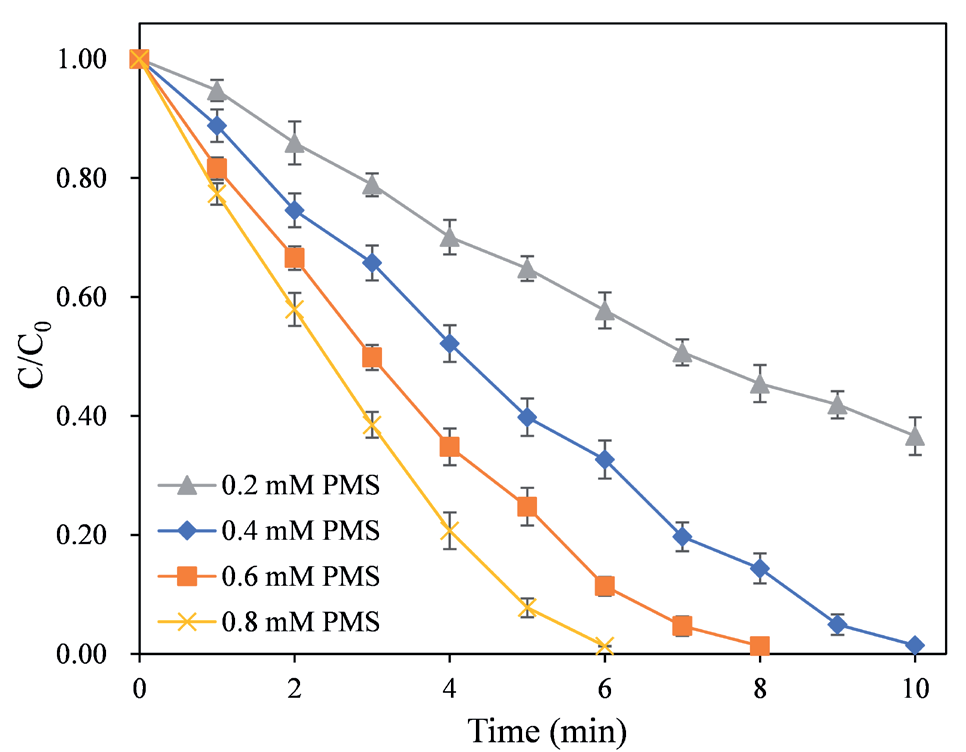
As shown in Fig. 3, when the dose of PMS was 0.2 mM, 0.4 mM, 0.6 mM, and 0.8 mM, the pseudo-zero kinetic rate of the reaction was 6.41×10⁻⁹ mol·L-1·s-1, 1.04×10⁻⁸ mol·L-1·s-1, 1.50×10⁻⁸ mol·L-1·s-1, and 1.96×10⁻⁸ mol·L-1·s-1, respectively. According to previous literature, the increase in dosages of PMS could elicit two primary effects: i) Augmented dosages of PMS led to an increase in the number of radicals generated by VUV-activated PMS, thereby enhancing the degradation of CAP [35]; ii) An excessive amount of PMS resulted in an overabundance of radicals, which underwent self-quenching reactions, diminishing the stimulatory effect on CAP degradation and potentially causing adverse effects. In this study, despite the increase in PMS concentration, the threshold level had not been reached, thus exhibiting a pronounced promoting effect as dosages of PMS increased.
Fig. 2.
Effects of pH on the CAP degradation by the VUV/ PMS process. Conditions: initial concentration of CAP = 6 μM, dosages of PMS = 0.4 mM, temperature = 25ºC, UV power = 14 W.
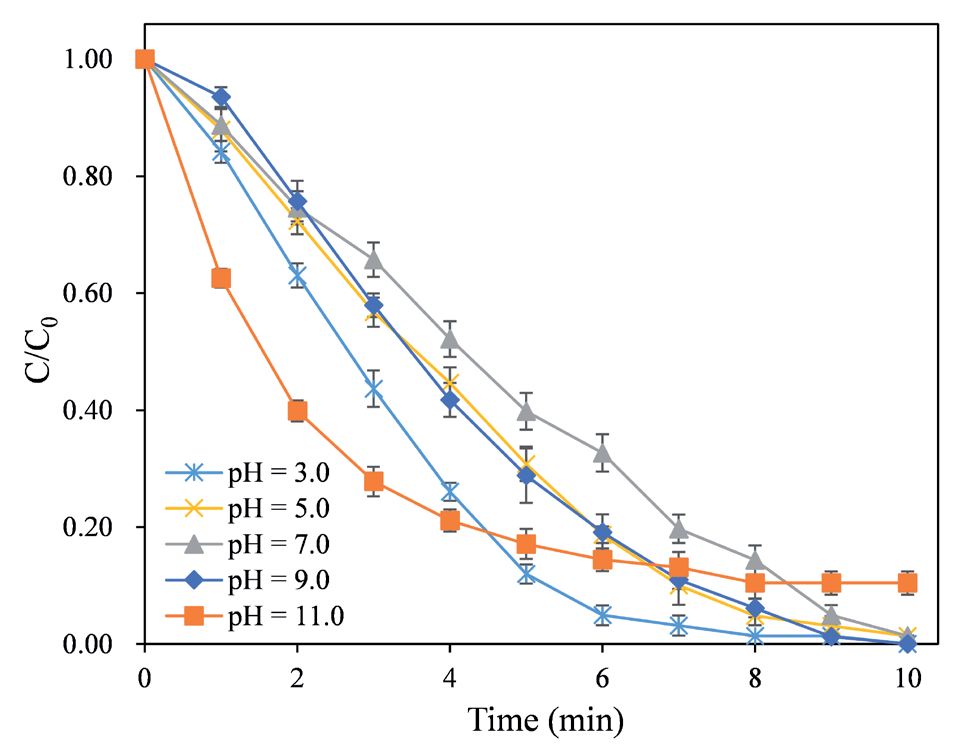
Fig. 3.
Effects of dosages of PMS on the CAP degradation by the UV/PMS process. Conditions: initial concentration of CAP = 6 μM, pH = 7.0, temperature = 25ºC, UV power = 14 W. The regression equations of 0.2 mM PMS, 0.4 mM PMS, 0.6 mM PMS and 0.8 mM PMS on the CAP degradation by the UV/PMS process were y = -0.00641x + 5.82 (R2 = 0.991), y =-0.0104x+5.67 (R2 = 0.993), y = -0.0150x+5.92 (R2 = 0.993) and y = -0.0196x + 6.14 (R2 = 0.994), respectively.
Effect of UV Power
As depicted in Fig. 4, as the UV power increased from 3.5 W to 14 W, the total degradation efficiency of CAP was observed to be 40%, 67%, 90%, and 99%, with the reaction rate of 3.89×10⁻⁹ mol·L-1·s-1, 6.70×10⁻⁹ mol·L-1·s-1, 9.06×10⁻⁹ mol·L-1·s-1, 1.04×10⁻⁸ mol·L-1·s-1, respectively. This phenomenon could be attributed to the enhanced probability of PMS accepting photons as the UV power intensified, thereby accelerating the decomposition rate of PMS and, subsequently, the degradation rate of CAP. Notably, with the increment in UV power, between 3.5 W and 10.5 W, every 3.5 W increase led to a rise in total degradation efficiency of CAP by 27% and 23%, respectively. However, when the UV power was incremented from 10.5 W to 14 W (another 3.5 W increase), the total degradation efficiency of CAP only improved by 9%, significantly less pronounced than the previous increments. It was consistent with previous research on dichloroacetonitrile [36], indicating that the promotional effect of UV power escalation on CAP degradation exhibited a diminishing marginal effect. Once the UV power reached a certain threshold, further increases yield notably diminished benefits to the degradation process, suggesting that blindly enhancing UV power was economically inefficient.
Effects of Water Matrix Components
Chloride ions, bicarbonate ions, sulfate ions, and nitrate ions are common anions in water and are widely distributed in natural water bodies. In this section, sodium chloride, sodium bicarbonate, sodium sulfate, and sodium nitrate were separately added to the reaction system to investigate the effects of these ubiquitous anions in water on the degradation of CAP by the VUV/ PMS process.
As shown in Fig. 5, a negligible difference was observed in overall degradation efficiency upon the addition of chloride ions to the reaction system, but the reaction rate slightly accelerated, indicating a weak promotional effect of chloride ions on CAP degradation. According to previous reports, chloride ions exhibit dual opposing effects on such reactions. At low concentrations, chloride ions enhance the reaction by interacting with SO4–∙ and •OH to generate Cl·(Equations (8)-(10)), which possesses an oxidation-reduction potential of up to 2.4 V, enabling it to oxidize CAP. Furthermore, chloride ions could react with excess PMS to generate Cl·and •OH (Equations (11)-(13)), thereby accelerating the reaction. However, in the presence of excessive chloride ions, the formation of Cl2·with a lower oxidation-reduction potential of 1.36 V occurs through the reaction with Cl·(Equation (14)), which inhibits the reaction [22, 32]. In the present study, the absence of significant inhibitory effects suggested that the concentration of added chloride ions was relatively low, failing to reach the inhibitory threshold, thus resulting in a slightly promotional effect.
Upon the introduction of bicarbonate ions into the reaction system, a notable decrease in the overall degradation efficiency was observed. As the concentration of bicarbonate ions increased from 0.2 mM to 10 mM, the total degradation efficiency diminished from 99% to 45%. This phenomenon could be attributed to two primary reasons: i) The reaction between HCO3- and SO4- ∙or •OH resulted in the formation of CO3-, a significantly weaker oxidant that was ineffective in oxidizing most organic pollutants, as depicted in Equations (15) and (16) [37]; ii) During the quenching process of SO4-∙and •OH by HCO3-, certain intermediates were generated, which hindered the formation of radical chain reactions, thereby impeding the progress of the overall reaction [38].
Following the introduction of sulfate ions into the reaction system, minimal changes were observed in the overall degradation efficiency, which aligned with previous research. The reactions between sulfate ions and •OH or SO4-∙ (Equations (17) and (18)) proceed at a significantly slower rate compared to those with inorganic ions such as chloride and bicarbonate [39]. Consequently, the impact of sulfate ions in the reaction system was negligible.
Fig. 4.
Effects of UV power on the CAP degradation by the VUV/PMS process. Conditions: initial concentration of CAP = 6 μM, dosages of PMS = 0.4 mM, pH = 7.0, temperature = 25ºC.
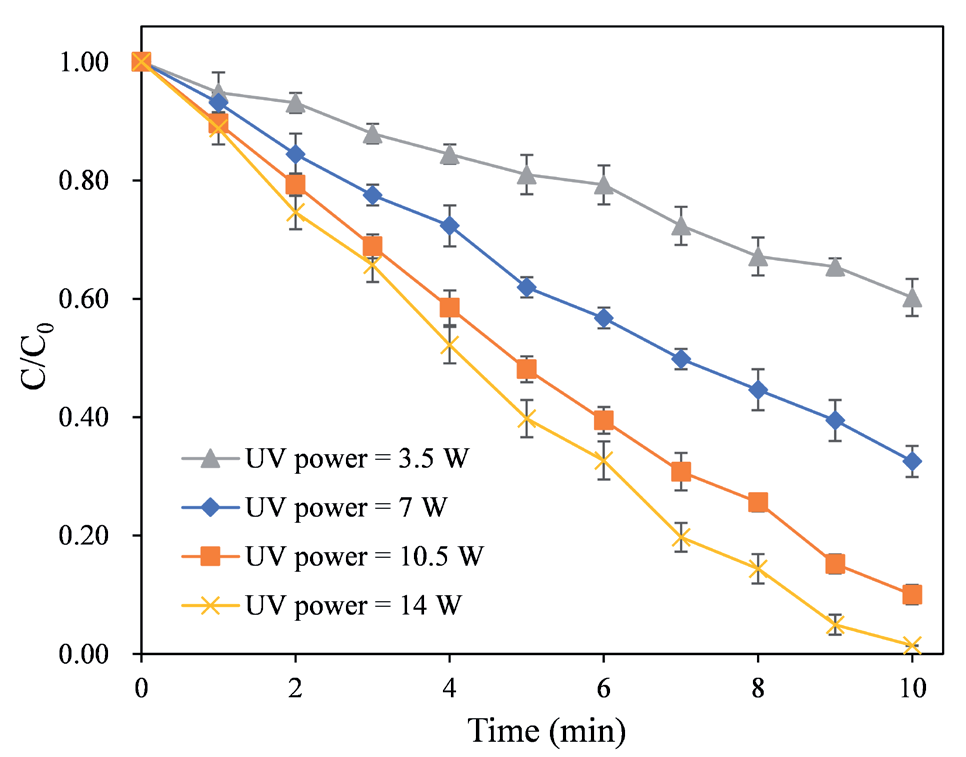
Fig. 5.
The influence of water matrix components on the degradation of CAP by the VUV/PMS process. Conditions: initial concentration of CAP = 6 μM, dosages of PMS = 0.4 mM, temperature = 25ºC, pH = 7.0, UV power = 14 W.
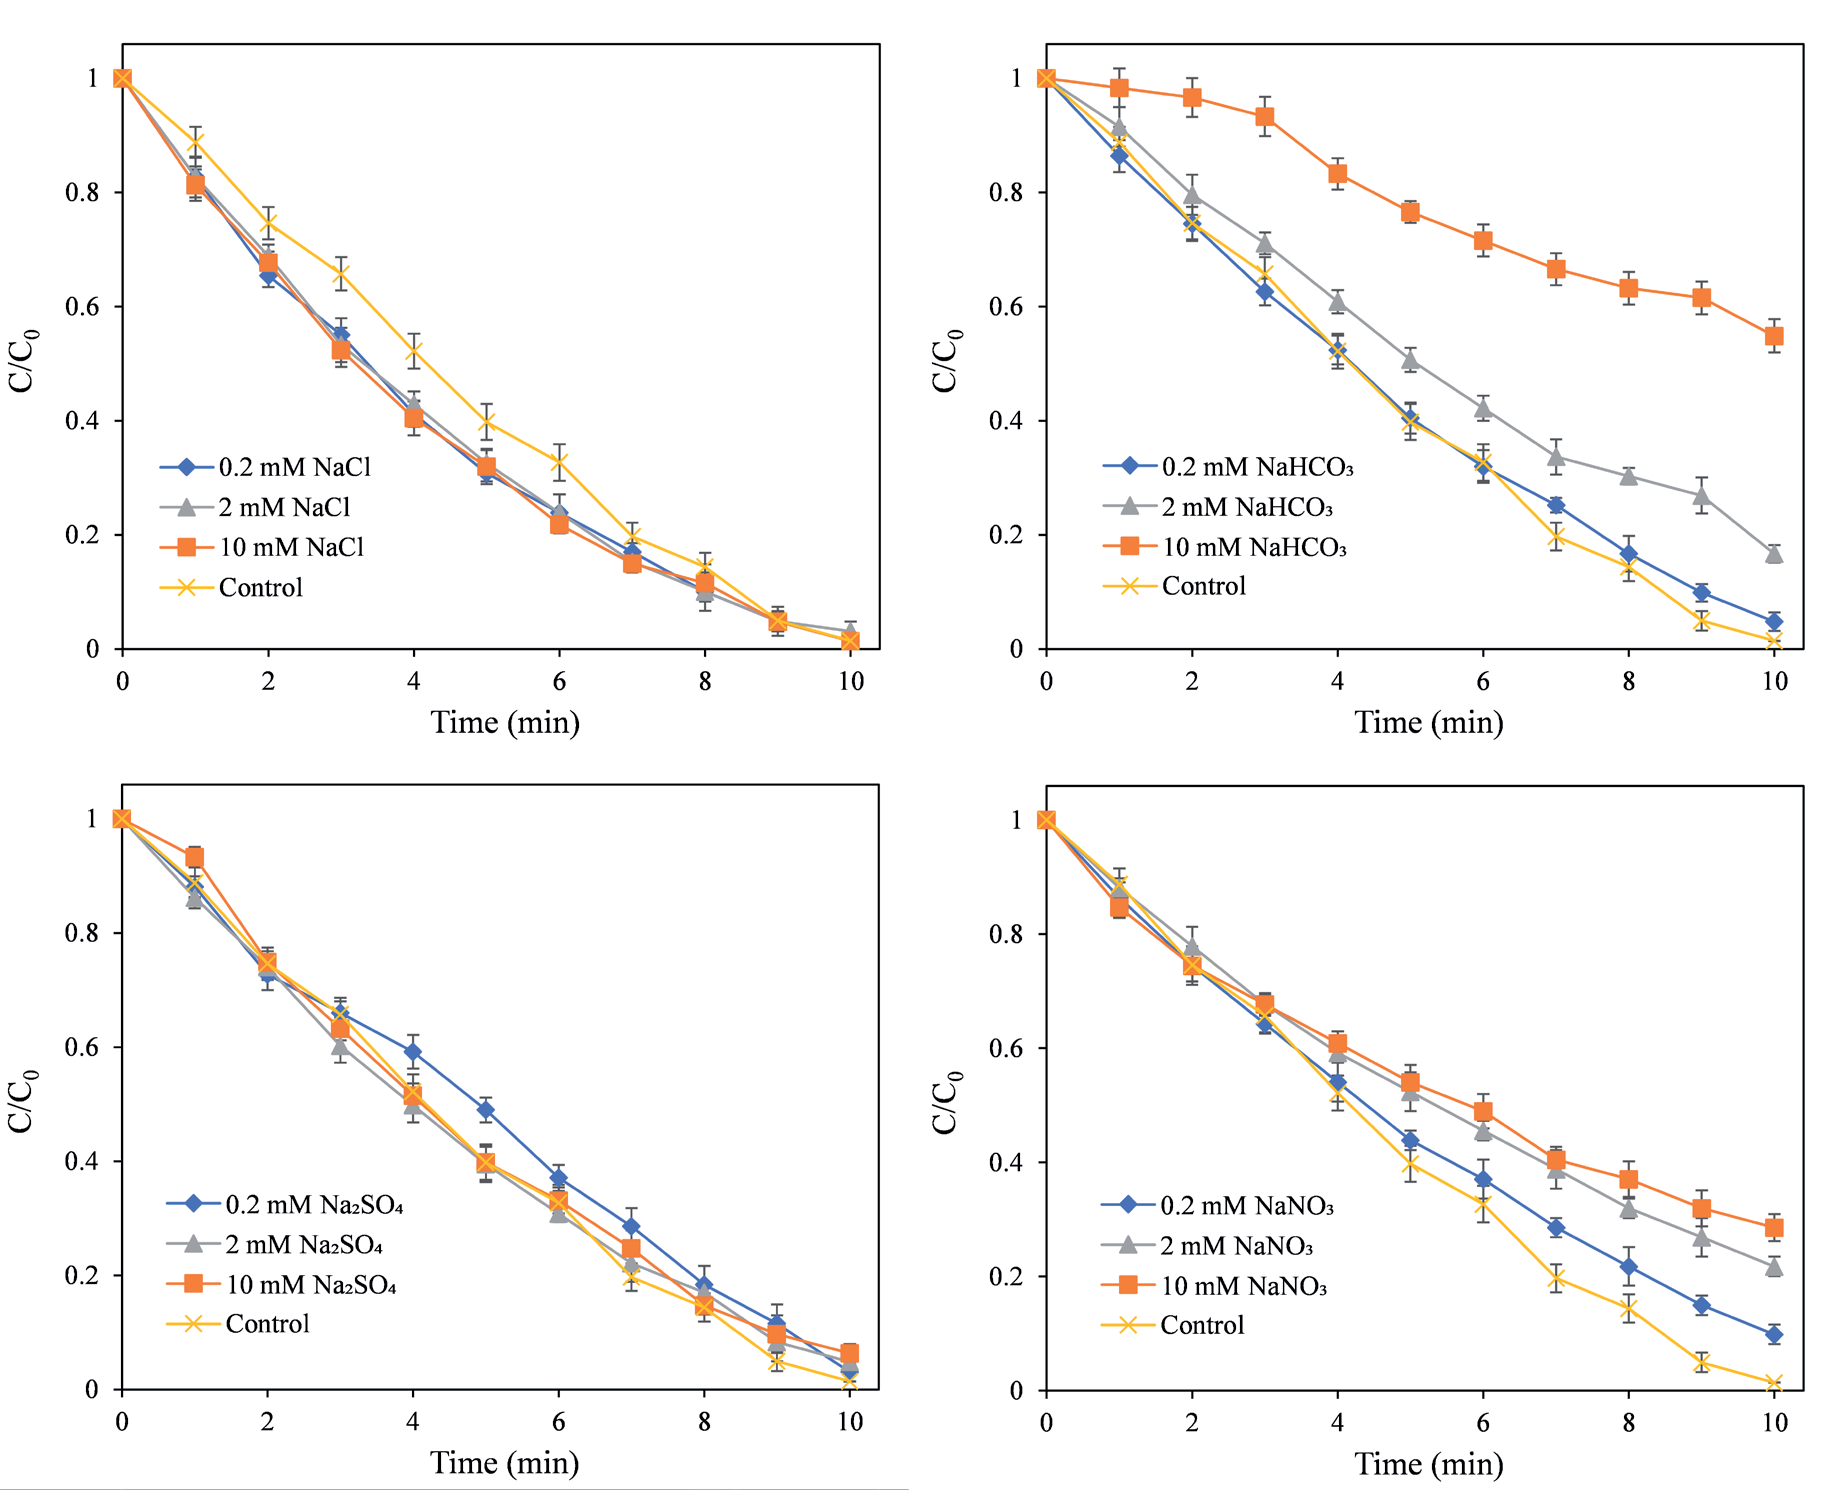
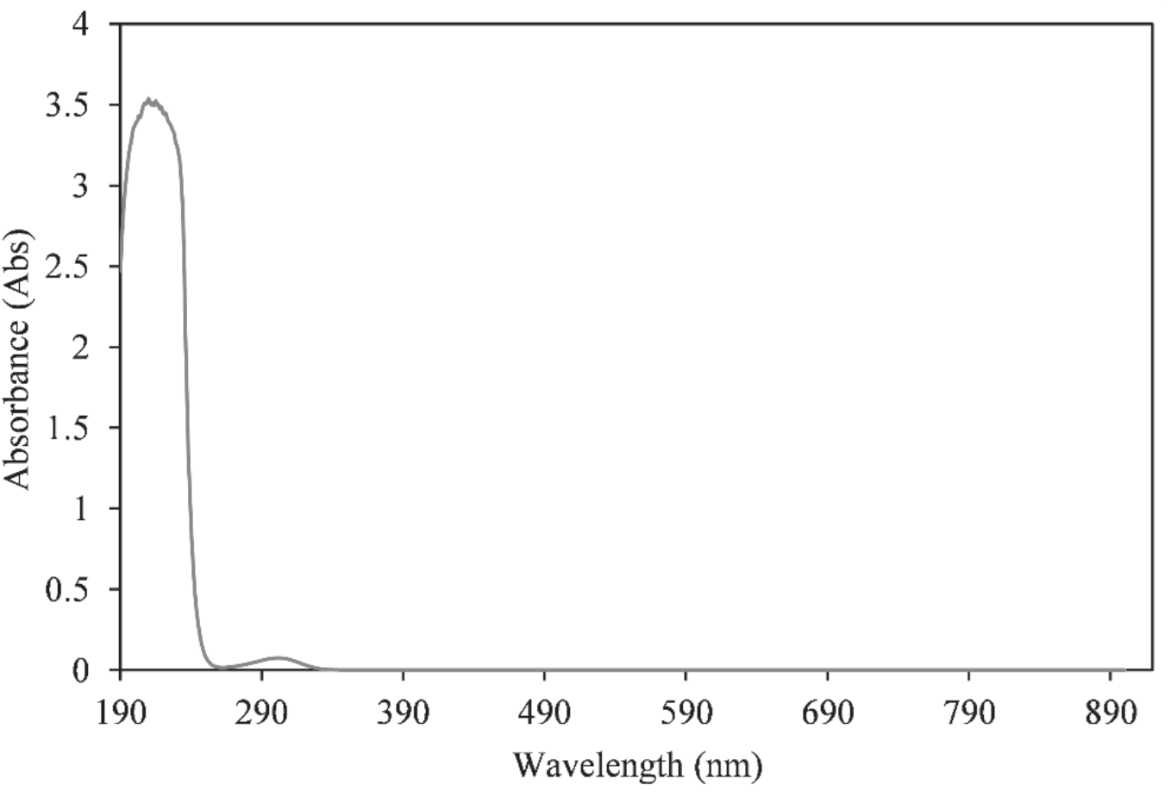
After incorporating nitrate ions within the reaction environment, a notable decrease in the overall degradation efficiency was evident. As the concentration of nitrate ions increased from 0.2 mM to 10 mM, the total degradation efficiency declined from 99% to 72%. This phenomenon could be attributed to the fact that nitrate ions acted as UV-light shields, absorbing UV radiation and consequently reducing the intensity of UV radiation reaching the PMS molecules. This hindered the photodecomposition of PMS, leading to a decrease in the formation of SO4− and •OH. Compelling evidence for this was provided in Fig. S1, showcasing the strong absorbance of nitrate ions within the vacuum ultraviolet and ultraviolet wavelength range, which overlapped with the primary wavelengths (185 nm and 254 nm) emitted by the UV lamp used in this experiment.
The Role of Radicals
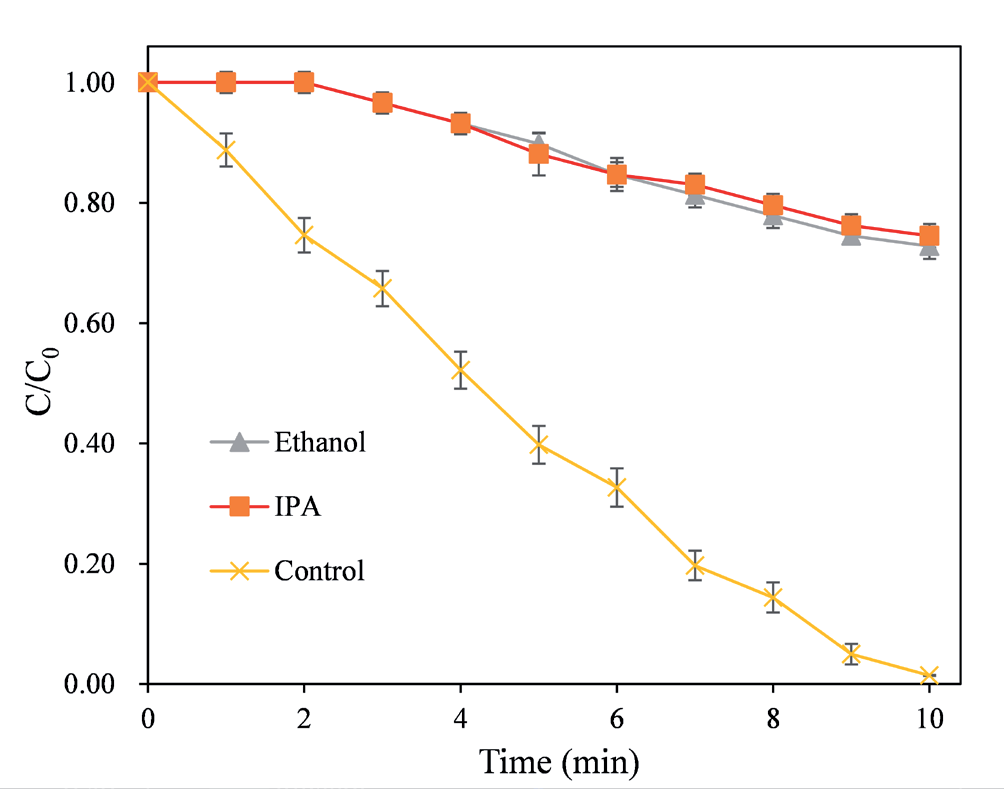
Quenching experiments were conducted to identify the predominant radical species in the oxidation system. In these quenching experiments, the selection of the quencher was crucial. In the context of alcohols containing α-hydrogen, the reaction rate constants for the reaction of ethanol with •OH lie within the range of 1.2×10⁹ to 2.8×10⁹ M-1·s-1, while those for the reaction with SO4-∙fall between 1.6×10⁷ and 7.7×10⁷ M-1·s-1 [40]. These data indicate that both •OH and SO4-∙could react rapidly with ethanol, thereby rendering ethanol a common quencher for these two types of radicals. In systems where both radicals coexist, isopropanol (IPA) effectively quenches •OH only [23]. Therefore, the dominant radical species could be determined by examining the inhibitory effects of ethanol and IPA on the reaction. As shown in Fig. 6, upon adding 0.5 mM of ethanol and IPA, respectively, to the reaction systems, the overall degradation efficiency of CAP plummeted, with comparable degrees of reduction observed. This led to the conclusion that •OH was the dominant radical species in the oxidation process, aligning with previous findings from UV/PMS oxidation of haloacetonitriles [32].
Model Analysis
Based on the BBD experimental setup, the coded factors and levels from Table 1 were input into Design-Expert 13 software, yielding 17 experimental schemes, which consisted of 5 center point replications and 12 factorial experiments. The experimental outcomes are presented in Table 3. By inputting the outcomes of these 17 experimental schemes into Design-Expert 13 software, a quadratic polynomial degradation model with degradation efficiency as the response variable and dosages of PMS, UV power, and retention time as independent variables were obtained, as shown in Equation (19).
(19)
In the Equation, Y represents the degradation efficiency of CAP (non-dimensional), A stands for dosages of PMS (unit: mM), B represents UV power (unit: W), and C denotes retention time (unit: min).
Table 3.
Experimental design matrix and the value of responses.
Table 4.
Analysis of variance for the quadratic model.
Statistical Analysis
The significance of the quadratic polynomial model was examined through Analysis of Variance (ANOVA). The ANOVA results were presented in Table 4, with the model fitting and error calculation by the Design-Expert 13 software. As established in the literature, the F-value and P-value are the most crucial indicators in model evaluation. A larger F-value and a smaller P-value indicate a more significant model [41]. In the model, the P-value is primarily used to assess the significance of terms within the model. A model term is considered significant in the model if its P-value is less than 0.05; conversely, if the P-value is greater than 0.1, the model term is deemed insignificant.
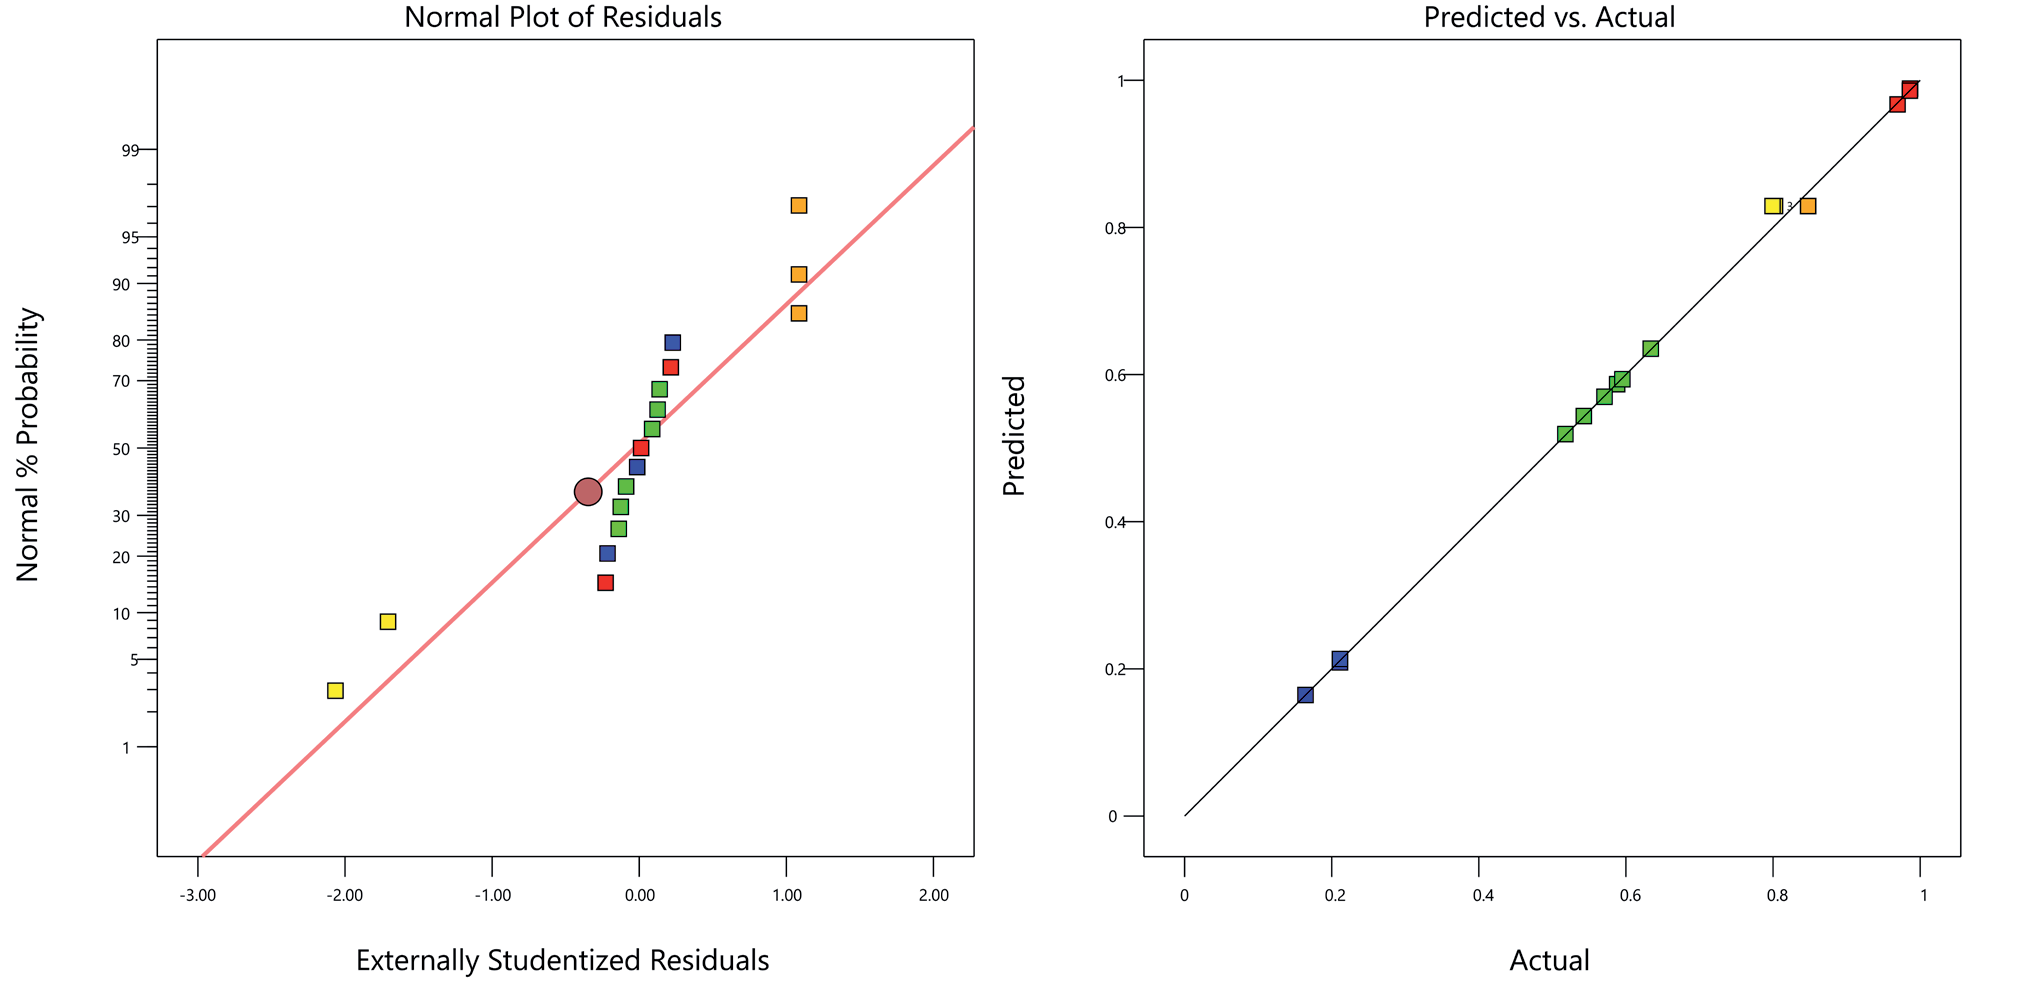
For this quadratic polynomial model, the F-value of the model was 336.61, with a P-value <0.0001, indicating a high level of significance. The lack of fit F-value of 0.016 implied that the lack of fit was not significant relative to the pure error. The “Pred R-Squared” of 0.9960 was in reasonable agreement with the “Adj R-Squared” of 0.9947. “Adeq Precision” measures the signal to noise ratio. A ratio greater than 4 is desirable. In the model, ratio of 55.127 indicated an adequate signal. This model could be used to navigate the design space. As illustrated in Fig. 7, the data points exhibited a linear distribution, indicating that the model residuals followed a normal distribution, thereby confirming the practical significance of the model. Furthermore, the actual values aligned closely with the predicted values, forming a nearly straight line with a strong linear correlation. This suggested an excellent fit between the model and the actual data, signifying that the model was capable of accurately predicting the degradation of CAP by the VUV/PMS process, achieving a satisfactory level of fitting performance.
Factor Analysis
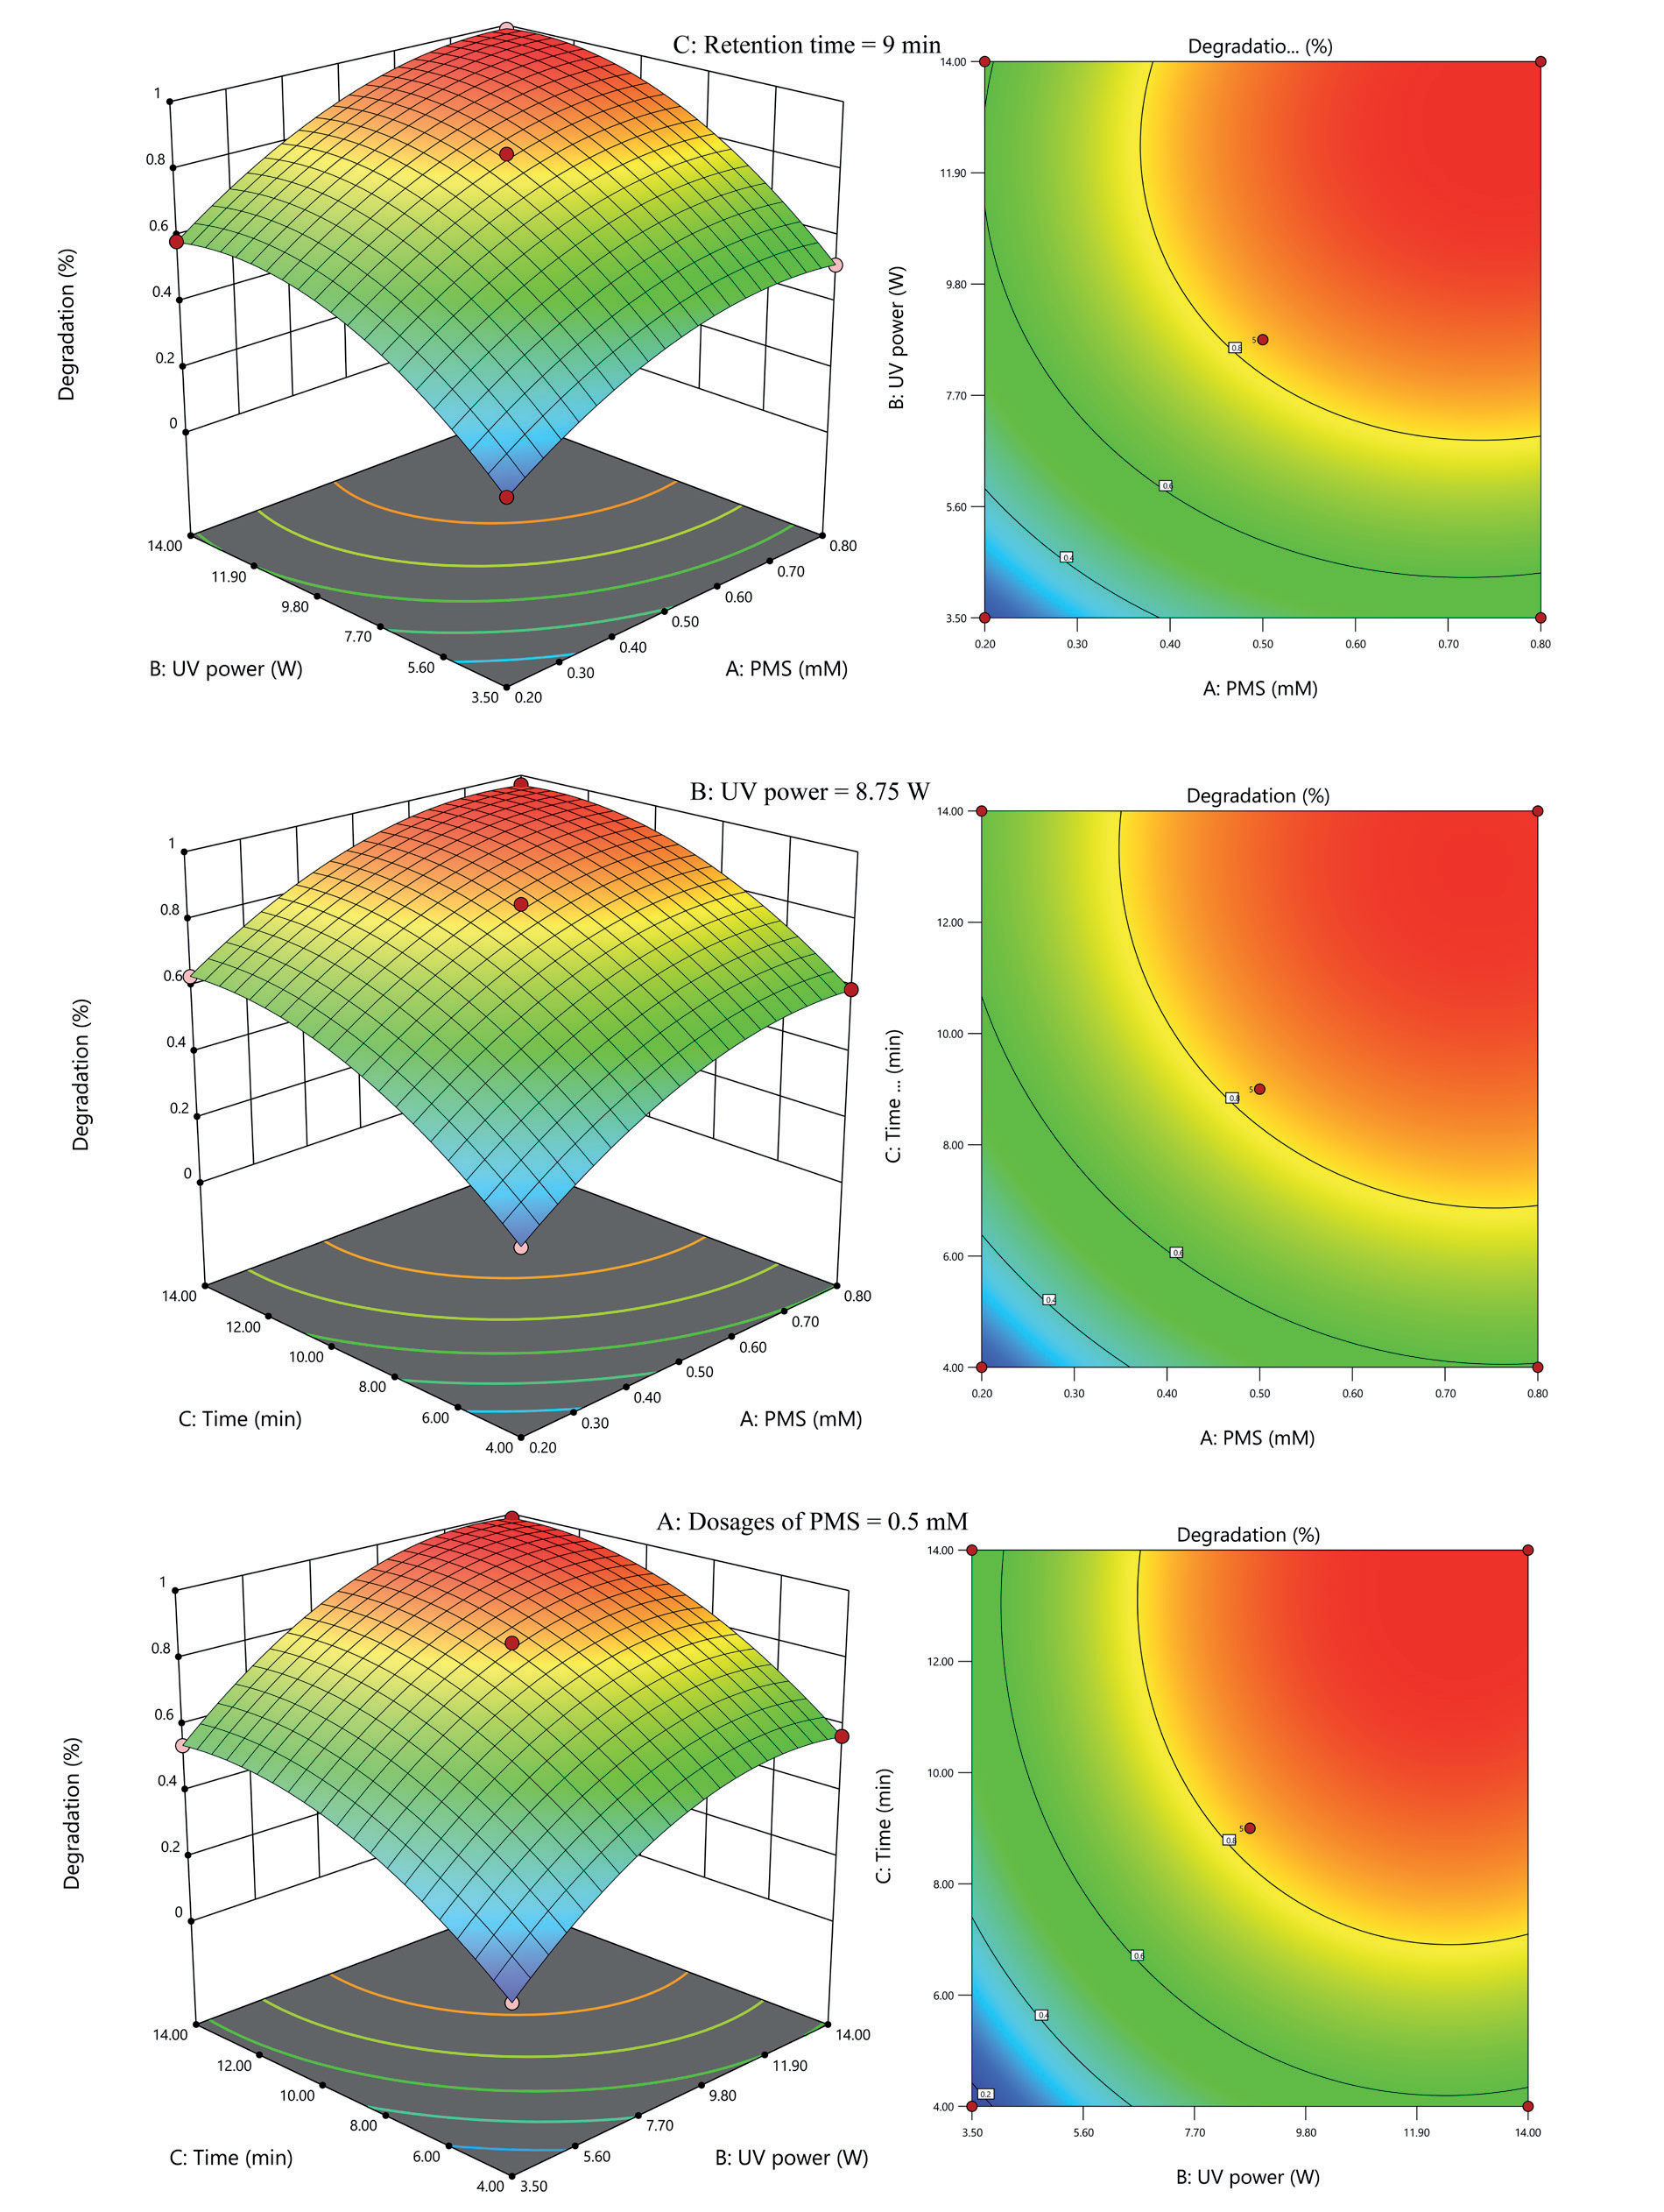
Contour and 3D response surface plots for the three factors were presented in Fig. 8. Spherical 3D response surfaces indicate negligible interaction among variables, whereas ellipsoidal or saddle-shaped plots signify more pronounced interactions among variables [23]. The 3D response surfaces revealed that the dosages of PMS, UV power, and retention time all significantly impact the degradation efficiency of CAP, with the degradation efficiency increasing as the independent variables increase. The influences of these three variables were relatively independent, with insignificant interactions among them. As evident from Table 3, the P-values for A, B, C, A2, B2, and C2 were all less than 0.05, indicating their significance. Model terms with P-values greater than 0.1 were not significant, suggesting that AC and BC had negligible impacts on the model. The F-values for dosages of PMS dosage, UV power, and retention time were 667.30, 945.60, and 831.87, respectively, demonstrating that in the VUV/PMS degradation process for CAP, UV power had the greatest influence on the degradation rate, followed by retention time, and dosages of PMS had the least impact. Consequently, in practical applications, to enhance the degradation rate, priority should be given to increasing UV power, followed by extending retention time, and finally, an increase in dosages of PMS should be considered.
Economic Optimization and Verification of the Mode
For the VUV/PMS process used in the degradation of CAP, the total operating cost comprises two main components: the electrical energy expenditure of the UV lamps and the cost of the oxidant. Regarding the electrical consumption of the process, following the guidelines of the International Union of Pure and Applied Chemistry (IUPAC), the economic efficiency of the photodegradation process is evaluated in terms of the electrical energy per order (EE/O, kW·h/m³/order). EE/O is defined as the kilowatt-hour of electrical energy required to reduce the concentration of a pollutant by one order of magnitude in a 1 m³ solution and can be calculated using Equation (20) [42, 43]. In this Equation, P represents the power of the UV lamp in kW, t is the irradiation time required to reduce the CAP concentration by one order of magnitude in minutes, and V denotes the volume of the reactant solution in m³.
Upon the aforementioned foundation, a new objective function Z was introduced, as depicted in Equation (21). Z represents the total operating cost of the process to reduce CAP in 1 m³ of solution or wastewater by one order of magnitude, comprising both the electrical consumption cost and the oxidant cost. By substituting the unit prices of industrial electricity and the oxidant into Equation (21), Equation (22) was derived. A detailed calculation process is provided in Supplementary Material S2.
Therefore, the problem was transformed into finding the minimum value of Eq. (22) under the constraints of Equations (23)-(26). In Equation (22), the unit of Z is USD/m³/order, where A represents the dosages of PMS in mM, B denotes the UV power in W, C is the reaction time required to achieve a 90% degradation efficiency in minutes, and Y refers to the quadratic polynomial in Equation (19), which signifies the degradation efficiency of CAP.
Equations (22)-(26) were input into MATLAB R2024a software, with the specific code provided in Supplementary Material S3. The VUV/PMS process achieved the lowest total operating cost for CAP degradation, amounting to 0.417 USD/m3/order, when the dosages of PMS were set at 0.3879 mM, the UV power at 11.4910 W, and the retention time at 12.3039 min. Under these optimal operating conditions, a model validation experiment was conducted, yielding a degradation efficiency of 96.89%, which was close to the model’s predicted value of 90.00%. This demonstrated that the quadratic polynomial model effectively simulated the degradation of CAP by the VUV/PMS process, with reliable model outcomes and significant practical application value. Furthermore, based on previous research findings on the degradation of CAP using UV-based advanced oxidation technology, it was evident that while effectively degrading CAP, this technology had also resulted in intermediate products of CAP that exhibited significantly lower genetic toxicity compared to CAP itself [44]. In conclusion, the total operating cost as low as 0.417 USD/m3/order is highly valuable for process applications. The application of the VUV/PMS process in the actual degradation treatment of CAP will drastically reduce both the electrical consumption and reagent costs associated with industrial CAP degradation, thus presenting a promising application prospect.
Conclusions
The degradation efficiency of CAP by the VUV/PMS process was significantly greater than that of VUV and PMS individually. The degradation reaction followed pseudo-zero-order kinetics. Both acidic and alkaline conditions accelerated the reaction. Among the water matrix components, bicarbonate and nitrate ions exerted notable inhibitory effects, while chloride and sulfate ions had negligible impacts on the degradation efficiency. Hydroxyl radicals played a dominant role in the VUV/ PMS oxidation process. RSM was employed to simulate and optimize the VUV/PMS oxidation process for CAP degradation. The quadratic polynomial model provided a satisfactory fit to the degradation process, with R2 and Adj-R2 values of 0.9960 and 0.9947, respectively. Based on model optimization, when the dosages of PMS were set at 0.3879 mM, the UV power at 11.4910 W, and the retention time at 12.3039 min, the VUV/PMS process achieved the lowest total operating cost for CAP degradation, which was 0.417 USD/m³/order.
Credit Authorship Contribution Statement
Xing Zhang: Writing - original draft. Jinghan Liu: Writing - review & editing, Project administration, Funding acquisition. Yizhi Liu: Writing - original draft, Validation. Changhua Lu: Writing - review & editing, Methodology, Supervision. Shuqing Li: Formal analysis. Zhen Zhou: Data curation.