

Introduction
Currently, most of China’s urban drinking water sources are contaminated to varying degrees, with the water source, and drinking water measured in trace amounts of contaminants also increasing, a severe threat to the safety of drinking water. However, the water treatment process also faces challenges [1–3]. In response to the new pollution problems in the source water, people have begun to work on new technologies for water purification, and there have been many technologies in the actual production application that have achieved better results [4–6].
In 2021, the Bulletin of China’s Ecological Environment showed that among the 3632 river water quality sections, the percentage of class Ⅰ~Ⅲ was 84.9%, and the proportion of the water quality, worse than class Ⅴ, was 1.2% [7]. Among the 209 important lakes (reservoirs) where trophic state monitoring was carried out, 10.5% of the lakes (reservoirs) were nutrient-poor, 62.2% were medium nutrient, and 23.0% were mild eutrophic, and 4.3% were medium eutrophic, the main pollution indexes are the permanganate index, total phosphorus and chemical oxygen demand, which shows that the water environment of lakes in China is still not optimistic [8].
It is well known that algae in lake surface water have a very close relationship with the degree of eutrophication and produce algal toxins that will reduce the safety of drinking water quality [9–11]. The air flotation process has a good effect on removing algae and has achieved better results in water plants in Xi’an, Guangzhou, and Shandong [12–14]. Although bio-ceramic application in drinking water treatment is not as common as activated carbon, it has a large specific surface area, good biological affinity, high strength, and stable operation, suitable as a filtration filler and biological carrier [15, 16]. It is replacing the conventional process with a membrane, forming a depth process of filler-membrane, which can meet the requirements of current water quality and significantly save the area of water treatment structures [17–19].
Combined with the characteristics of the above process, this study takes air flotation time, filtration rate, and membrane permeation rate as research factors. It preliminarily discusses the “air flotation/bio-ceramic/ membrane” process under different working conditions through the RSM. The treatment efficiency of the integrated process for two types of pollutants, chlorophyll a, and CODMn, was investigated to optimize the process operation better and provide a valuable reference for its application in micro-polluted surface water.
Materials and Methods
Experimental Device
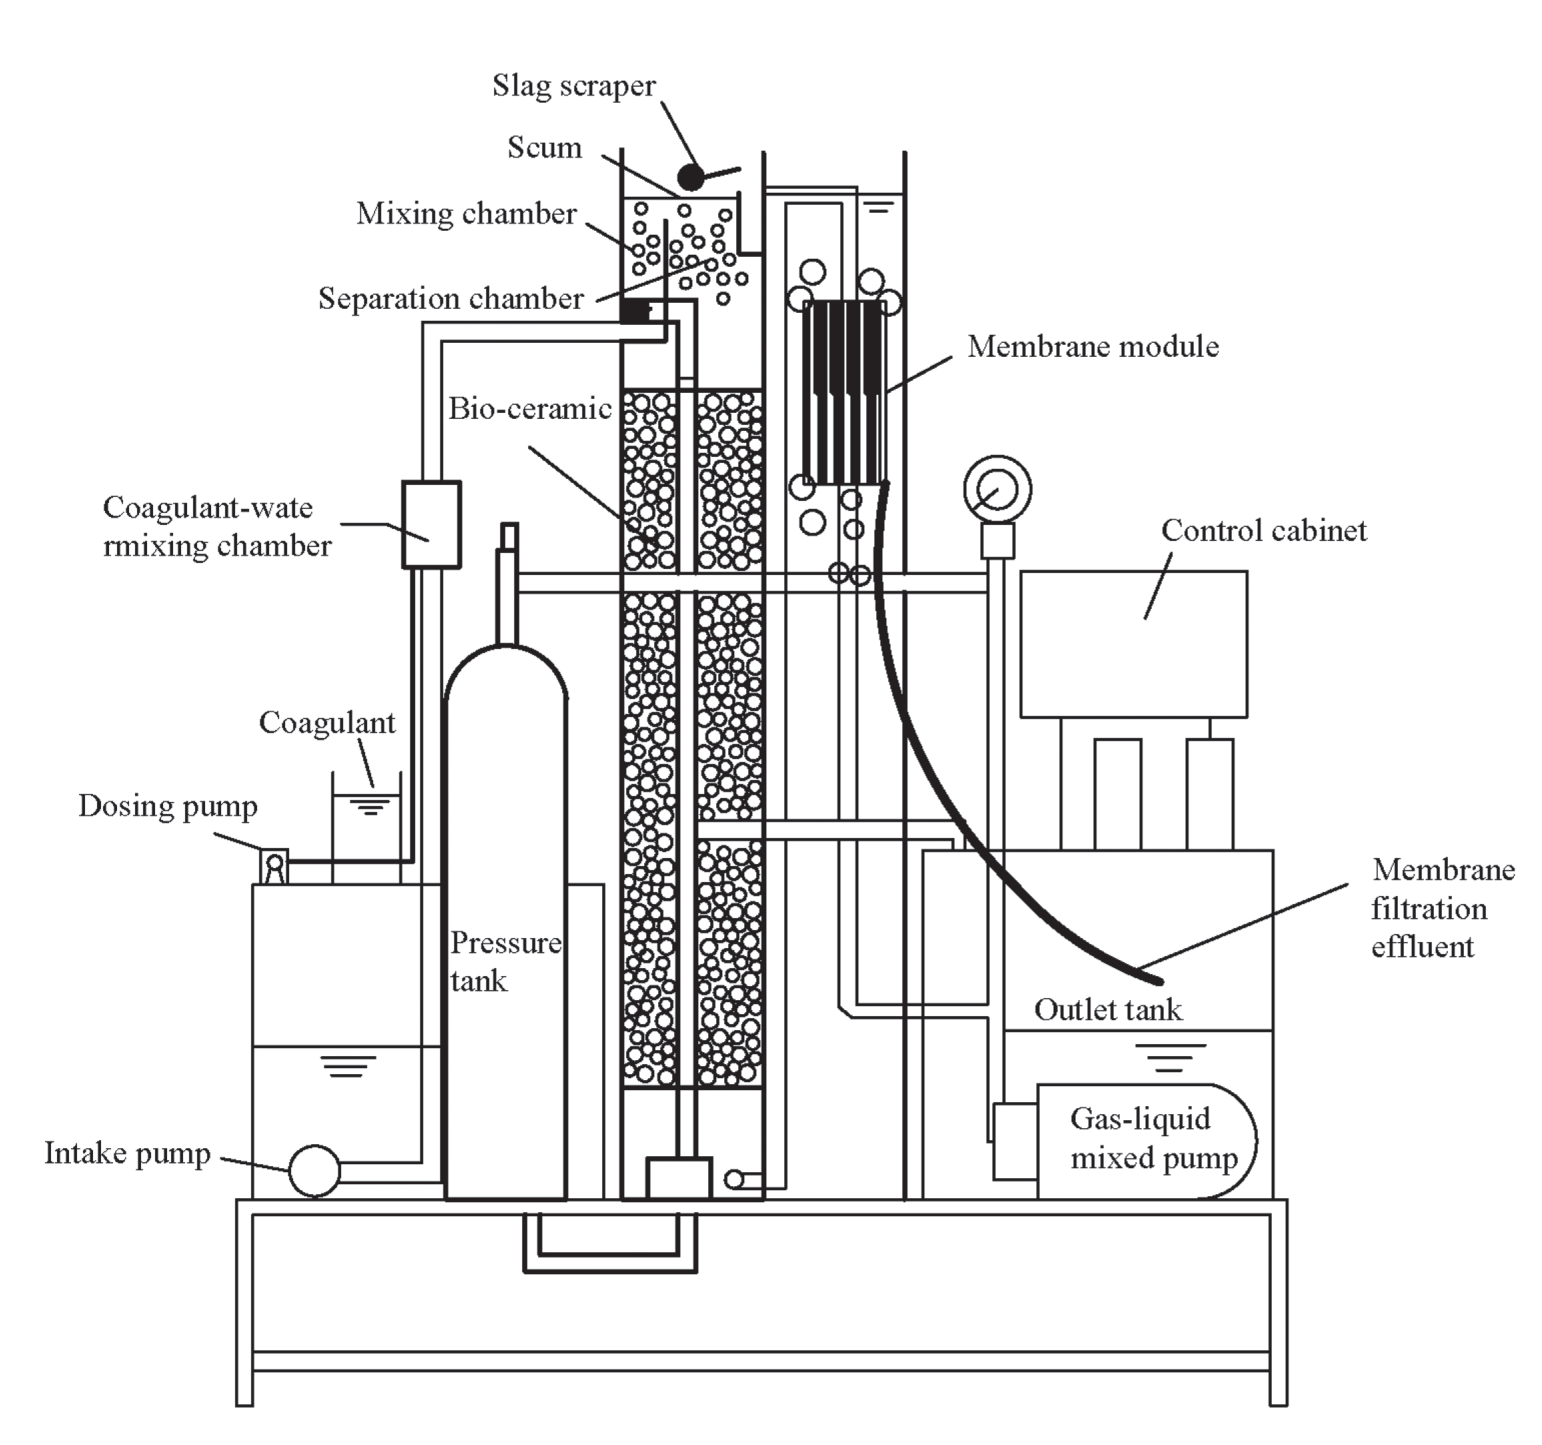
The schematic diagram of the “air flotation/bio-ceramic/membrane” combined process is shown in Fig. 1. The raw water is coagulated in the coagulant-water mixing chamber, and the coagulated water is mixed with the micro-bubbles generated by the pressurized dissolved air flotation in the mixing chamber. Then, the flocs are lifted to the water surface by the adhesion and lifting effect of the micro-bubbles, and the separation of gas and water is realized in the separation chamber. After that, the water body is treated by a bio-ceramic filter unit, and the treated effluent enters the membrane treatment unit. After membrane filtration, effluent enters the outlet tank from the connecting pipe for discharge.
Experimental Materials
The raw water was taken from a lake in Changzhou City, Jiangsu Province, and the raw water quality was shown as follows: the temperature was 13.3~25.7℃, the pH was 6.3~8.2, the turbidity was 4.38~9.75 NTU, the chlorophyll a was 14.33~28.91 μg/L, the CODMn was 6.59~11.83 mg/L. In micro-polluted surface water, due to the relatively low content of organic matter, the oxidation capacity of CODMn is relatively weak, which can meet the measurement requirements. The oxidizability of CODCr is very strong, but in slightly polluted water, this strong oxidizability may lead to higher determination results. Therefore, the CODMn is more accurate to reflect the actual pollution of water.
The bio-ceramsite was purchased from Jiangxi Tuobu Environmental Protection Technology Co., Ltd. The primary material is clay, the shape is spherical, the color is dark brown, the particle size is 1.5–4.0 mm, the average specific surface area is 4.76 m2/cm3, and the bulk density is 1.1 g/ cm3. Before use, the bio-ceramsite is washed five times with distilled water to remove the impurity components. Given the surface water quality characteristics and the material’s economic applicability, the experimental membrane is a polyvinylidene fluoride plate microfiltration membrane with an effective membrane area of 0.05 m2 and a pore size of 0.2 μm.
Experimental Parameters and Optimization Design
The response surface methodology (RSM) is a statistical experimental design for optimizing processes. It is used to build continuous variable surface models, evaluate factors affecting processes and their interactions, and determine optimal levels of scope [20, 21]. Consideration of experimental conditions and feasibility based on previous research bases, the RSM was used to study the effects of air flotation time (A), filtration rate (B), and membrane permeation rate (C) on the removal efficiency of chlorophyll a and CODMn. The Box-Behnken experimental scheme was designed according to Design-Expert software, with air flotation times of 10, 20, and 30 min, filtration rates of 1, 2, and 3 m/h, and membrane permeation rates of 20, 30, and 40 L/(m2·h). The experiment was conducted for all parameter sets as 17 working conditions, each experimental reaction condition is shown in Table 1.
Before the experiment, all bio-ceramic columns had been in stable operation for about two months, completing the process of biofilm growth and stabilization in the packing material. The operating cycle of each working condition was 60 days, and the average removal efficiency of pollutants within 60 days was taken as the total average removal efficiency. The main operating parameters were listed as follows: the coagulant was polymeric aluminum chloride with a concentration of 5 mg/L (in Al2O3), the flocculation time was 15 min, and the hydraulic retention time of the mixing chamber was 8 min. The flotation type of this study is pressurized dissolved air flotation, the flow rate of the dissolved air pump is 2 m3/h, and the air used is ordinary air. The membrane device was backwashed by surface aeration cleaning, and the backwashing cycle was 5 min/h. The thickness of the bio-ceramic filter was 1000 mm.
Analysis Method
Chlorophyll a was determined by the spectrophotometric method [22], CODMn was determined by the standard acidic potassium permanganate method [23], water temperature and pH were determined by Hach Portable Parameter Meter (HQ40d), turbidity was determined by Turb550 turbidity meter; transmembrane pressure was determined by the vacuum gauge. The parameters for model validation were determined by the optimization module in the RSM software Design Expert 8.0.6. The validations have been carried out for one set of parameters in the analysis module.
Results and Discussion
Optimization Analysis Test of Target Pollutant Removal
The total average removal efficiency of chlorophyll a and CODMn for each working condition is shown in Table 2. The removal efficiency of chlorophyll a and CODMn in each working condition of this combined process had some similarities. The highest removal efficiency of chlorophyll a (97.7%) and CODMn (76.1%) were found in working condition 2, in which the air flotation time was 30 min, and the filtration rate was 3 m/h. The lowest removal efficiency of chlorophyll a (85.6%) and CODMn (54.0%) occurred in condition 15, in which the air flotation time was 10 min, and the filtration rate was 1 m/h. In combination with the other conditions, the overall removal of the two pollutants showed a gradual increase with increasing air flotation time and filtration rate, and the effect of air flotation on the reduction of chlorophyll a was particularly significant, which is consistent with the results of previous studies [24]. For CODMn, the contribution values of air flotation and bio-ceramic filter were similar, as the air flotation process can remove a certain amount of flocculent particles based on coagulation. Furthermore, on the other hand, the biodegradation of bio-ceramic filters can further decompose and remove pollutants. Membrane filtration, as a physical purification process and terminal treatment unit, had a limited removal effect on two types of pollutants, but it had a more significant removal of sensory pollutants, such as turbidity [25, 26].
Table 2.
Experimental design and removal efficiency analysis.
Construction of Response Surface Model and Significance Test
Based on the above analysis, the removal efficiency of chlorophyll a (Y1) was simulated by equation using Design Expert, and the resulting fitted model results were subjected to ANOVA. At the same time, significance tests were conducted for each factor using F-values, specifying that the model was significant at p < 0.05. As a result, the multiple quadratic regression Equation was:
(1)
The positive coefficients of the variables A, B, and C in Equation (1) indicated that the variable can cause an increase in the response value. The negative quadratic term coefficients suggested that it had a maximum value point and was capable of optimal analysis [27, 28]. The F-value of the model was 39.84, the p-value < 0.0001, and the signal-to-noise ratio was 19.009, which was much more significant than 5. The Adj R2 of the model is 0.9109, which indicates that the model conformed well with the actual, and the experimental error was small enough to predict the actual situation. The t-test showed that the p-value of Equation (1) was < 0.0001 for A, p-value = 0.0002 for B, and p-value = 0.0588 > 0.05 for C, indicating that both A and B were significant influencing factors, and the effect of C on the results was insignificant.
(2)
In Equation (2), the positive coefficients of variables A and C indicated that the variable could cause an increase in the response value, and the negative coefficients of variable B suggest that the variable can cause a decrease in the response value. The positive quadratic term coefficients indicated that it had a maximum value point and could perform optimal analysis. The F-value of the model was 22.10, the p-value = 0.0002, which was close to 0.0001, the signal-to-noise ratio was 16.670, which was much more significant than 5, and the Adj R2 of the model was 0.8860, which indicated that the model was in good agreement with the experimental data. The experimental error was small enough to predict the actual situation. The t-test showed that the p-values of A = 0.0002, B < 0.0001, and C = 0.0860 > 0.05 indicated that both A and B were significant influencing factors, and the effect of C on the results was not significant.
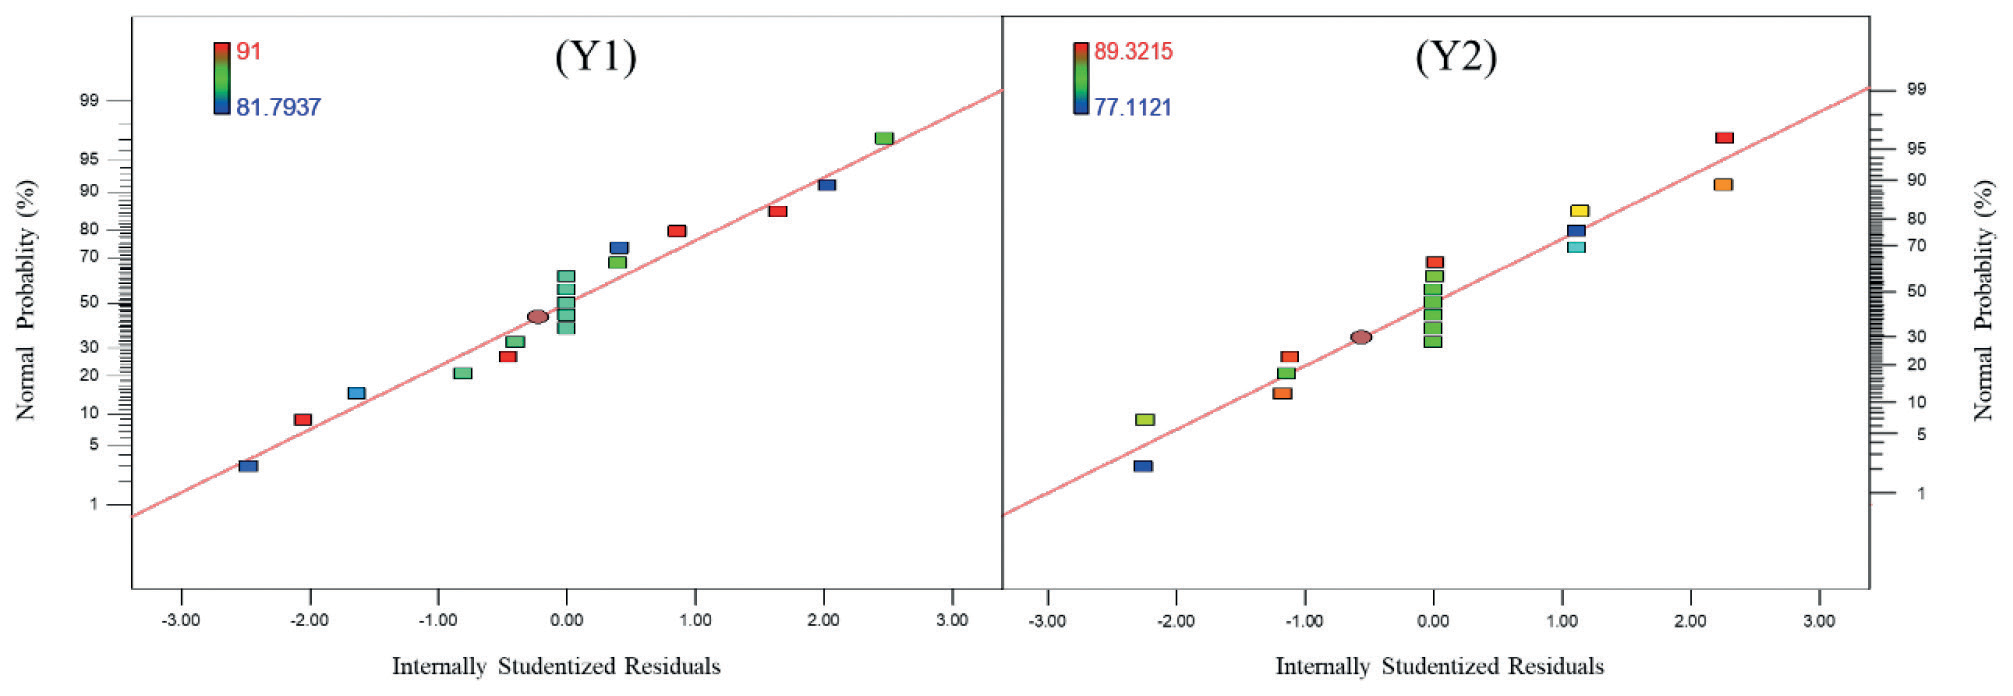
The normal distribution of the residuals of the regression model is shown in Fig. 2. The data points of Y1 were between 85.5690% and 97.7368%, and the data points of Y2 were between 54.0183 and 76.1083%. The data points of both Y1 and Y2 were around the diagonal line and normally distributed. The residuals of Y1 lie within the range of -3 to +3, and the residuals of Y2 lie within the range of -2 to +2, indicating that the established regression equation was credible [29]. In summary, the quadratic polynomial equations established according to the model had good reliability for the Chlorophyll a and CODMn. They could be used to predict Chlorophyll a and CODMn variation.
Response Surface Results and Predictive Analysis
As shown in Fig. 3 and Fig. 4, to better illustrate the effects of air flotation time, filtration rate, and membrane permeation rate on the removal efficiency of chlorophyll a and CODMn, the three-dimensional contour plots were made by Design Expert with two independent variables as X coordinates.
Fig. 3a) shows the effect of air flotation time and filtration rate on the total average removal efficiency of chlorophyll a at a membrane permeation rate of 30 (L/(m2·h). The best removal efficiency of chlorophyll-a occurred in condition 2, where the air flotation time was 30 min, and the filtration rate was 3 m/h. The lowest removal efficiency occurred in condition 15, where the air flotation time was 10 min, and the filtration rate was 1 m/h. This result was consistent with these figures. The response surfaces of air flotation time and membrane permeation rate on the total average removal efficiency of chlorophyll a at a filtration rate of 2 m/h are shown in Fig. 3b). The effect of membrane permeation rate on the removal efficiency was low at 20 L/(m2·h) and 40 L/(m2·h) and relatively high at 30 L/(m2·h), but the difference between the removal efficiency at these three levels was slight. The effects of filtration rate and membrane permeation rate on the total average removal efficiency of chlorophyll a when the air flotation time was 20 min are shown in Fig. 3c). As can be seen from the figure, the filtration rate and membrane permeation rate showed a positive correlation with the removal efficiency on the response surface. Still, the removal efficiency was relatively low at the high values. The higher removal efficiency occurred at the filtration rate of 2 m/h and membrane permeation rate of 30 L/(m2·h), consistent with the analysis of the previous two figures.
Fig. 4a) shows the effect of air flotation time and filtration rate on the total average removal efficiency of CODMn when the membrane permeation rate was equal to 30 L/(m2·h). It could be seen that the effect of air flotation time and filtration rate on CODMn removal efficiency was similar to those in Fig. 3a). The highest removal efficiency occurred at the high values of both factors, and the lowest occurred at the low values of both elements. The slope of the filtration rate was greater than that of the air flotation time, meaning the effect of the filtration rate on the results was greater than that of the air flotation time [30, 31].
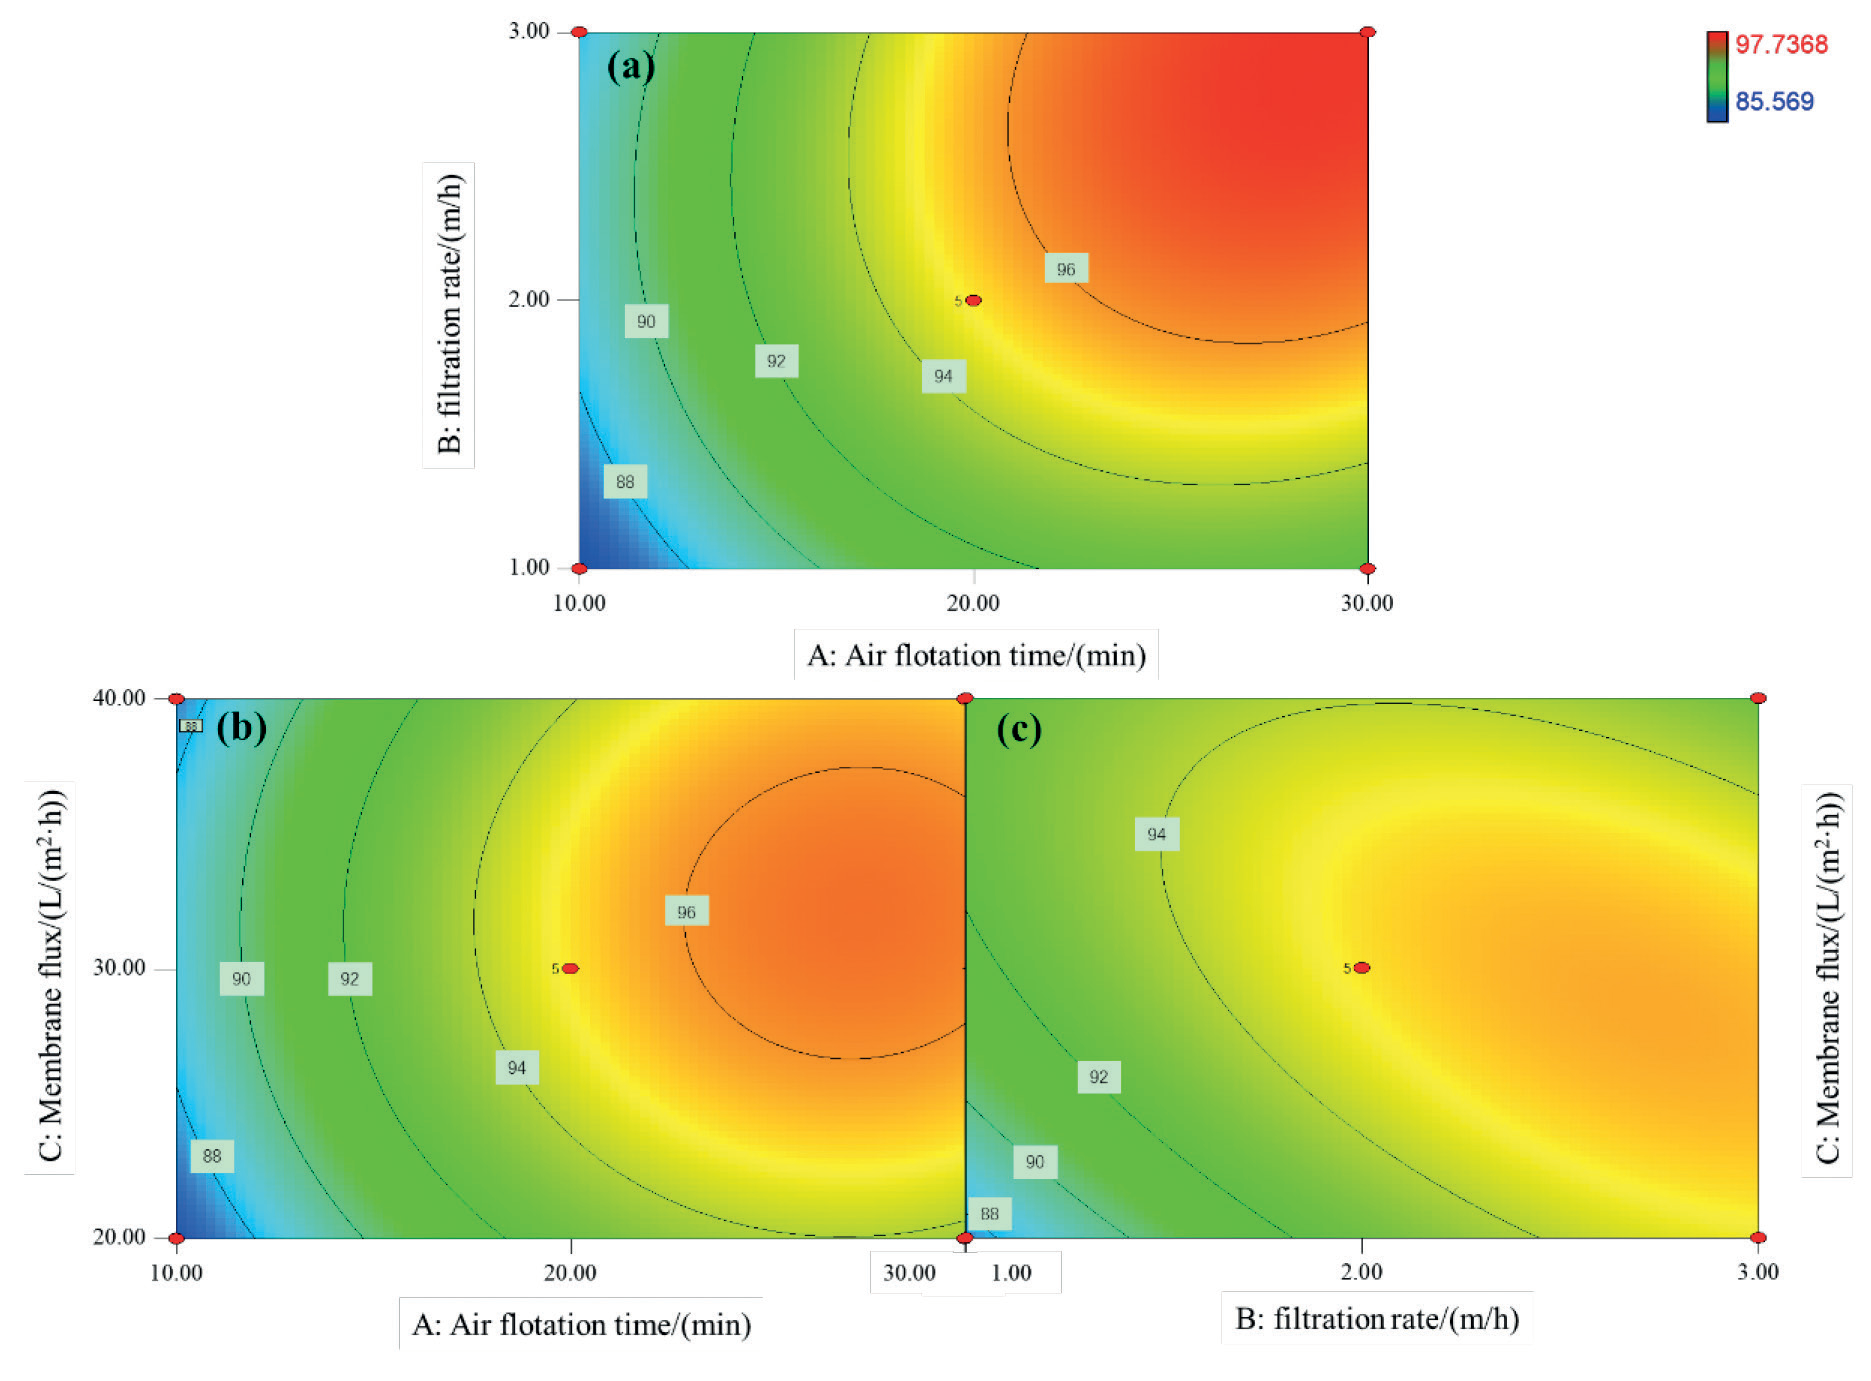
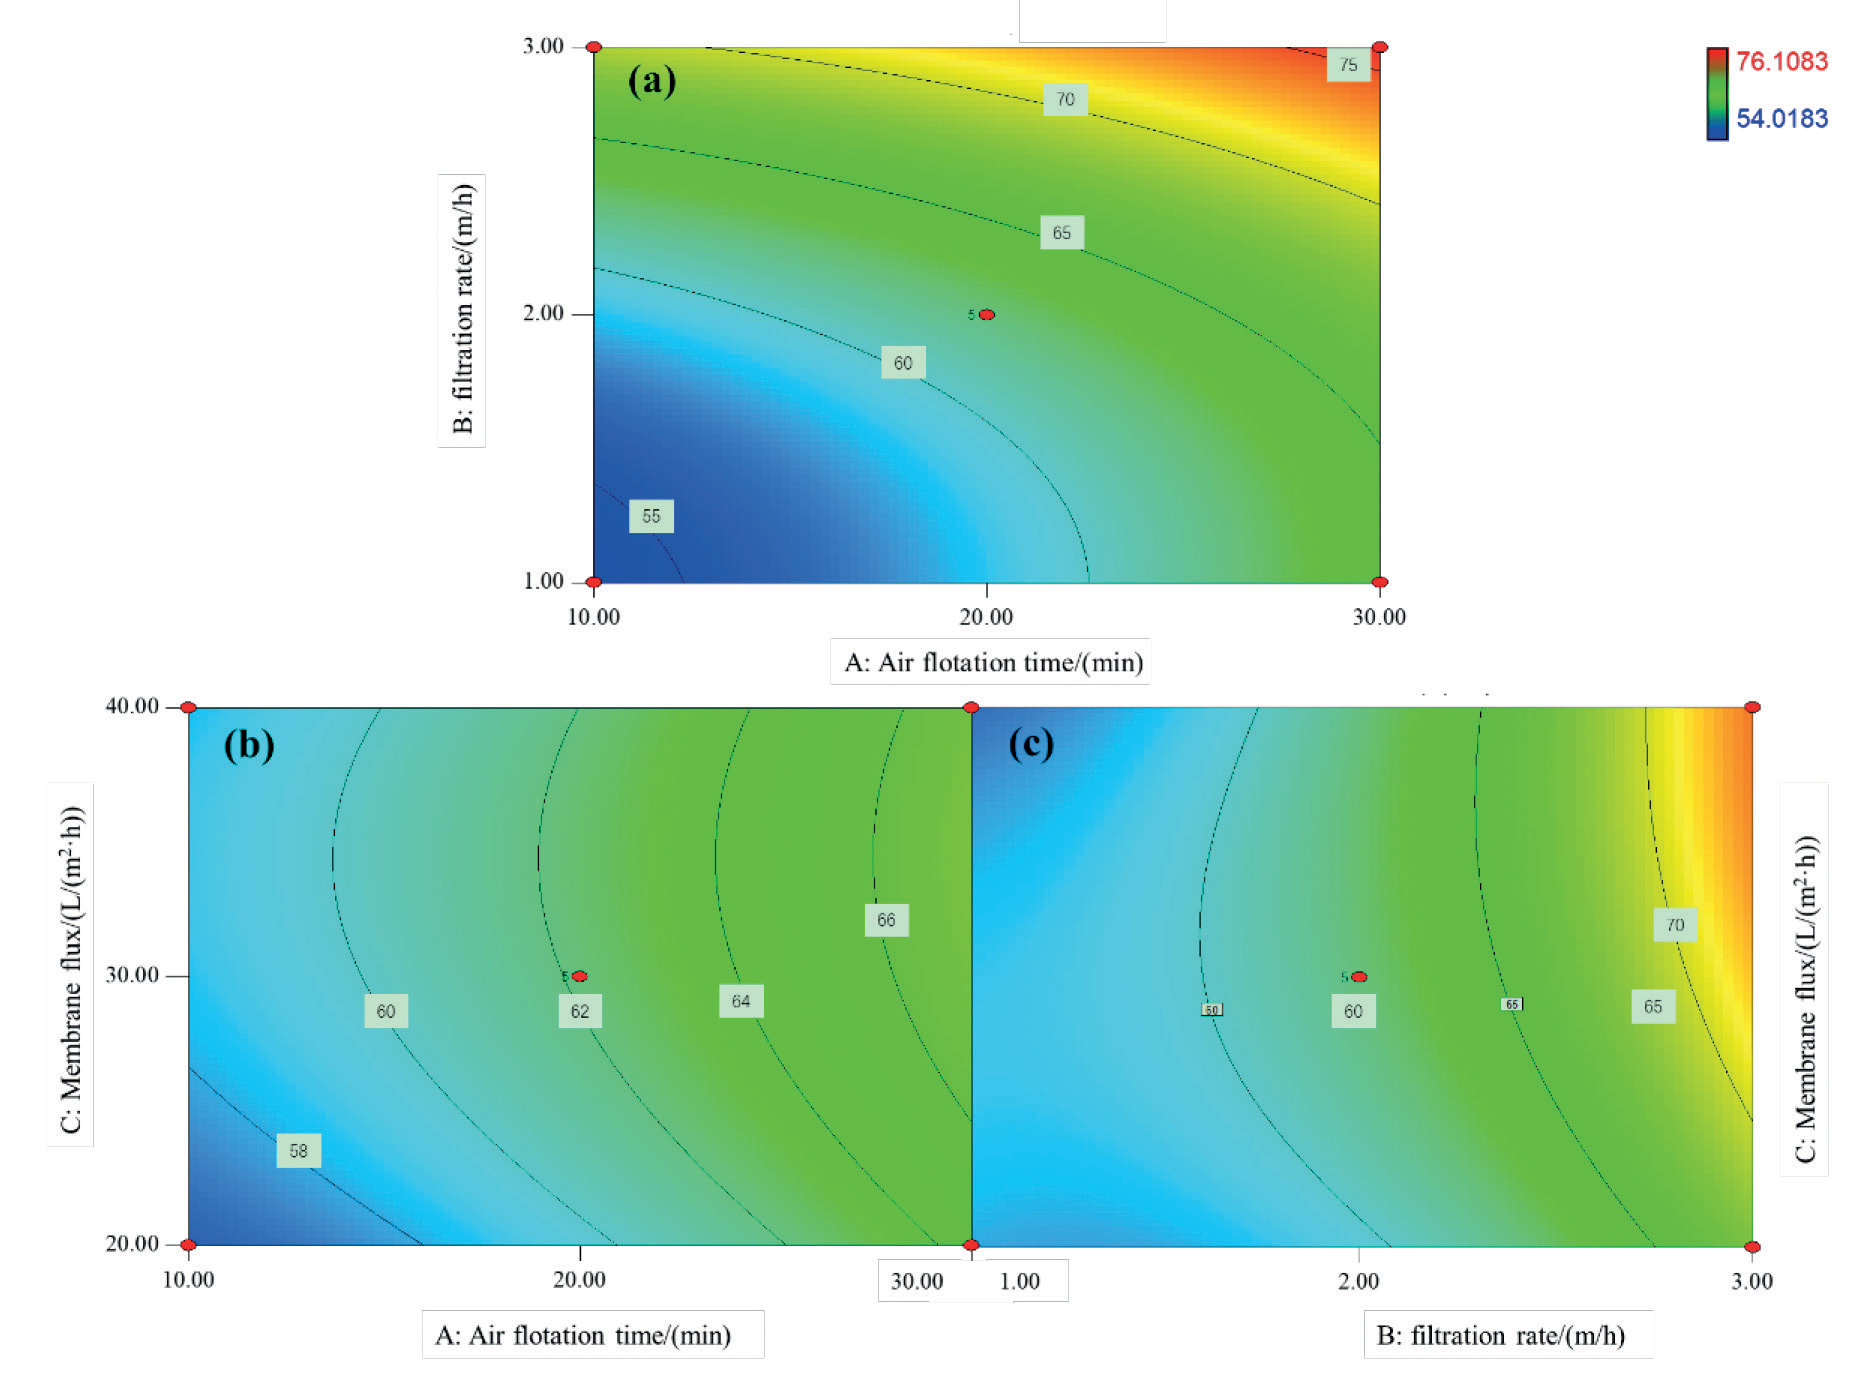
Table 3.
Response surface model results and significance analysis.
The response surface of air flotation time and membrane permeation rate on the total average removal efficiency of CODMn at the filtration rate of 2 m/h is shown in Fig. 4b). The response surface is relatively flat. The removal efficiency changed slightly under the interaction of air flotation time and membrane permeation rate, and it was noteworthy that the slope of air flotation time was more significant than that of membrane permeation rate for the same flat curve. The effect of air flotation time on the result was more powerful, which was also consistent with the significance test analysis.
When the air flotation time was 20 min, the effect of filtration rate and membrane permeation rate on the total average removal efficiency of CODMn was shown in Fig. 4c). As could be seen from the figure, a significant positive correlation was observed between the filtration rate and CODMn removal efficiency. At the same time, the membrane permeation rate had a more negligible effect on the results.
According to the calculation results of parameters and response surface in Table 3, the optimum conditions were obtained with the maximum removal efficiency of chlorophyll a and CODMn. The removal efficiency of chlorophyll a was 97.25%, and CODMn was 76.46% when the air flotation time was 30 min, the filtration rate was 3 m/h, and the membrane permeation rate was 32 L/ (m2·h). In this experiment, by changing the values of air flotation time, filtration rate, and membrane permeation rate and analyzing the changes of chlorophyll a and CODMn removal efficiency comprehensively, the optimal test conditions were obtained by mathematical model calculation. The conclusions were similar to the results of previous studies, which proved this optimization method’s effectiveness [32].
Optimization Validation
The optimal values of different experimental parameters can be obtained by applying the RSM. In order to investigate the accuracy of the optimal conditions of the model equation, the optimization validation experiment was carried out under the optimal values of different experimental parameters. This can verify the difference between the actual value and the optimal theoretical value, so as to judge whether the optimal parameters obtained based on the RSM are accurate and reliable. To investigate the accuracy and economic applicability of the optimal conditions from the response surface model equation, a validation test was conducted at an air flotation time of 30 min, a filtration rate of 3 m/h, and a membrane permeation rate of 35 L/(m2·h), and the results were 94.15±3.38% for the average total removal of chlorophyll a and 72.17±2.58%, which was in good agreement with the model predictions. It can be seen that the best process parameters based on the response surface method are accurate and reliable, which is a good guideline for the application of the “air floatation/bio-ceramic/ membrane” combined membrane bioreactor.
Conclusions
(1) The effect of air flotation time on the removal efficiency of chlorophyll a and CODMn was similar, and both were positively correlated with the results.
(2) The relationships between air flotation time, filtration rate, and membrane permeation rate with the removal efficiency of chlorophyll a and CODMn were established based on the response surface method. The correlation coefficients R2 of the quadratic model were 0.9109 and 0.8860, respectively, which were well-fitted, and the experimental errors were minor. The air flotation time, filtration rate, and membrane permeation rate could be predicted, respectively.
(3) In the optimization validation, the flotation time was determined to be 30 min, the filtration rate was 3 m/h, the membrane permeation rate was 32 L/(m2·h), the chlorophyll a removal efficiency was 97.25%, and the CODMn removal efficiency was 76.46%. The results showed that the total average removal efficiency of chlorophyll a was 94.15±3.38%, and the total average removal efficiency of CODMn was 72.17±2.58%, which was consistent with the model’s predicted values.

