

Introduction
Alternative and renewable fuels have received great attention these days due to the depletion of fossil fuel resources and the greenhouse effect. Among alternative fuels, biodiesel has emerged as an excellent fuel owing to its non-toxic nature and with minimal contribution to net CO2 and sulfur emissions to the atmosphere. Biodiesel fuel for diesel engines can be produced from soybean oil by the transestrarification process. In the transestarification process, the glycerine from the oil is removed and converted into fatty acid methyl acid (FAME), which is also known as biodiesel [1]. Soybean is used to produce oil and protein for human consumption, the raw material for animal feed, and biomass for biofuel [2]. Due to its multiple uses, soybean is a highly demanding crop [3, 4].
Soybean fulfills its nitrogen (N) requirement mainly through symbiotic N fixation bacteria in nodules or by N uptake from soil. However, the gap in N demand and supply caused by biological N fixation can be filled by the application of synthetic fertilizer [5, 6]. Particularly in legumes, N demand is high, which is needed to achieve high seed yield [7]. Soybean crops on average uptake 79 kg N ha−1 in their total above-ground dry matter per ton seed yield [8]. Nitrogen fertilization as a starter dose provides soybeans with readily available N during seedling development and has been shown to increase soybean seed yields [9]. Nitrogen, along with sulfur (S), shows a major role in protein formation, chlorophyll development, and oil production [10, 11].
Sulfur is known as a necessary macronutrient for soybean growth and development. Sulfur is currently placed as the fourth principal nutrient for the growth and development of plants [12]. Its deficiencies in oilseeds, legumes, and even cereals are more pronounced. Sulfur works as an essential player in the chemical composition of grains [13, 14]. Cysteine and methionine are known to be the most essential amino acids that comprise S in plants, where they take place as free acids and as raw materials for proteins [15]. Sulfur deficiencies are widespread because of the intensification of agriculture. Soils lacking S cannot supply enough S to meet crop demand, resulting in crops with low S content and yields [16].
The rising demand for soybeans and the potential for large-scale cultivation rationalize the need for research into soybean production and the required crop management practices, including nutrient management. The potential benefits of N and S fertilization on seed yield and oil quality have been reported in soybeans and other crops [17, 18]. The seed yield and synthesized biodiesel yield are based on various factors, including the photoperiod, sowing time, temperature, and varietal characteristics [19]. However, it is needed to find the optimum fertilizer rate, variety selection, sowing time, sowing method, and other agronomic and physiological attributes to obtain high biodiesel yield in semi-arid subtropical environments. This was hypothesized that N and S fertilizer rates can affect biodiesel production by affecting the seed production from soybeans. The present study was conducted with the following objectives: i) to determine the impact of nitrogen and sulfur fertilizers on seed production and oil yield of soybeans and ii) to determine the impact of nitrogen and sulfur fertilizers on biodiesel production from soybeans.
Materials and Methods
Experiment Details
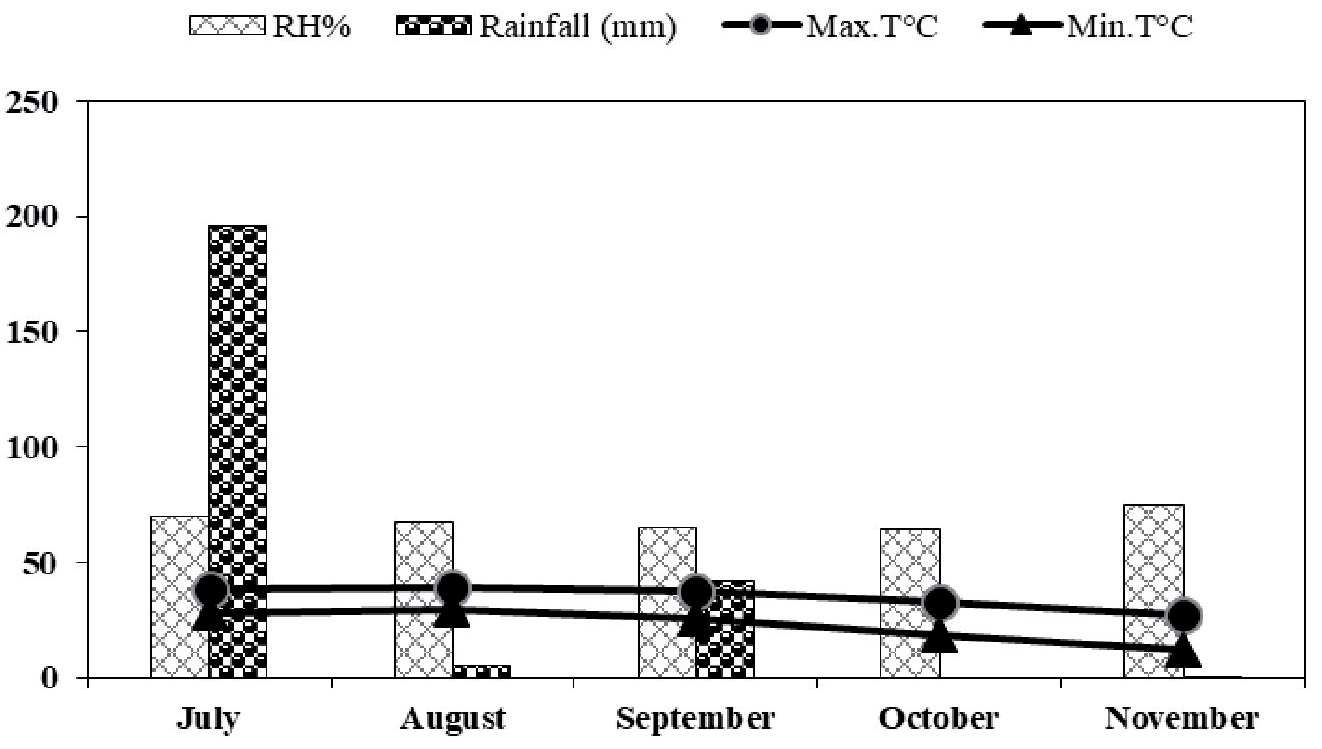
The planned research was executed at the Postgraduate Agricultural Research Station (PARS), University of Agriculture, Faisalabad, in 2018. The climate of this region is semiarid to subtropical. The weather data of monthly daily values of maximum and minimum air temperature and rainfall during crop season is given in Fig. 1. Soil analysis was carried out by standard procedures of Homer and Pratt (1961) to determine different soil properties. The experimental soil had a sandy loam texture with 7.8 pH, 0.93% organic matter, 0.06% nitrogen, 7.3 mg kg-1 phosphorus, 17.7 mg kg-1 potassium, and 9.10 mg kg-1 sulfur. The study comprised of three nitrogen supply rates (N1: Control, N2: 50 kg ha-1, and N3: 100 kg ha-1), using four sulfur levels (S1: Control, S2: 30 kg ha-1, S3: 60 kg S ha-1, and S4: 90 kg ha-1). The nitrogen requirements were achieved by using urea (46% N), while sulfur requirements were fulfilled by using gypsum (19% S). The experiment was conducted in a randomized complete block design with a factorial arrangement and three replicates. The net plot size was 5 m × 1.8 m and the gross plot size was 6 m × 1.8 m.
Crop Husbandry
The soil was prepared by doing 2-3 cultivations with the help of the cultivator along with the planking. The seed of the soybean variety “Faisal soybean” was taken from Ayub Agriculture Research Institute Faisalabad and sown on 25th July 2018. A single-row hand drill was used in sowing; the seed was placed 45 cm apart in rows using a seed rate of 100 kg ha-1. Thinning was completed after 10 days of sowing to keep 6 cm plant-to-plant spacing. Nutrients other than N and S were applied at the recommended rate of 60 kg ha-1 phosphorus pentoxide (P2O5) and potassium oxide (K2O) at 50 kg ha-1. Three irrigations of a 3-acre inch were applied on the 2nd week after germination, at flowering and pod formation. The crop was harvested on 3rd November 2018 to determine different traits.
Crop Phenology, Oil Yield, Biodiesel Yield Measurement
The data on plant height, number of leaves per plant, days to 50% flowering, days to 50% pod setting, number of pods bearing branches, number of pods per plant, seeds per pod, days to maturity, and yield contributing parameters, including thousand seed weight, biological yield, seed yield, and harvest index, were recorded using standard procedure. Each plot harvest was manually sorted and cleaned and seed yield was obtained from the net plot, and then changed to a per-hectare basis.
Determination of Oil Yield and Content
Soybean oil and its biodiesel quality parameters were analyzed in the bio-analytical chemistry lab, at Punjab Bio Energy Institute, University of Agriculture Faisalabad. From each treatment, 500 g of seed was taken and oven dried to remove moisture; afterward, oil content extraction was done through an electric Soxhlet apparatus using n-hexane as a solvent extract. The seeds were ground and placed in a thimble. The thimble was then put into a Soxhlet tightly, and oil was then extracted using an N-hexane solvent. The temperature was set at 65 degrees Celsius for 5 hours. After cooling the apparatus to room temperature, the n-hexane and oil were segregated. A rotary evaporator was used to extract the oil from the n-hexane. The oil yield in kilograms per hectare was calculated by multiplying the seed yield of each plot by the oil content (%) of the relevant experimental unit.
Biodiesel Synthesis
The refined oil taken from soybean seed was converted into fatty acid methyl esters (biodiesel). We combined KOH with methanol in a 3:1 ratio for the transesterification process, and afterward, oil was added to this solution. This combination was heated on a hot plate at 65 degrees Celsius for 3 hours, and a magnetic stir (400 rpm) was employed to agitate the mixture. After finishing the transesterification procedure, the reaction mixture was placed in a separating funnel and allowed to settle for 36 hours. The glycerine was collected in the funnel's lowest section, and the top layer was made up of FAME, which was collected separately.
Biodiesel Qualitative Parameters
The biodiesel yield is calculated using a formula based on the amount of oil used.
Biodiesel yield is calculated on a hectare and kilogram basis by using the below formulas:
It is used to find and estimate the free fatty acids (FFA) within the synthesized biodiesel. An appropriate amount of biodiesel was mixed into the methanol and phenolphthalein (2-3 drops) as an indicator added to the mixture. Then, the solution was titrated with 0.1 KOH, and at the end of this test, a pink color appeared, and acid values were determined with the given equations below:
Table 1.
Influence of nitrogen and sulfur rates on plant height, leaves per plant, days to 50% flowering, days to 50% pods setting, number of pod bearing branches, number of pods per plant, days taken to maturity of soybean.
[i] Note: Means sharing different letter differed at 0.05 probability level. PP; plant population; PH; plant height; LPP; leaves per plant; DTF; day to 50% flowering; DPS; days to 50% pod setting; NPBB; number of pods bearing branches, NPPP; number of pods per plant; NSPP; number of seeds per pods; NSPPL; number of seed per plant; DTM; days to maturity respectively.
Saponification was checked to determine the ability of oil and synthesized biodiesel to make soap. The saponification value of soybean biodiesel was estimated by treating it with 0.5 N alcoholic (ethanol) KOH. The reflux condenser was used for heating the reaction solution at a temperature of 40°C. The mixture was heated till the color turned into a clear solution. The solution was placed under rest at room temperature to cool the flask. Phenolphthalein as an indicator was added to the mixture, and a 0.5 N HCl solution was used for titration. The titration endpoint was the appearance of a pink color, and the saponification value was determined from the given formula:
B represents titrant in mL required by the blank solution.
S represents titrant in mL required by biodiesel sample.
N represents titrant normality.
W represents biodiesel weight.
The degree of unsaturation of oil and synthesized biodiesel was checked through iodine value. An appropriate amount of synthesized biodiesel was added to the CCl4 solution. Thereafter, Wijs reagent was added with constant shaking of the solution. After addition, the mixture solution was kept in the dark for 30 minutes. After this, potassium iodide (15%) was added to the solution, and then 100 ml of distilled water was put into the mixture. This mixture was titrated against 0.1 N Na2S2O3.5H2O. In addition to an indicator, the mixture was titrated unless the yellow color disappeared and iodine values were calculated using the following equation:
B represents titrant in mL required by the blank solution.
S represents titrant in mL required by sample.
N represents titrant normality.
W represents biodiesel weight.
The standard procedures were used to estimate the calorific value in the biodiesel sample using an “oxygen bomb calorimeter”. The cetane number was obtained with the help of the given formula.
SV represents the saponification value, and IV represents the iodine value.
Specific gravity is known to be the most important parameter. This parameter was determined with the specific gravity meter DA-640. Viscosity is known to be the most important role player parameter, and it was determined with the viscometer model DV2T. Cloud point was measured by putting the biodiesel sample in the refrigerator, and temperature was maintained. The temperature at which the fogy structure seemed in a sample taken was considered a cloud point. When the movement of biodiesel changed from normal to slow, it was taken as a pour point.
Table 2.
Influence of nitrogen and sulfur rates on thousand seed weight, biological yield, seed yield, harvest index, oil content, oil yield, biodiesel yield of soybean.
Statistical Analysis
The collected data of all growth, oil yield, and biodiesel yield parameters were analyzed by using a two-way analysis of variance, and the least significant difference (LSD) test at the 5% level of probability was used for comparison of means [20]. Moreover, graphs were prepared by using Sigma-Plot 10.
Results
Morphological Attributes
The maximum plant height (54.51 cm) was recorded with 100 kg ha-1 N, which was 35.16% higher as compared to the control (Table 1). The number of leaves per plant (LPP) showed a significant increase with increasing rate of N application. The maximum (24.53) LPP was recorded with the application of 100 kg N ha- 1, while in the case of S, the maximum LPP (21.56) was again recorded with the application of 90 kg ha-1 (Table 2). Plant growth stages depend on photothermal time and both N and S application rates showed a non-significant impact on days to flowering. The minimum days to 50% flowering (49 days) were taken at 100 kg ha-1 of N along with 90 kg ha-1 of S. Likewise, N and S applications also showed non-significant impact days pod setting. The maximum days to 50% pod setting (66.45) were recorded with 100 kg ha-1 N, and similarly, the maximum days to 50% pod setting (66.55 days) were observed with 90 kg S ha-1 (Table 1). The application of S at 60 kg ha-1 gave a maximum of 4.38 pods bearing branches, while the application of 50 kg N ha-1 gave a maximum of 4.37 pods bearing branches (Table 1).
Yield and Yield Attributes
The maximum pods per plant (42.56) was achieved at 50 kg of N ha-1, which was statistically on par with 100 kg N ha-1. Likewise, 90 kg of S ha-1 gave the greatest pods plant-1 (42.55), which was 22.27% higher as compared to the control (Table 2). Likewise, maximum speed per pod (2.95) was achieved at 100 kg N ha-1 and 90 kg S ha-1, which was 62% higher as compared to 0 kg S and N ha-1. Maximum 1000 seed weight (227.30 g) was achieved at 50 kg N ha-1 and 60 kg S ha-1, which was 64.51% higher than the control and statistically on par with 50 kg N ha-1 and 90 kg S ha-1 (Table 5). However, fertilization of S and N caused significant variation in the biological yield of soybeans. The maximum biological yield (2067.7 kg ha-1) was achieved at 100 kg of N ha-1, which was 52.12% higher than the control (Table 2). At 90 kg of S ha-1, the maximum biological yield (1827.1 kg ha-1) was recorded, which was 15.56% higher than when compared to the control. The increasing dose of S exhibited an increase in biological yield up to 40 kg S ha-1 (4425 kg ha-1) (Table 2).
The application of S and N interactively and individually brought about significant variation in the grain yield of soybeans. The maximum grain yield (879.77 kg ha-1) was achieved with 50 kg N ha-1 and 60 kg S ha-1, which was at par with 100 kg N ha-1 and 60 kg S ha-1 (Table 1). Interactively, the maximum harvest index (53.21%) was achieved with 50 kg ha-1 of N and 60 kg S ha-1, and it was on par with 50 kg ha-1 of N, 30, and 90 kg S ha-1 (Table 3).
Table 3.
Interactive effect of nitrogen and sulfur on thousand seed weight, seed yield, harvest index, oil content, oil yield, biodiesel yield of soybean.
Oil Content
The maximum oil content (19.77%) was obtained with 50 kg of N and 60 kg of S per hectare, which was 29.13% higher than the control, and it was at par with 100 kg of N and 90 kg of S per hectare (Table 2). Similarly, the application of N and S enhanced the oil yield significantly. Maximum oil yield (177.04 kg ha-1) was achieved with 50 kg N ha-1 and 60 kg S ha-1, which was 102.53% higher than the control, and it was on par with 100 kg N ha-1 with 60 and 90 kg S ha-1.
Biodiesel Yield
Maximum biodiesel yield L kg-1 (0.1483) was recorded with 50 kg N ha-1 and 60 kg S ha-1, which was 49% higher than the control. Maximum biodiesel yield L ha-1 (132.78 L ha-1) was achieved at 50 kg N ha-1 and 60 kg S ha-1, which was 133.73% higher than the control. S with N had a significant influence on biodiesel yield L ha-1 comparatively with the absolute control (Table 2).
Physio-Chemical Properties of Bio-Diesel
The viscosity of soybean oil and their refined methyl ester were checked. It was found that the maximum oil viscosity of 71.37 mm2 s-1 was obtained with 50 kg of N and 30 kg of S. While the minimum oil viscosity of 53.81 mm2 s-1 was obtained with 100 kg of N and 60 kg of S. The viscosity of oil obtained from 50 kg of N and 30 kg of S was 32.63% higher than oil obtained from 100 kg of N and 60 kg of S. The maximum viscosity of synthesized biodiesel was 5.19 mm2 s-1, which was recorded with 100 kg of N with no application of S, while the minimum viscosity was 1.05 mm2 s-1, recorded with 50 kg of N with no application of S, respectively (Table 4). The maximum calorific value of 40.2 kJ/g was obtained with 100 kg of N and 60 kg of S per hectare (Table 4). The maximum acid value of oil 3.36% was recorded with 50 kg of N and 30 kg of S, while the minimum acid value of oil 1.68% was observed with no N application and 30 kg of S. The maximum acid value of synthesized biodiesel was 1.12 mg KOH/g, and it was obtained with 50 kg of N with 30 kg of an S application (Table 4). Moreover, the maximum iodine value of synthesized biodiesel was 130 g; I2/100g was obtained at 100 kg of N and 60 kg of S. The minimum iodine value of synthesized biodiesel was 118 g I2/100g obtained at no application of N and 60 kg of S, respectively (Table 4). The saponification value of synthesized biodiesel from soybeans was checked using the standard procedure. The maximum saponification value of synthesized biodiesel was 199 mg KOH g-1 and was recorded with 100 kg of N and 90 kg of S, while the minimum saponification value of synthesized biodiesel was 190 mg KOH/g, which was obtained with 50 kg of N and 90 kg of S, respectively. The cetane number of synthesized biodiesel from soybeans was checked using the standard procedure. The maximum cetane number of synthesized biodiesel (47.9) was recorded with 50 kg of N and 30 kg of S, while the minimum cetane number of synthesized biodiesel (45.32) was recorded with 50 kg of N and 90 kg of S, respectively. On the other hand, the maximum cloud point of synthesized biodiesel was -4°C, and it was noted with 50 kg of N and 60 kg of S, and the minimum cloud point of synthesized biodiesel was -3°C (Table 4).
Table 4.
Impact of nitrogen and sulfur rates on quality parameter of biodiesel of soybean.
Principal Component Analysis
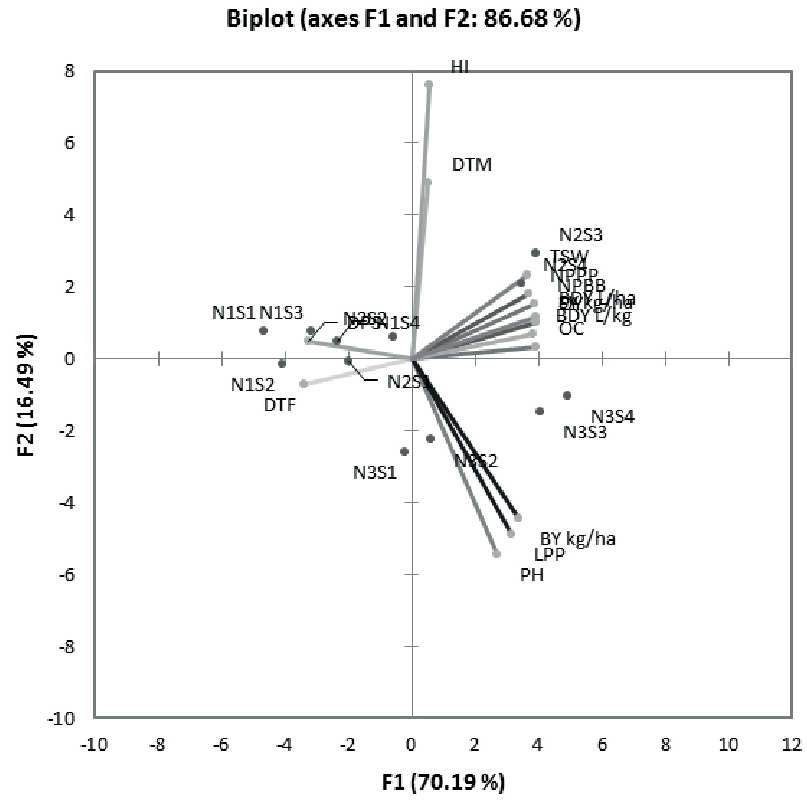
The loading plots of PCA for the effect of fertilization of nitrogen and sulfur on soybeans are given in Fig. 2. Among all the major components, the first two components, PCA1 and PCA2, constitute more than 86.68% of the entire database and represent the largest proportion of all components. In this, PCA1 contributes 70.19% and PCA2 contributes 16.49% of the entire dataset. The results indicate that BY, LPP, PH, TSW, NPBB, OC, OY, and BDY were positively correlated with each other (Fig. 2). The results also indicate that the application of N (50 kg ha-1) and sulfur (60 kg ha-1) showed more promising results on all studied traits as compared to other application rates.
Discussion
The exogenous application of N and S substantially improved the growth, oil, and biodiesel yield of the soybean crop. The maximum uptake of nutrients results in more plant height which is the depiction of the plant’s genetic diversity, and more heighted plants also have the capacity to bear more leaves [21]. Plant height was increased with sulfur application, owing to the fact that sulfur improves the accumulation and uptake of other nutrients, which ensures better plant growth [22-24]. The increase in days to 50% flowering was observed with S and N application, owing to the fact that both nutrients promote vegetative growth and delay maturity [25, 26]. The significant increase in the number of soybean branches and pods was noted with N and S application, which aligns with the findings of earlier studies [22, 27-33]. Nitrogen and S ensure better assimilated production, which leads to better fertilization, resulting in better seed yield and quality [34, 35]. The application of sulfur might have improved the accessibility of the nutrients to the soybean crop owing to the enhanced nutritional environment, which affects energy transformation, enzyme initiation, synthesis of chlorophyll, and improved carbohydrate metabolism, and hence seed yield [36]. Sulfur is also part of enzymes and amino acids; therefore, it is directly involved in plant metabolic reactions. The supply of sulfur affects changes in N metabolism due to its role in protein synthesis [37], hence S application leads to an appreciable increase in growth and yield [38, 39].
The efficacy of the produced biodiesel was tested by measuring the physiochemical indices of the produced biodiesel. Usually, an acidic or basic catalyst is used to speed up the reaction so that reaction it completes in less time [40]. One of the very important properties is known as kinematic viscosity, and resistance in fluid flows has a direct relation to viscosity [41]. During this study, the maximum viscosity of synthesized biodiesel was recorded with 100 kg of N. As in the ASTM standard, the KV of oil and synthesized biodiesel ranged from 6 to 248 mm2 s-1 and 1.9 to 6 mm2 s-1, respectively [42]. As for the findings of Karmakar and co-workers, the reported value of viscosity of soybean seed biodiesel was 4.5 mm2 s-1 [43].
The performance of the engine improved with greater calorific value due to the release of higher heat. The higher the calorific value, the better is the quality of the fuel [44]. During this study, the diesel with the highest calorific value was obtained from 100 kg N and 60 kg S treated plants. That quality of biodiesel leads to a better consumer need to achieve a yield equal to that of diesel [45]. Petrol diesel has a 12% higher calorific value than the biodiesel [46]. As reported by the work of Phan and coworkers, the calculated calorific value of soybean seed biodiesel was 10519 kcal/g [47]. According to the work, the calorific value of soybean and rapeseed biodiesel was 37620 kJ/kg and 39760 kJ/kg [48].
Fig. 2.
The scores on left and loading plots on right of principal component analysis (PCA) showing the effect of diverse treatments on studied traits.
To describe the physico-chemical properties of biodiesel, the acid value is an essential parameter. The ASTM standard acid value is lower than 0.5 mg sodium hydro oxide (NaOH) g-1 [49]. The maximum acid value of synthesized biodiesel was 1.12 mg KOH/g, which was recorded with 50 kg of N and 30 kg of an S application. The outcome of the work done by Leung’s reported acid value of soybean seed biodiesel was 0.15 mg KOH/g [50]. According to the ASTM standard, the acid value ranged from 0.5 to 0.8 mg KOH g-1 [42]. Observation of Moser, the reported acid value of soybean seed biodiesel was 0.04 mg KOH g-1 [51]. The mass of iodine quantified in grams present in 100 g of given oil is known to be the iodine value (IV), which is determined by the Wijs method [52]. The maximum iodine value of synthesized biodiesel was 130 g I2/100g, which was noted with 100 kg of N and 60 kg of S. According to the work of Leung, the range of iodine value of synthesized biodiesel of soybean seed was 138.7 g I2/100g [53, 54].
The saponification number is the degree of the totally free and combined FFA in conventional oils, fats, and wax expressed as a quantity in mg of KOH, which is pre-required for full saponification of 1 g of substance with standard procedure. The saponification value depends on the molecular mass and percentage of acids existing in biodiesel. The lower the saponification, the higher the biodiesel yield. A higher saponification value causes soap formation, and according to the ASTM standard, the iodine value might be not less than 312 mg NaOH g-1 [55]. The lower the saponification, the higher the yield of biodiesel, as the higher value of saponification has a negative effect on biodiesel and ultimately assists soap formation in the existence of KOH, which is used as a catalyst [56]. In this study, the maximum saponification value of synthesized biodiesel (199 mg KOH g-1) was noted with 100 kg of N and 90 kg of S. Likewise, Leung also found that the saponification value of soybean synthesized biodiesel was 201 mg KOH g-1 [53]. The cetane number is used to understand the fuel’s tendency to ignite. It is known to have the most important fuel properties, which are dimensionless. The ASTM range of cetane number is 47-51. The shorter the ignition delay time, the higher the CN, and vice versa. CN depends upon molecular structure, parent ester, and number of carbon atoms [54]. In our study, the maximum cetane number of synthesized biodiesel (47.9) was obtained with 50 kg of N and 30 kg of S. This is consistent with the works of different authors, where they also found that cetane values in the 45-54 [55]. Petro-diesel starts clouding at relatively low temperatures and cannot be used in cold regions, whereas biodiesel has a high cloud point, which makes it function in low-temperature areas [56, 57]. The cloud point of synthesized biodiesel from soybeans was checked using the standard procedure. The maximum cloud point of synthesized biodiesel was -4°C, which was recorded with 50 kg of N and 60 kg of S (S). The experimental finding showed a better quality of soybean biodiesel, which meets the ASTM standards, which are between -3 and 12°C.
Conclusions
The maximum increase in growth and seed yield was observed with a combined application of 50 kg N ha-1 and 60 kg S ha-1. Further, maximum biodiesel yield was also obtained with 50 kg N ha-1 and 60 kg S ha-1. However, more long-term studies are direly needed under diverse soil and climate conditions before making it a recommendation for farmers. The future studies also include an economic analysis and comparison to biodiesel-made soybean oil. Soybean is a non-competitive crop with low input costs, and biodiesel is a sustainable option that can enhance the resilience, eco-efficiency, and sustainability of our local agricultural systems.

