

Introduction
Soils, as a crucial and dynamic natural habitat, play a vital role in supporting ecosystems by offering a wide range of services. They constitute intricate environments that harbor diverse species, including bacteria and various soil-dwelling animals, all of which are essential for the proper functioning of ecosystems [1, 2]. It is thus becoming crucial to understand the physical and chemical properties of soil, as well as the interactions between the organisms that evolve in it [3, 4]. Macrofauna exerts a significant influence on the entire soil animal community and, consequently, on the various functions of ecosystems [5, 6]. Soil invertebrates play a vital role in ecological processes, being responsible for nutrient cycling [7], energy flow [8], organic matter decomposition and mineralization [9], as well as bioturbation, which directly influences the formation of channels, pores, and aggregates in the soil [10].
Soil macrofauna density depends on various management practices such as fertilization, liming, soil compaction, porosity, nutrient and mineral availability, as well as factors such as osmotic pressure [11, 12]. Compacted soil becomes anaerobic, limiting the circulation of air and water, which is not conducive to certain organisms [13]. Agricultural practices favoring this compaction led to a reduction in macrofauna. Land use practices can exert a strong influence on the abundance, diversity, and composition of soil macrofaunal communities [14]. Changes in land use can lead to changes in species composition and distribution. The transformations and intensification of land use change are significant enough to influence not only plant communities, but also soil food webs, modifying interactions between above- and below-ground communities [15].
Soil macrofauna plays a crucial role in soil bioturbation, aeration, decomposition of organic matter, and regulation of nutrient cycles. Their activity contributes to the formation of favorable soil structures, improving water retention and nutrient availability, thereby promoting healthy and sustainable plant growth [16].
The type of land cover and the use of agrochemicals may reduce the activity of certain individuals or more sensitive groups. These changes in land use have a direct impact on wildlife communities [10, 17, 18]. The activity, richness, and diversity of organisms can be influenced by variations in vegetation type, plant litter quality, and seasonal changes [19]. Changes in vegetation in the Amazon region have had an impact on soil macrofauna [20, 21]. Agroforestry systems also offer protection to soil macrofauna, which are affected by temperature variations and drought stress [22]. Optimizing the management of these systems helps to maintain the stability of macrofauna populations [8] and, consequently, to preserve soil quality [23]. In addition, the configuration and composition of communities are influenced by organic matter inputs from tree cover [24] and the structure and composition of communities are influenced by organic matter inputs from tree cover [25, 26].
To better understand the abundance and diversity of faunal groups, as well as their links with the chemical, physical, and management characteristics of soils, multivariate analysis methods are widely used [27, 28], which can provide relevant information for understanding the joint variability of response variables, thus facilitating the interpretation of biological data [29, 30]
The aim of this study was to establish, for the first time, the abundance and diversity of soil macrofauna in different vegetation types at an experimental station in a semi-arid zone in eastern Algeria with minimal human disturbance.
Materials and Methods
Study Sites
Samples were taken at the Institut Technique des Cultures Maraîchers et Industriels (ITCMI) located 16 km from the town of Oum El Bouaghi (eastern Algeria) on Route Nationale No. 10 linking the Wilaya of Oum El Bouaghi and the daïra of Aïn Beïda at a latitude of 35 ° 53 ′ 00 ″ N, 7 ° 07 ′ 00 ″ E at an altitude of 891 m. Samples were also taken from a variety of habitats, including fallow land, durum and soft wheat fields, garlic, onion nurseries, apples, olive, apricot, and pistachio trees. A total of 10 vegetation types were sampled in this study.
The region enjoys a continental climate, classified as semi-arid in the bioclimate, with cold winters and hot, dry summers. Precipitation is irregular, with winds predominantly from the southwest, west, and northwest. Precipitation levels range from a minimum of 107.7 mm to a maximum of 392 mm per year, with only 2 mm in autumn. Average temperatures range from 6.11°C in December to 38.27°C in August. The lowest average temperature, recorded in December, is 2.07°C, while August stands out as the hottest month, with an average of 22.14°C [31].
Soil Characterization
The soil characteristics under different cropping systems are summarized in Table 1. Variations in pH are observed, with higher values found in apricot orchards (8.64) and lower values in onion crops (7.14). Organic carbon percentage also varies, being high in durum wheat fields (16.87%) but low under apricot trees (1.06%). Total limestone levels differ, with high values in olive groves (18.26%) and lower values in pistachio orchards (2.49%). Active limestone is present in higher quantities in apricot orchards (17.87%) but in lower quantities in apple orchards (6.32%). Additionally, phosphoric acid is less present in soft wheat fields (1.52 ppm) but higher in onion crops (3.38 ppm). Exchangeable cations are more abundant in onion crops (25.77 meq/100 g) and garlic (24.34 meq/100 g), while the lowest value is recorded in olive groves (12.30 meq/100 g). Furthermore, electrical conductivity is highest in onion crops (612 µS/cm) and lowest in apple orchards (123 µS/cm).
Table 1.
Physico-chemical characteristics of soil horizons (0-20cm).
Sampling Method
The soil fauna research used two sampling methods to obtain a more complete picture of the edaphic fauna, covering a grid of 12 points at 10-meter intervals, totaling 2,100 m² in each area studied. The first method involved pitfall traps with glass bottles containing a detergent solution, leaving the traps in the field for 72 hours before sorting the collected organisms using specific mesh sieves; this method was adopted by many researchers [10, 32]. The second method involved extracting soil monoliths as reported in TSBF [32], then preserving the collected organisms in ethyl alcohol. After collection, organisms were identified to the highest possible taxonomic level with the aid of a stereoscopic microscope, in accordance with [33].
The parameters studied included species numbers and abundances. These data were used to calculate various ecological indices such as the Shannon-Wiener index (H), Pielou’s species regularity index (E), Margalef’s species richness index (DMg), and Simpson’s dominance index (D).
R statistical software was used to perform multivariate component analyses (PCA) on the sampled areas to assess relationships between variables. In addition, a cluster analysis was conducted using the Euclidean distance between edaphic fauna abundances to group areas according to their similarity.
Results and Discussion
Composition and Abundance
The macrofauna of soil found in various cultures is made up of three distinct branches: Arthropods, which have ten orders; mollusks, which are represented by a single class and order; and finally, anelidae, which only have one class and one identified order. The most abundant phylum was Arthropoda, ten orders. The results of this study support the conclusions that Arthropoda is the largest phylum with the greatest number of members in the kingdom Animalia [34]. The analysis results show that Hymenoptera (Formicidae) has the highest mean at 51.2 (p-value 0.0047), followed by Coleoptera with a mean of 48.7 (p-value 0.0428). Trombidiforma has a mean of 23.9 (p-value 0.3306, non-significant). Stylommatophora has a mean of 18.8 (p-value 0.0190), Larva Coleoptera 11.9 (p-value 0.0345), and Araneae 10.8 (p-value 0.0018). Diptera shows a mean of 8.5 (p-value 0.2595, non-significant), Isopoda 4.8 (p-value 0.1800, non-significant), and Julida 3.9 (p-value 0.0301). Collembola has a mean of 2.4 (p-value 0.0356), Haplotaxida 1.8 (p-value 0.0556, slightly non-significant), and Hemiptera 1.5 (p-value 0.1848, non-significant). Other authors found that springtails dominated, followed by Hymenoptera, Acarina, Myriapoda, Coleoptera, Orthoptera, and Araneae. According to the authors, Formicidae dominated in agricultural fields, followed by Coleoptera and Araneae [35]. Similar results were observed when studying the soil arthropod fauna under Bt cotton cultivation [36, 37]. This sequence of decreasing soil arthropod abundance was also confirmed [38]. Table 2 shows that a total of 1882 specimens were collected in the course of the study, and the average abundance of macrofauna in different cropping systems showed wide variations, being highest in pistachio (584 indiv/m2) and fallow (577 indiv/m2 ), followed by apple trees (204 indiv/m2), olive trees (112 indiv/m2), soft wheat (108 indiv/m2), apricot trees (100 indiv/m2), onions (74 indiv/m2), durn wheat (55 indiv/m2), garlic (47 indiv/ m2), and finally nurseries (25 indiv/m2). The results of our study confirm the significant impact of land use practices on soil biodiversity, corroborating previous findings. Indeed, macrofaunal diversity and abundance are closely linked to specific agricultural practices. Moreover, human activities, in particular soil exploitation and management, primarily modify the composition of the edaphic community, thus leading to direct changes in the abundance and diversity of organisms [39, 40]. For example, the pistachio tree emerges as a preferred habitat for macrofauna, which concurs with the work on the influence of crop types on the presence of invertebrate species [41]. Similarly, fallow land, by promoting biodiversity, presents significant levels of macrofaunal abundance, supporting the findings on the importance of uncultivated habitats for biodiversity conservation [42]. It was noted that the presence of cotton in the vegetation on the soil promotes the formation of new habitats that are favorable to the colonization of invertebrate species as well as an increase in the amount of energy that is accessible [43]. This colonization can contribute to the ecological sustainability of production. In contrast, crops such as soft wheat, onions, and durum wheat show relatively more modest levels of macrofaunal abundance, reflecting the impacts of intensive farming practices on biodiversity [44].
Table 2.
Parameters Statistics and ecological indices used to assess communities in sampled areas.
Diversity Parameters
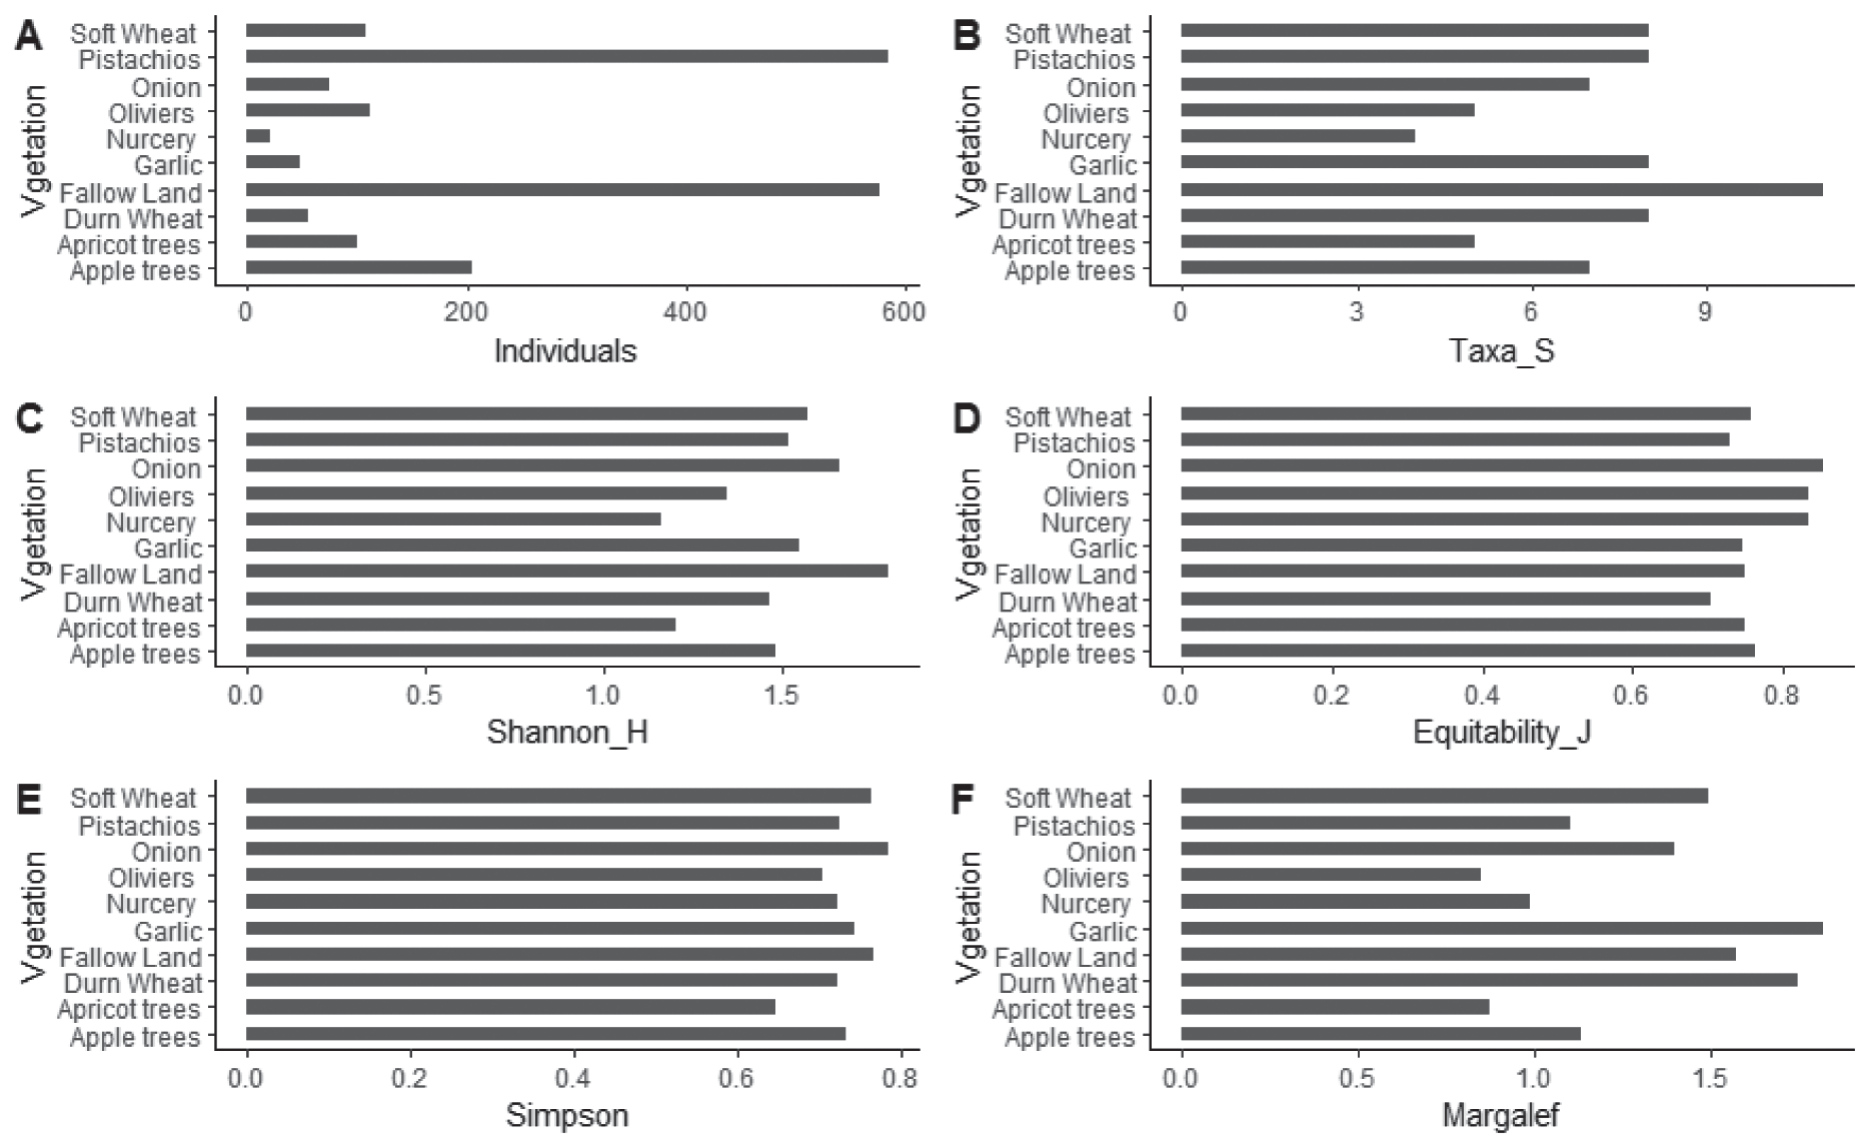
Fig. 1 illustrates crop-specific Shannon index results suggest that fallow has the highest diversity (1.79), and nursery has the lowest (1.15). Durum wheat has the lowest Equitability Index (0.70), while onions have the highest (0.85). Significant differences can also be shown in the Margalef index, where the highest score (1.81) belongs to garlic and the lowest (0.84) to olives. In conclusion, the onion scores the highest (0.78) on the Simpson index, while the apricot scores the lowest (0.64). The nursery, due to its disturbance, exhibits the lowest macrofauna abundance, confirming the negative effects of habitat degradation on biodiversity, as documented in several studies on habitat fragmentation [45]. Significant differences in important assemblages between crops are also noted, according to macroinvertebrate diversity indexes. The most elevated Shannon index value occurs on uncultivated land, which is consistent with the observation that biodiversity increases in fallow. Important assemblages differ significantly between crops, according to [45], especially in macroinvertebrate undisturbed environments. In contrast, the nursery, intensively cultivated, shows the lowest value. The highest equitability index observed in onion crops suggests a relatively uniform distribution of macroinvertebrates, where no single species dominates excessively. The index Margalef’s index, which measures the species richness of macroinvertebrates, reveals marked differences between crops. Finally, the Simpson index highlights the relative dominance of macroinvertebrate species in each crop. The onion shows the highest score, which suggests a more balanced distribution of individuals between the different species. Conversely, the lowest index is observed in apricot crops, indicating a greater dominance of Hymnoptera and beetles. These results can be attributed to environmental heterogeneity, or in other words, heterogeneity spatial analysis of environmental characteristics at each station, edaphic factors, and plant cover. These results highlight the importance of understanding the diversity of soil fauna communities for effective land management [46].
Fig. 1.
Daily abundance, taxa richness, and biodiversity indices of soil macrofauna communities in different land use.
Cluster Dendogram
Cluster analysis identified three groups based on the shortest Euclidean distance, reflecting the association between treatments. A shorter distance indicates a closer relationship between treatments. Classification according to invertebrate abundance and diversity revealed strong similarities between garlic and onion, as well as between durum and soft wheat. Similarly, similarities were observed between olive, apricot, pistachio, and apple trees. Finally, analysis by grouping distinguished fallow land from other regions (Fig. 2).
There were notable parallels between the durum and tender wheat, as well as between garlic and onion, in terms of invertebrate diversity and abundance. Invertebrate populations in apple, pistachio, olive, and apricot orchards were found to be similar. Additionally, the fallow area was easily distinguished from other areas using cluster analysis. These findings highlight the substantial influence of edaphic and environmental conditions on soil fauna populations, allowing for the differentiation of various soil management [47].
Principal Component Analysis (PCA) for Soil Fauna and Explanatory Environmental Variables
In Fig. 3, the Principal Component Analysis (PCA) shows that the main axis (PCA 1) explained 49.58% of the variance, while the secondary axis (PCA 2) explained 34.89%. This analysis allowed for the identification of soil fauna taxa by correlating these taxa with their systems and the soil’s physical and chemical attributes. The first component axis (49.58%) characterizes sites with high arthropod abundance, highlighting the importance of Coleoptera (r=0.89), Araneae (r=0.87), Diptera (r=0.82), Hemiptera (r=0.81), Coleoptera larvae (r=0.76), Stylommatophora (r=0.75), and Hymenoptera (r=0.73). In contrast, the phylum Annelida, represented by the order Haplotaxida, shows negative correlations (r=-0.29). This component isolates the fallow site, as well as pistachio and apple orchards, which have high litter accumulation rates and harbor particularly high populations of litter-dwelling arthropods, including beetles and larvae, mainly found in market garden crops and durum and soft wheat.
Fig. 2.
Dendrogram presenting the connection distance for the sampled areas (Onion, garlic, durum wheat, soft wheat, fallow land, apple trees, olive trees, apricots trees, and pistachios).
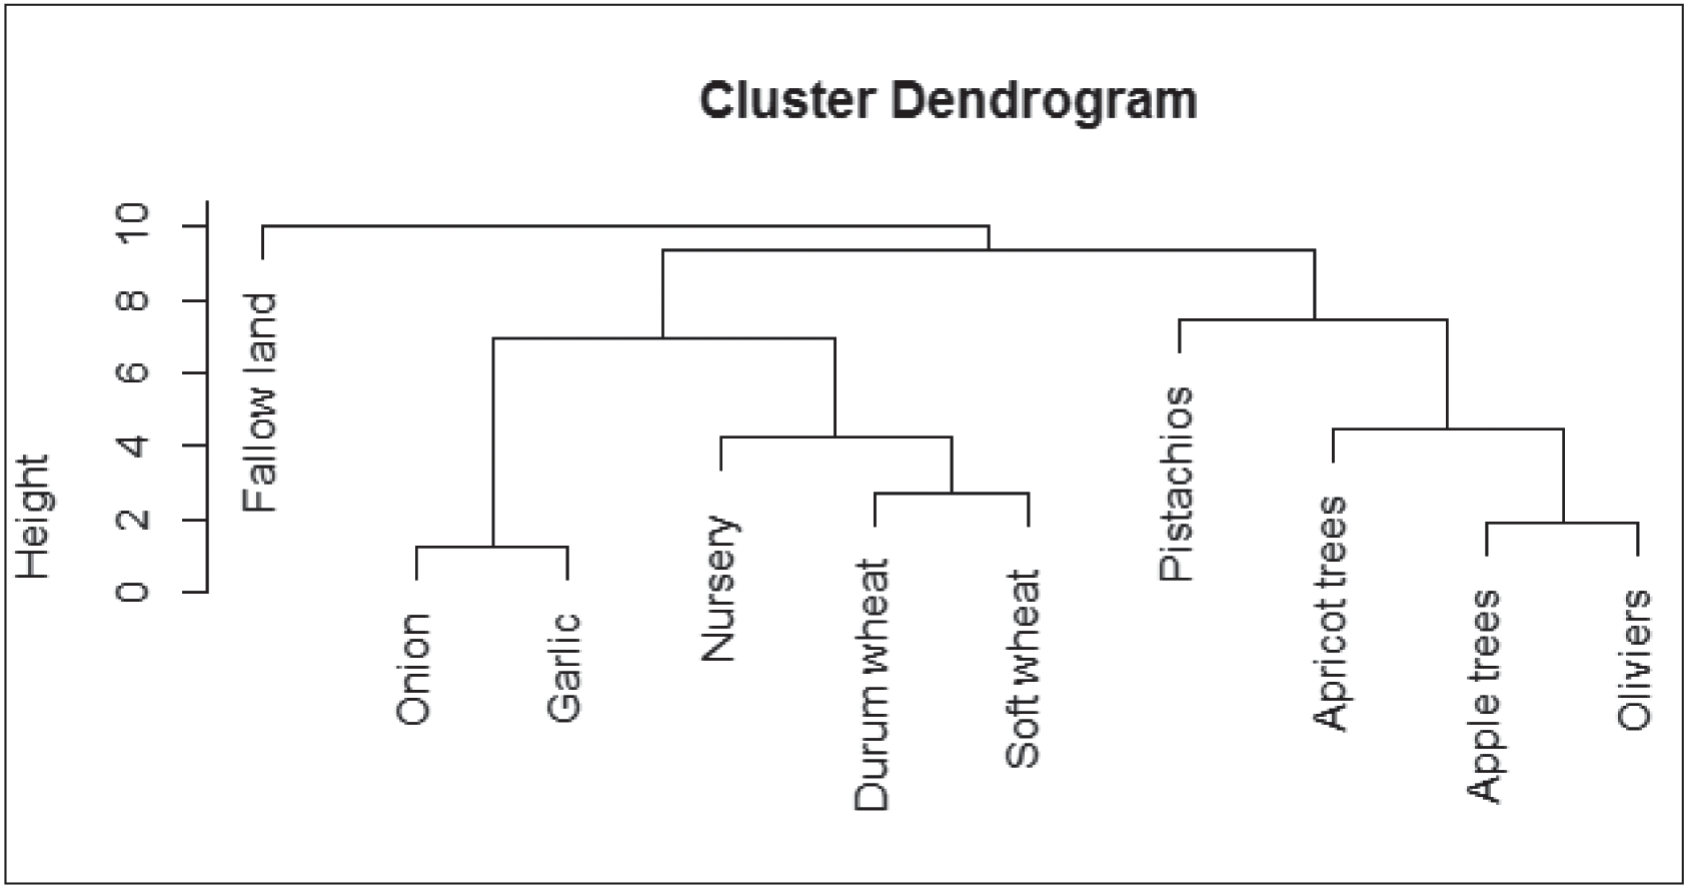
Fig. 3.
Principal component analysis of the relationship between edaphic arthropod groups and soil physicochemical attributes and planting areas: Onion, garlic, durum wheat, soft wheat, fallow land, apple trees, olive, apricots trees, and pistachios.
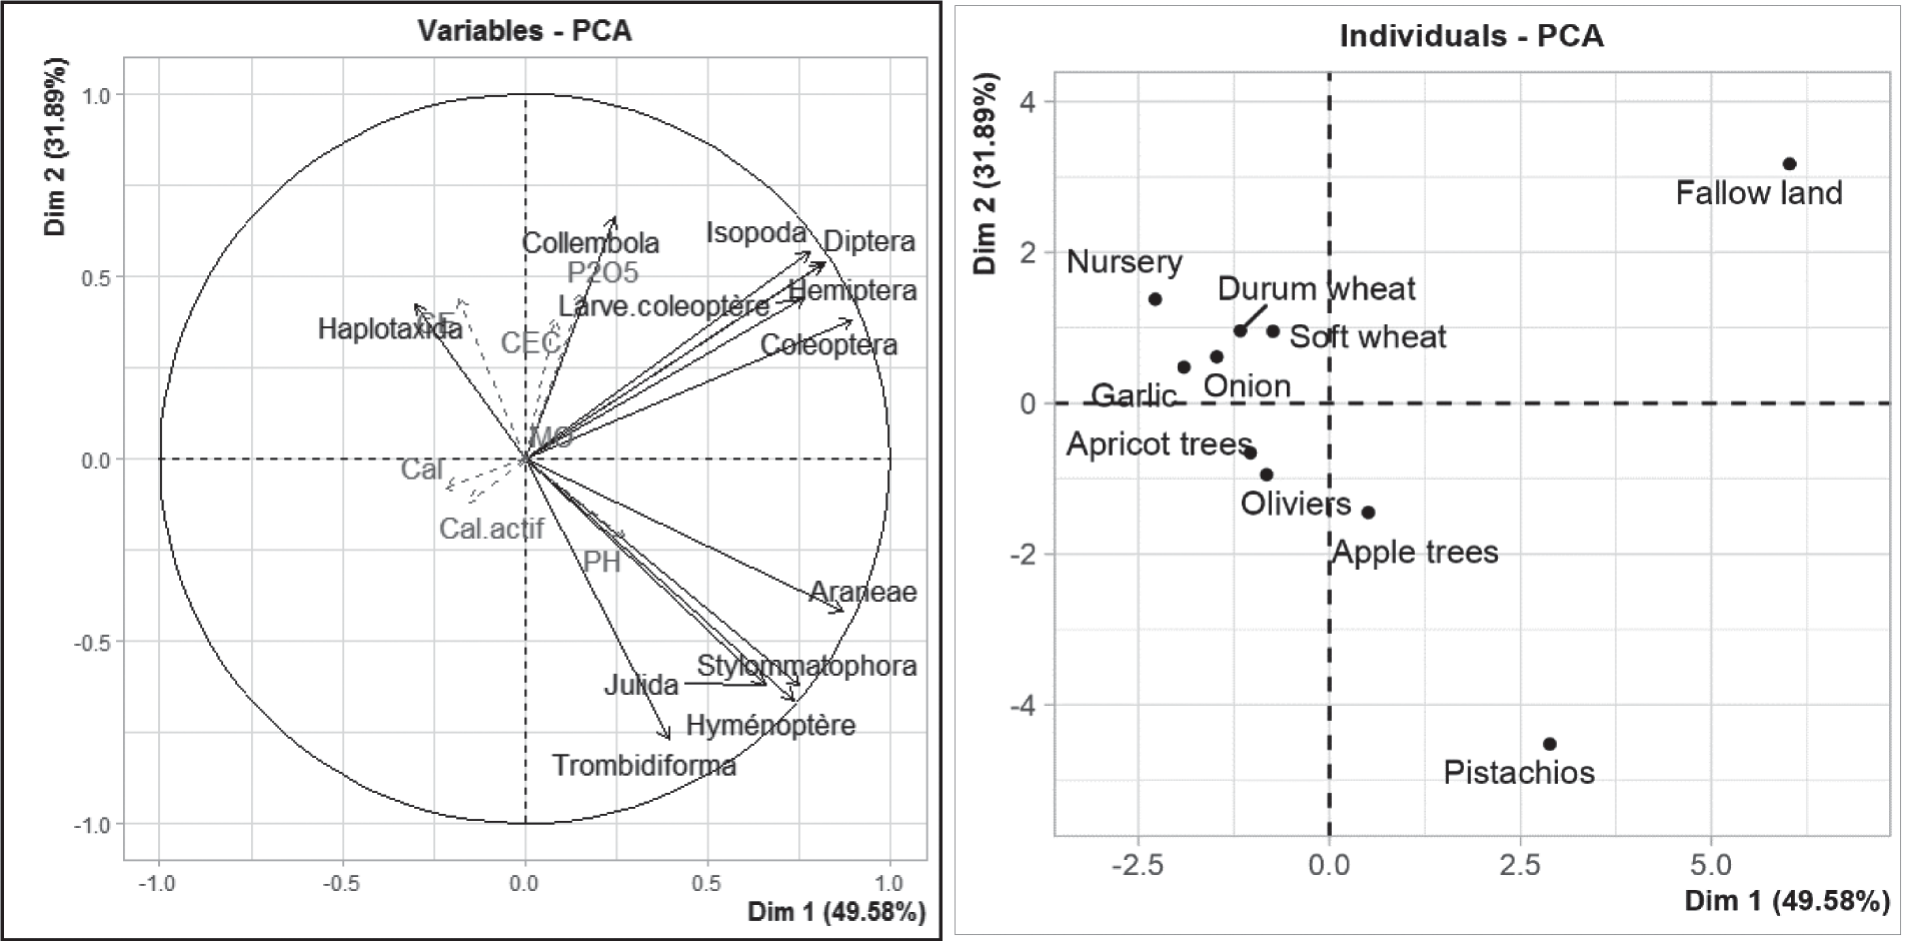
Axis II clearly distinguishes between systems dominated by Hymenoptera and Stylommatophora and those dominated by Coleoptera. It also differentiates agroforestry systems from other systems, highlighting specific associations between land-use types and invertebrate community composition.
Regarding the interaction between soil physical and chemical attributes and the presence of macroinvertebrates, Axis II emphasizes variables such as P2O5, cation exchange capacity (CEC), pH, and organic matter content, which are positioned at the intersection of the two axes and seem to favor the prosperity of most organisms in environments rich in these elements. This study illuminates the correlation between the chemical and physical characteristics of the soil and the presence of soil macroinvertebrates. Consequently, it is evident that the majority of macroinvertebrates are associated with pH, organic matter, and certain mineral salts. This is consistent with findings from other studies, most notably [48], which discovered correlations between soil pH and the total number of microarthropods in the litter. [49] found positive correlations between pH and soil abundance, and these results are similar. The variation may be attributed to the correlation between pH and soil organic matter, as highlighted by [50], which underlined that “the range of tolerance to soil pH depends on the species” and gave less weight to the pH factor. According to [51], the diversity and distribution of soil arthropods in arid farms were significantly influenced by the pH of the soil.
Conclusion
This paper presents the first published results concerning soil macroinvertebrates in various cropping systems observed at an experimental station in Oum El Bouaghi, eastern Algeria. These systems were found to host a less diverse macroinvertebrate community than in other parts of the world. Soil fauna diversity was affected by land use, and a large dissimilarity was found in systems with agricultural occupations (Onion, garlic, durum wheat, soft wheat, fallow land, apple trees, olive trees, apricot trees, and pistachios).
Biodiversity indices showed that each land use presented dominant patterns with different degrees of relevance to the ecosystem. The fallow plot showed the greatest diversity (S=11, H’=1.79), reflecting the balanced distribution of taxonomic groups. This was an environmental response to the homogeneous management of the area. Pistachio was characterized by significant abundance, which is attributed to a greater accumulation of plant litter and organic matter, highlighting the impact of orchard management on biodiversity and soil biological activity.
The significant correlations between all soil macrofaunal groups and selected soil chemical properties show that soil chemical and physical characteristics may indirectly play a role in influencing the density, distribution, and structure of macrofaunal communities.
To ensure the preservation and sustainable management of soil fauna on a global scale, it is crucial to develop innovative study methods and foster international collaboration to compare data. Raising awareness and educating the public about the importance of preserving these often-overlooked ecosystems is also essential. By integrating these approaches, we can deepen our knowledge of soil fauna and take effective action for its conservation worldwide, helping to maintain biodiversity, soil fertility, and the sustainability of agricultural and natural ecosystems.

