

Introduction
According to statistics, China has 43.04 million household biogas plants, of which 128,976 are small and medium-sized biogas projects and 10,122 are large-scale biogas projects, with an annual output of about 1.12 billion tons of biogas slurry [1-3]. There is a vital need to manage and treat such a large amount of biogas slurry using economically and environmentally feasible methods. Biogas liquids are rich in soluble nitrogen, phosphorus, potassium, and other nutrients that are essential for crop growth, as well as amino acids, plant hormones, and other growth-inducing substances. It has been reported that biogas liquids demonstrate great potential to be used as organic fertilizers, offering a beneficial solution where biogas slurry waste is turned into a useful resource [4].
At present, there is significant emphasis in society on the need to improve the efficiency of resource utilization. Studies have been actively carried out to explore advanced solutions in agriculture and gradually establish a circular model involving the waste of pigs or cattle being turned into organic fertilizer for use as crop fertilizers [5]. However, the advancement of ideas has not always translated into the realization of successful technologies. Most biogas projects produce large amounts of concentrated biogas slurry. The utilization of biogas slurry is constrained by the seasonal limitations of cultivation, as well as the lack of rural labor, the inconvenience of transportation, and the dependence on subsidies for organic fertilizers. The slurry from many biogas projects has yet to be utilized as a resource, becoming a significant source of pollution instead. The soil and water quality on farmlands has deteriorated due to the use of large quantities of agrochemicals to maintain high yields. Agricultural processes have considerable nutrient demands, which can be served by biogas slurry and biogas residue. Biogas projects also have a massive demand for biogas liquid and biogas residue absorption [6]. Despite the high demand, the practical application of biogas slurry is limited by the lack of economically feasible, simple, effective, and reproducible technical systems. There is an urgent need to explore such systems to promote the use of biogas slurry.
Agricultural experience and previous experiments have shown that the direct return of biogas slurry to the field is the most economical and effective way to consume biogas slurry. However, the realities of agricultural systems, such as the timeframe for applying fertilizer to crops, the need for idle seasons, and limits of one crop per year in the cold northern regions, result in a large amount of unconsumed biogas slurry, which directly affects the regular operation of biogas projects. Therefore, in addition to research on the technology for agricultural applications of biogas slurry, more researchers have turned their attention to studying the purification effect of aquatic plants on biogas slurry. Aquatic plants cannot be directly utilized to treat biogas slurry, though. Lingling showed Oenanthe javanica (Blume) DC. cultivated directly in the biogas slurry died on the third day after planting. However, when the same plant was cultivated in 20-50 times diluted biogas slurry, there was a high removal rate of Total Nitrogen (TN) and Total Phosphorus (TP) from the biogas slurry, with 30-40 times dilution resulting in the highest environmental and economic benefits [7]. Linyu and Feihong cultivated spring onions in biogas slurry. They found that an ammonia-nitrogen concentration of 150 mg/L inhibited the growth of small onions, resulting in shorter primary roots and fewer lateral roots [8, 9]. When the biogas slurry was deaminated and then diluted 5-10 times for Lactuca sativa var. ramosa Hort. hydroponics, the Lactuca sativa var. ramosa Hort. grew normally, and 98.25-99.34% ammonia nitrogen (NH4+-N), 83.68%- 96.04% Chemical Oxygen Demand (COD), and 65.94%- 80.00% TP were removed. The main reason the biogas slurry needed to be diluted may be because the conductivity and ammonia nitrogen concentration of the biogas slurry were too high. Different ratios of dilution had to be carried out so that the biogas slurry could meet crop growth requirements. However, excessive dilution and denitrification consumed a large number of freshwater resources. The dilution process may also inadvertently decrease other components in the biogas slurry that promote plant growth, thus reducing the overall performance of the hydroponic system [9-11].
Due to differences in the growth characteristics of plants, the types and amounts of nutrients required throughout a plant’s life cycle will be different. Hence, it is not ideal to use only one type of hydroponic plant in a biogas slurry treatment system [12, 13]. It has been pointed out that Iris pseudacorus has a better removal effect on TN and NH4+-N, while Lactuca sativa var. ramosa Hort. and Oenanthe javanica (Blume) DC. perform better on TP. In contrast, water hyacinth has the most prominent impact on the COD and Biochemical Oxygen Demand (BOD5) degradation of biogas slurry. These results indicate that combining different aquatic plants can simultaneously remove different pollutants. Other studies have shown that the use of cabbage-Oenanthe javanica (Blume) DC. with crop rotation can significantly reduce the COD, TN, TP, and NH4+-N pollution indicators in the aquaculture wastewater, and the quality of the effluent meets the relevant discharge requirements [14-16]. These successful studies undoubtedly provide novel ideas for consuming biogas slurry, but the choice of what crops to combine is critical.
Allium tuberosum has a high tolerance to salt content, and a certain degree of salinity can even improve their quality. As such, Allium tuberosum is the preferred choice for biogas slurry hydroponic crops [17]. Oenanthe javanica (Blume) DC. is a good choice as the secondary purification crop. Although Oenanthe javanica (Blume) DC. has a lower salt tolerance compared to Allium tuberosum, high concentrations of total nitrogen and COD (Chemical Oxygen Demand) in the water can limit its growth. Due to its dense root system, strong pollution tolerance, high biomass, and ease of field management, Oenanthe javanica (Blume) DC. can be considered a suitable crop for secondary purification of biogas slurry [9, 12, 18]. Lactuca sativa var. ramosa Hort. has the advantages of a dense root system, good COD removal efficiency, and low nutrient adaptability; however, it is less tolerant to ammonia nitrogen. Lactuca sativa var. ramosa Hort.’s ability to survive in high concentrations of biogas slurry makes it a promising crop choice for biogas slurry purification.
Theoretically, biogas slurry purification can be optimized by combining different characteristics of biogas slurry purification from different crops. Thus far, there have not been any studies reporting on the effectiveness of combining Allium tuberosum, Oenanthe javanica (Blume) DC., and Lactuca sativa var. ramosa Hort. for treating biogas slurry. Therefore, in this study, a cascade treatment system was designed based on the nutrient demand characteristics of the three crops and their salt tolerance level in biogas slurry. The purification mechanisms of the different crops were explored at different steps, along with any coupling effects between the different crops. The results of our study provide a theoretical basis to effectively utilize biogas slurry while ensuring the biogas slurry discharge satisfies the required standards.
Materials and Methods
Experimental Design
The experimental setup consisted of three conventional hydroponics systems and a biogas slurry cascade treatment system. The conventional hydroponics system was used to compare the effects of the biogas slurry treatment system on the growth characteristics of the aquatic plants and analyze and evaluate the system's feasibility. The design of the conventional hydroponic system was identical to that of the cascade treatment system. The nutrient solution used was the Hoagland nutrient solution, which was supplied by Haiber Biotechnology Co (Table 1). The nutrient solution for the cascade biogas slurry treatment system was prepared by the researchers and contained the same types and levels of nutrients as the hydroponics system (Table 2).
The Biogas Slurry Cascade Treatment System
The biogas slurry cascade treatment system is depicted in Fig. 1. The system consists of floating islands in three layers. Each layer includes a plastic incubator measuring 510 mm×380 mm×290 mm, with water depth scale lines marked on the outside. The floating bed was made of polystyrene foam board (500 mm×300 mm×26.5 mm) and had twelve 25 mm diameter holes spaced 100 mm apart. A drainage valve was located 5 cm from the bottom of the tank, and the tank also contained an air stone aerator connected to the air pump (SONGBAO SB-848, with a gas output of 4.5 L/min). Each aeration session lasted for 1 hour, and there were two aeration intervals one hour apart to ensure the uniform release of oxygen in the nutrient solution.
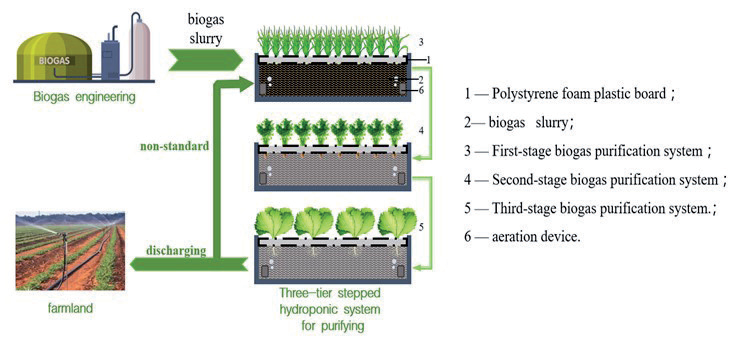
24 L of the prepared biogas slurry nutrient solution was transferred into the first floating island tank (T1) where Allium tuberosum was grown. Every 10 days, the outlet valve was opened to release 8 L of the nutrient solution into the second floating island tank (T2) where Oenanthe javanica (Blume) DC. was grown and the nutrient solution in T1 was replenished to 24 L. The level of the nutrient solution in the second floating island tank was allowed to reach 24 L. Then, after 10 days of stagnation (40 days after Oenanthe javanica (Blume) DC. transplanting), the outlet valve was opened to release 8 L of nutrient solution into the third floating island tank (T3) where Lactuca sativa var. ramosa Hort. was cultivated. When the nutrient solution in the third floating island box reached 24 L, the liquid was retained for 10 days of stagnation (40 days after Lactuca sativa var. ramosa Hort. transplanting), and then the outlet valve was opened to release 8 L. If the nutrient solution reached the requirement standards for discharge, it was discharged directly to farmland. Otherwise, the nutrient solution was reintroduced into the first floating island box to carry out another treatment cycle until the nutrient solution discharged from the third floating island box met the requirement for discharge. To ensure the reliability and representativeness of the experimental data, three sets of experiments were conducted to test the biogas cascade treatment system. The conventional hydroponic system was similarly replicated three times.
Hydroponics Plant Selection
Seedlings of Allium tuberosum, Oenanthe javanica (Blume) DC., and Lactuca sativa var. ramosa Hort. were selected for use in the hydroponics system. The seedlings were all supplied by Han Shan Xinnuo Horticulture Company in Muyang County, Jiangsu Province, China. The hydroponics plants were pre-cultivated in water, and the plants were removed when the Allium tuberosum reached a height of about 2 cm and the Oenanthe javanica (Blume) DC. and Lactuca sativa var. ramosa Hort. root lengths reached about 1 cm. Dry leaves and rotting roots were removed regularly. The plants were trimmed to the same height and fixed with sponges in the foam board holes. There were 5 Allium tuberosum in a hole, or a single plant of Oenanthe javanica (Blume) DC., or 5 Lactuca sativa var. ramosa Hort. evenly distributed on a foam board with 12 holes. Then the plants were in the foam boards above the nutrient solution of the biogas slurry.
Biogas Slurry Source and Nutrient Solution Preparation
The biogas slurry used in this study was obtained from the biogas slurry pool after the anaerobic digestion process of a dairy farm biogas project in Muping District, Yantai City, Shandong Province, China. The biogas slurry had 3.47 mS/cm conductivity, 8.24 pH, 869.52 mg/L COD content, 979.64 mg/L ammonia nitrogen, 15.36 mg/L nitrate, 1302.64 mg/L total nitrogen content, 56.37 mg/L total phosphorus, 56.37 mg/L suspended solids content, 120,000 MNP/100 ml fecal coliform bacteria, and 90% mortality of Ascaris lumbricoides eggs.
The Electrical Conductivity (EC) value of the biogas slurry was adjusted to 1.8±0.2 mS/cm using deionized water. Then, the pH of the biogas slurry was adjusted to 5.5-6.5 using 1 mol/L sulfuric acid and sodium hydroxide. 23 L of the blended biogas slurry was supplemented with the micronutrients listed in Table 2, which was considered to be the nutrient solution of the biogas slurry. The biogas slurry was replenished with deionized water up to 24 L.
Sample Collection and Measurement
Biogas slurry samples were collected between 8:00 and 8:30 a.m. on the 10th, 20th, 30th, 40th, 50th, 60th, and 70th days of aquatic plant growth. A 100 mL sample was collected each time in triplicate. The samples were mixed thoroughly and analyzed within 24 hours. The remaining samples were adjusted to pH < 2 using a 10% sulfuric acid solution and stored at 4°C in a refrigerator for future use. Conductivity was determined with a conductivity meter [19]; pH was determined by the glass electrode method [20]; COD was determined by the potassium dichromate oxidation method [21]; ammonia nitrogen content was determined by the Nano reagent photometric method, and total nitrogen content was determined by the potassium peroxydisulfate oxidation-ultraviolet spectrophotometric method [22, 23]; total phosphorus content was determined by the potassium peroxydisulfate oxidation-molybdenum antimony spectrophotometric method [22]; and suspended solids were determined by the gravimetric method [24].
Marsh nutrient solution was collected on the 30th and 70th days after aquatic plant establishment to determine fecal coliform counts and Ascaris lumbricoides egg mortality. Fecal coliform count was determined by the filter membrane method [23], and Ascaris lumbricoides egg mortality was determined by centrifugal sedimentation [25]. Three Allium tuberosum plants were randomly selected on the 30th and 50th days after planting. Three Allium tuberosum, one Oenanthe javanica (Blume) DC., and one Lactuca sativa var. ramosa Hort. plant were randomly chosen on the 70th day after planting. Tissue paper was used to absorb the moisture on the plants, and then the plants were washed and weighed. The relative growth rate of the plants was calculated according to (1). The roots and edible parts of the weighed Allium tuberosum, Oenanthe javanica (Blume) DC., and Lactuca sativa var. ramosa Hort. were separated; the edible parts were used for yield assessment and determination of crude fiber content, and the roots were used for determination of root vigor. Yield was calculated according to (2) crude fiber was determined using the filter bag method [26], and root vigor was determined using the TTC method [27].
In the formula:
W0 — Fresh weight at transplanting, in grams, g;
W40 — Fresh weight on day 40, in grams, g.
In the formula:
Yield per unit area — Total weight of edible portion of vegetables produced in one hectare, in kilograms per hectare, kg/ha;
m — Average weight of edible portion per plant in grams per plant, g/plant;
ρ — Planting density in plants per square meter, plant/m2;
1000 — Weight unit conversion factor;
10000 — Area unit conversion factor.
Results and Discussion
Removal of Pollutants from Biogas Slurry Nutrient Solution by the Cascade Treatment System
As can be seen from Table 3, after 10 d of retention, the COD content of the nutrient solution in the T1 floating island tank decreased rapidly from 262.5 mg/L to 230.4 mg/L, a decrease of 12.2%. Since retaining the nutrient solution for 10 d required the discharge of 8 L of nutrient solution into T2 and the replenishment of 8 L of pure nutrient solution, there would be an accumulation of COD content. The COD content of the nutrient solution retained for 20 d in T1 increased by another 35.5% compared with that of the 10-d retention. As the nutrient solution was discharged into T2 and replenished with pure biogas slurry again, the COD content of the nutrient solution at 30 to 60 d showed a gradual increase and then decreased slightly after 70 d. However, there was no significant difference in the COD content of the nutrient solution at 40 and 60 d (P<0.05).
The COD content of the initial nutrient solution entering T2 decreased from 230.4 mg/L in T1 to 209.8 mg/L after 10 d of retention, a decrease of 8.9%. As the retention time of the nutrient solution in T2 increased, the COD content at 10 d to 30 d gradually increased, but the difference was nonsignificant (P<0.05). From the 40th d, the COD content of the biogas slurry nutrient solution in T2 decreased. The COD content at 60 d decreased by 9.2% compared with that of the biogas slurry nutrient solution entering T2 for the first time.
The COD content of the first slurry entry into T3 decreased by 5.2%, 19.0%, and 36.3% after 10, 20, and 30 d of retention, respectively, from a starting point of 219.7 mg/L COD content at the exit of T2.
The phosphorus content in the biogas slurry nutrient solution decreased overall regardless of location in the first, second, or third floating island tank or the retention time. Compared with the original biogas slurry nutrient solution, the elemental phosphorus content in the biogas slurry nutrient solution discharged from T3 after three-stage purification was reduced by 89.2%.
Unlike phosphorus, NH4+-N in the nutrient solution from T1 showed a significant increase (P<0.05) after 10 d of retention, followed by a general decreasing trend. However, there were increases and decreases during the subsequent retention period. Compared with the original biogas slurry nutrient solution, the NH4+-N concentration decreased by 42.9% after 70 d of retention in T1. Then, after continuous purification in the second and third floating island tanks, the NH4+-N concentration in the biogas slurry nutrient solution discharged from T3 decreased by 89.5%. Similar to NH4+-N, the TN concentration in the biogas slurry nutrient solution discharged from T3 decreased by 78.0% after purification in the third floating island tank.
COD removal methods mainly include adsorption, chemical coagulation, ozone oxidation, and biological methods [28, 29]. The results of the study showed that the COD content of the biogas slurry nutrient solution decreased significantly after 0-10 d of retention in T1 (P<0.05), which was mainly due to the adsorption of suspended solids by the floating plate and the natural settling of suspended solids [30]. Although the root system of the Allium tuberosum has a specific adsorption effect on COD, the adsorption effect of the root system was not the main factor in COD reduction because the Allium tuberosum was newly planted and the root system was in the initial stage of development [31]. The COD content of the nutrient solution in T1 increased significantly when the solution remained in T1 for 10- 20 d. This was because 8 L of the nutrient solution was discharged to T2 after 10 d of the nutrient solution, which was then replenished with an equal amount of the original biogas slurry, resulting in a significant increase in COD content. During the subsequent 30-70 d retention period, although the COD content showed an increasing trend, the increase was significantly weakened, and there was no significant difference in COD content in the digestate nutrient solution during the 40-60 d retention period. This indicates that the development of the Allium tuberosum root system had matured, and dynamic equilibrium had been achieved for the interception and adsorption of COD by the root system, as well as microbial degradation and COD deposition in the digestate.
Table 3.
Impact of cascade treatment system on pollutant content in biogas slurry nutrient solution.
[i] Note: the symbol “-” indicates that there was no biogas slurry nutrient solution in the floating island tank, and the vegetables were not settled. Each value represents the mean of 3 replicates. The lower-case letters in superscript indicate significant differences at the 0.05 level between the biogas slurry nutrient solution at varying periods of retention in the same floating island tank.
According to the experimental design, 8L of nutrient solution was discharged from T1 to T2 after every 10 d of retention until the nutrient solution in T2 reached 24 L. After another 10 d of retention, the nutrient solution was discharged to T3, which increased the COD content of the nutrient solution in T1 in the first 30 d of retention. COD content in T2 showed an increasing trend. In the following 30 d retention period, the COD content in T1 was in equilibrium during the 40-60 d retention period, which, together with the continuous extension of the root system of Oenanthe javanica (Blume) DC. and the expansion of regenerative roots, resulted in an increasing density of the root system and a significant increase in the retention and adsorption capacity, which was the main reason for the gradual decrease of COD content in the biogas slurry nutrient solution in T2 [31, 32]. Table 3 shows that the COD content of the nutrient solution in T3 decreased significantly during the 30 d retention period, probably because the root system of Lactuca sativa var. ramosa Hort. was more developed, with an overall net-like structure that tapered down and was long enough to reach the bottom of the floating island tank, thus enhancing the interception and adsorption of COD [7].
Phosphorus in biogas slurry is mainly in the form of phosphate, of which the proportion of soluble phosphorus is about 75%, and the proportion of phosphorus in the fine particulate state is about 25% [33]. This indicates that phosphorus removal is mainly based on plant uptake. Data showed that even if the nutrient solution in T1 was supplemented with 8 L of original biogas slurry after every 10 d of retention, the concentration of phosphorus in the biogas slurry nutrient solution of T1, T2, and T3 was decreased. This result further indicates that the uptake of phosphorus by Allium tuberosum exceeded the amount of phosphorus contained in the supplemented biogas slurry during the 10 d retention period. The phosphorus concentration in T1 and T2 showed a significant decrease in the 20 and 40 d retention periods, respectively, mainly because Allium tuberosum and Oenanthe javanica (Blume) DC. were in the peak period of leaf growth during this period, which creates a higher demand for phosphorus [34, 35].
The NH4+-N concentration of the biogas slurry nutrient solution in T1 decreased significantly in the first 10 d retention period, mainly due to the absorption of NH4+-N by Allium tuberosum. Then in the subsequent 20-30 d, 40-50 d, 60-70 d retention periods, there were increases and decreases in the NH4+-N concentration, which may be related to the reduction in leaf area caused by the planting and harvesting of Allium tuberosum. The reduction in leaf area would have resulted in a reduction in photosynthesis, which in turn reduced NH4+-N uptake. The regular addition of stock solution to the biogas slurry increases the ammonia nitrogen content, while the rapid leaf production of Allium tuberosum increases the leaf area. The rise in NH4+-N uptake due to increased leaf area exceeded the addition of NH4+-N from the stock solution. The NH4+-N concentration in the biogas slurry nutrient solution in both T2 and T3 showed a decreasing trend, which indicated that the amount of new NH4+-N added by regular addition of the raw biogas solution could not offset the amount of NH4+-N required for the biogas slurry of Oenanthe javanica (Blume) DC. and Lactuca sativa var. ramosa Hort.
Allium tuberosum had the highest rate of ammonia nitrogen removal, while Oenanthe javanica (Blume) DC. had a moderate rate of removal, and Lactuca sativa var. ramosa Hort. had a relatively poor rate of removal in T1. This result was mainly due to the physiological characteristics of hydroponic crops. Allium tuberosum is more tolerant and absorbent to high concentrations of ammonia nitrogen; Oenanthe javanica (Blume) DC. has medium tolerance; and Lactuca sativa var. ramosa Hort. is more inclined to nitrate nitrogen uptake [35-37]. Since the nitrogen nutrients in the digestate were dominated by NH4+-N, which accounted for about 90% of the total nitrogen [2], the trend of total nitrogen in the system was similar to that of NH4+-N. The difference in trends between total nitrogen and ammonia nitrogen in T3 can be primarily attributed to the previously discussed preference of Lactuca sativa var. ramosa Hort. for nitrate nitrogen uptake.
Removal of Suspended Solids from Biogas Slurry Nutrient Solution by the Cascade Treatment System
After 10 d of retention in T1, the suspended solids content of the biogas slurry nutrient solution decreased significantly (Table 4). From 20 d to 50 d of retention, the suspended solids content increased, and there was a significant positive correlation between the suspended solids content and retention time. The suspended solids content increased slightly from 50 d to 70 d, but there was no significant relationship between the suspended solids content and the retention time. The suspended solids content of the biogas slurry nutrient solution entering T2 decreased by 20.5% after a 10 d retention period; however, it increased by 16.5% after the second 10 d retention period. The suspended solids content of the nutrient solution decreased during the following 40 d retention period. The suspended solids content in T3 decreased significantly with the increase in retention time and was 82.2% lower than that of the original nutrient solution after 30 d of retention.
The suspended solids content in the biogas slurry nutrient solution in T1 increased during the 10-70d retention period, mainly because of the low density and short root system of Allium tuberosum, which could not significantly retain the suspended solids in the biogas slurry nutrient solution, leading to a gradual increase in the suspended solids content as the original biogas slurry solution was regularly being added to the system [31, 32].
Table 4 shows that there was an elevated level of suspended solids content in the biogas slurry nutrient solution for the 50-70 d retention period, but there was no significant difference between the data. This may indicate that the Allium tuberosum root system in this period was fully developed and mature. The retention capacity of the root system and the sedimentation rate of suspended solids were in relative equilibrium, and the difference in concentration of suspended solids between the raw liquid and the discharged nutrient solution was gradually decreasing each time, which was the reason for the slight increase in the data. However, the difference was not significant [38].
The gradual increase of suspended solids concentration in T1 in the first 20 d was mainly due to the gradual rise of the concentration of the discharged nutrient solution in T1. However, the gradual decrease of the suspended solids concentration in the following 40 d in T2 indicated that the root system of Oenanthe javanica (Blume) DC. continued to elongate and become denser, which resulted in enhanced retention of suspended solids [5, 7, 39]. The rapid elongation of the Lactuca sativa var. ramosa Hort. root system and the intertwining of the conical mesh resulted in a noticeable retention of suspended solids. Hence, the concentration of the suspended solids in the biogas slurry nutrient solution entering T3 decreased significantly [31, 32].
Inactivation of Pathogenic Bacteria in Biogas Nutrient Solution by the Cascade Treatment System
Fecal coliform counts decreased by 90.8% after 30 d of biogas slurry nutrient solution retention in T1. The fecal coliform counts in the digestate nutrient solution after a retention period of 70 d were again reduced by 90.9% compared to the 30 d retention period. The number of fecal coliform counts in the digestate nutrient solution in T1 was also reduced by 90.9%. Similarly, after repurification in T2 and T3, the fecal coliform counts in the discharged biogas slurry nutrient solution were reduced by 99.25% compared to the original biogas slurry nutrient solution. The data indicated that the number of fecal coliforms in the biogas slurry nutrient solution could be reduced by one order of magnitude (106→105→104) for every 30 d of retention. Similarly, the mortality rate of Ascaris lumbricoides eggs in the biogas slurry nutrient solution discharged from T3 reached 100% after three levels of purification (Fig. 2).
Both the number of fecal coliform bacteria and the mortality rate of Ascaris lumbricoides eggs in the biogas slurry nutrient solution in T1, T2, or T3 decreased gradually as the retention time increased. The main reason being that the system was set up with an air pump for supplemental oxygen, and the continuous aeration inactivated the pathogenic bacteria [40-42]. At the same time, the extra enzymes secreted by the roots of aquatic plants also had a specific bactericidal effect, which further contributed to the decrease in pathogenic bacteria in the biogas slurry nutrient solution [40, 43- 45].
Influence of Biogas Slurry Cascade Treatment System on the Growth of Hydroponic Plants
Compared with the conventional hydroponic system, the root vigor of the Allium tuberosum, Oenanthe javanica (Blume) DC., and Lactuca sativa var. ramosa Hort. cultivated in the biogas slurry cascade treatment system decreased by 11.70%, 25.00%, and 15.78%, respectively (Table 5). In contrast, the relative growth rate and leaf crude fiber content of the Allium tuberosum, Oenanthe javanica (Blume) DC., and Lactuca sativa var. ramosa Hort. cultivated in the biogas slurry cascade treatment system were slightly higher than those in the conventional hydroponic system. However, ANOVA showed that there was no significant difference between the data (t-test, P>0.05). For yield, the Allium tuberosum, Oenanthe javanica (Blume) DC., and Lactuca sativa var. ramosa Hort. cultivated in the biogas slurry cascade treatment system were 0.62%, 5.5%, and 1.2%, respectively lower than those grown in the conventional hydroponic system.
The root vigor of aquatic plants in T3 was lower than that in the conventional hydroponic system, probably due to the high concentration of ammonia and nitrogen in the biogas slurry nutrient solution. The decrease in root vigor reduced the relative growth rate and yield of the aquatic plants. The increase in crude fiber content of the aquatic plants was mainly due to the presence of quality-enhancing nutrients, such as amino acids and proteins in the biogas slurry, which were not present in the conventional nutrient solution [12, 46].
Table 4.
Impact of the cascade treatment system on suspended solids content in the biogas slurry nutrient solution.
[i] Note: the symbol “-” indicates that there was no biogas slurry nutrient solution in the floating island tank, and the vegetables were not settled. Each value represents the mean of 3 replicates. The lower-case letters in superscript indicate significant differences at the 0.05 level between the biogas slurry nutrient solution at varying periods of retention in the same floating island tank.
Fig. 2.
Impact of the cascade treatment system on pathogenic bacteria levels in biogas nutrient solution. Note: Box plots represent fecal coliform counts (MNP/100 ml); line diagram represents the mortality rate of Ascaris lumbricoides eggs (%); each value represents the mean of 3 replicates. Lowercase letters indicate significant differences in Fecal coliform counts at the 0.05 level among different retention times of biogas slurry within the same floating island tank. Uppercase letters indicate significant differences in the mortality rate of Ascaris lumbricoides eggs at the 0.05 level among different retention times of biogas slurry within the same floating island tank. Bolded lines and letters indicate changes in the mortality rate of Ascaris lumbricoides eggs within T2
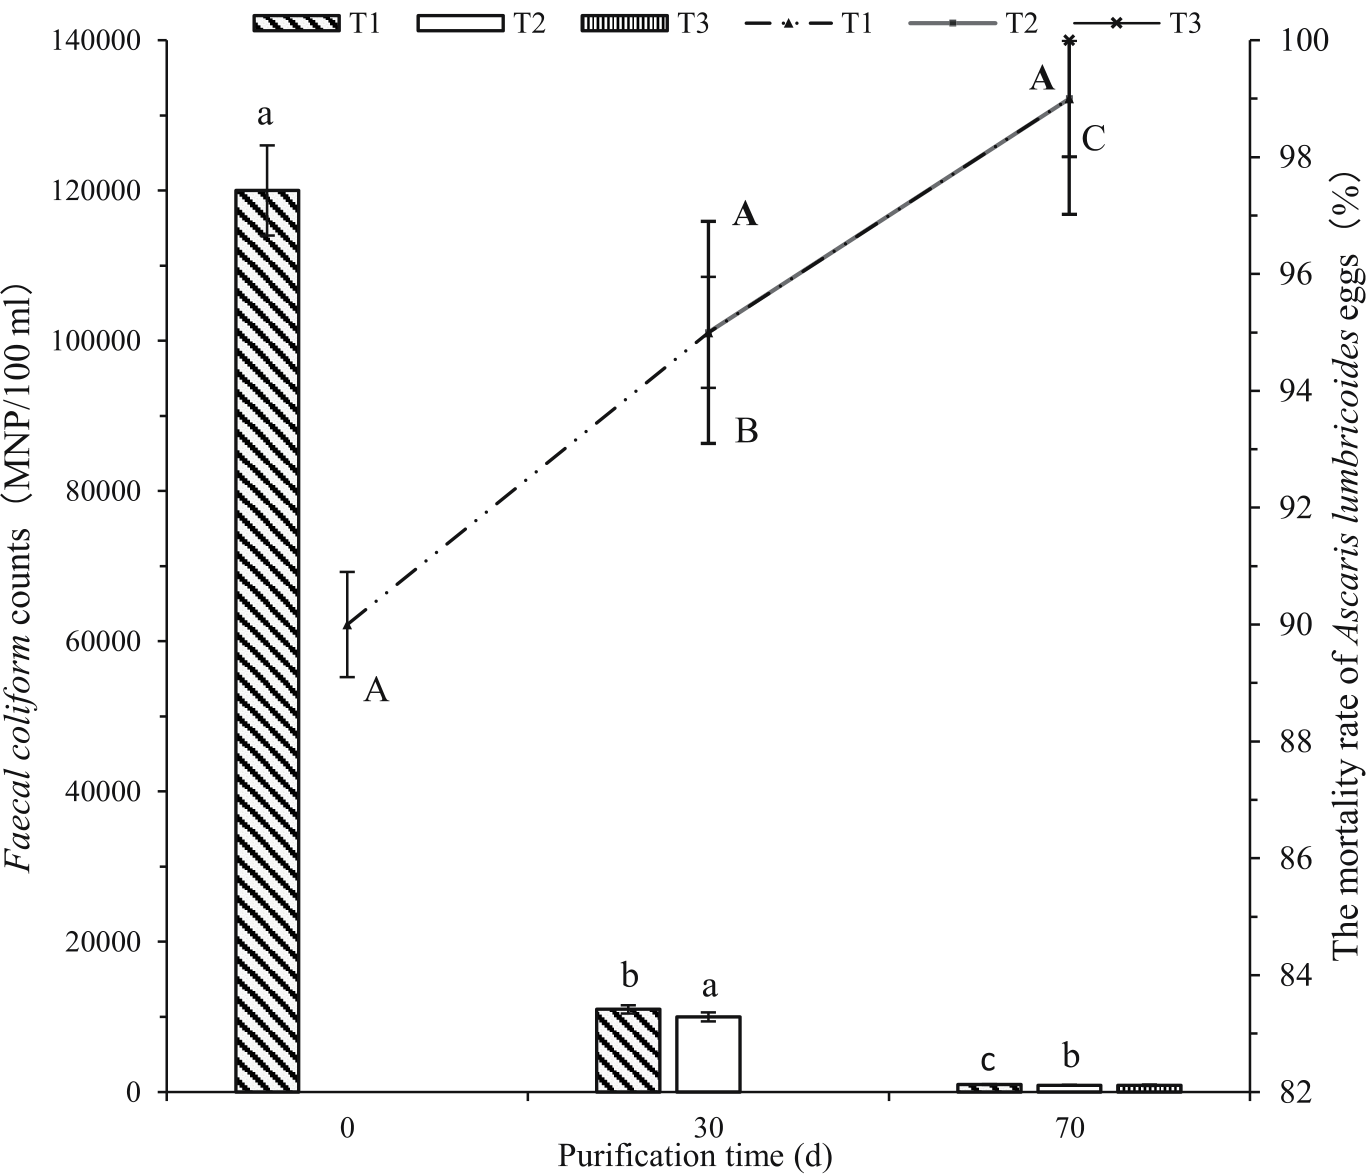
Table 5.
Influence of the cascade treatment system on the growth of hydroponic plants.
[i] Note: In the experimental period, three crops of Allium tuberosum were harvested. The corresponding root vigor, relative growth rate, and leaf crude fiber values in the table are the averages of the measured values of the three samples, and the yield was the cumulative amount of three harvested crops. Oenanthe javanica (Blume) DC. and Lactuca sativa var. ramosa Hort. were only harvested one time, and the corresponding data in the table are the measured values of the one collected sample.
Table 6.
Economic analysis of the cascade treatment system.
Economic Evaluation of the Biogas Slurry Cascade Treatment System
Table 6 shows that although the fertilizer costs of the biogas slurry cascade treatment system were only 1.85% of the conventional hydroponic system, the income from vegetable sales was 96.54% of the traditional hydroponic system, giving an income-cost ratio 52.06 times greater than that of the conventional hydroponic system. Data analysis showed that the gross profit from the conventional hydroponic system was slightly lower than that of the biogas slurry cascade treatment system. However, there were no significant differences between the two (t-test, P<0.05). With the biogas slurry discharge as the target, the cost of the biogas slurry cascade treatment system is 28.6%-37.5% that of the aeration system for treating biogas slurry.
The main reason why the fertilizer costs of the biogas slurry cascade treatment system are significantly lower than those of the conventional hydroponic system is because the biogas slurry not only contains large amounts of nutrients such as nitrogen, phosphorus, and potassium, but also has micronutrients such as calcium, magnesium, and zinc [48, 49]. Although the vegetable yield of the conventional hydroponic system was higher than that of the biogas slurry cascade treatment system, the insignificant difference in yield again directly led to a significantly higher yield-cost ratio of the biogas slurry cascade treatment system compared to that of the conventional hydroponic system.
From an environmental point of view, the NH4+-N, phosphorus, or total nitrogen in the biogas slurry is a source of pollution. Most of these pollutants are traditionally treated by aeration to meet the purification requirements for discharge. However, the biogas slurry cascade treatment system uses the pollutants in the biogas slurry as nutrient resources to grow crops, reducing equipment and facility investment costs. Thus, the cost of the biogas slurry cascade treatment system is significantly lower than that of the conventional biogas slurry aeration system.
Conclusions
The study demonstrated that the biogas slurry cascade treatment system is an effective and economical solution for managing biogas slurry. The system successfully removed significant amounts of pollutants, including achieving a reduction of 89.5% in NH4+-N, 78.0% in TN, 89.2% in TP, and a 47% reduction in COD. Additionally, the system effectively reduced suspended solids and pathogenic bacteria, ensuring that the treated slurry met environmental discharge standards. The system's cost-effectiveness was highlighted by its significantly lower fertilizer costs compared to conventional hydroponic systems while maintaining a high income-to-cost ratio. This makes it a feasible and scalable solution for large-scale biogas slurry management, with the added benefit of producing valuable hydroponic crops. Overall, the biogas slurry cascade treatment system presents a novel and environmentally sustainable approach to biogas slurry management, offering significant potential for wider application in agricultural and environmental management practices.

