


Introduction
Different abiotic stresses, like drought, salinity, heat, cold, and waterlogging, affect crop growth and development, ultimately influencing yield and productivity. In recent years, global climate change has instigated more challenges for crop production in terms of pervasive stressful conditions [1]. Drought stress is one of the burgeoning issues related to climate change in several countries, limiting crop productivity [2-4]. The incidence of water deficit stress on different scales during the crop growth period affects various biological processes like germination, growth, photosynthesis, respiration, and nutrient metabolism. As a result, yield loss occurs in crops [5]. Different stages of the life cycle of a crop determine the yield; however, seed germination and subsequent seedling growth are crucial in determining its successful production [6, 7]. Crops tend to be more vulnerable to drought stress at the germination stage and this delays crop establishment [8, 9], leading to changes in physiological and biochemical processes [10]. With the drought, the density of the plant population and the crop yield are lowered [11].
Increasing drought tolerance could enable the crop to withstand water deficit conditions while maintaining its physiological activities by producing osmolytes, antioxidants, and other stress-relieving agents, etc. [12, 13]. New drought-tolerant varieties are highly required to survive with limited soil moisture stress and produce a better yield under changing climatic conditions. Nevertheless, drought tolerance is a complex issue that is difficult to solve and involves different scientific approaches and methods. Conventional plant breeding has been successful in developing drought-tolerant varieties in the past decades. This approach facilitates the creation of new races or potential genotypes by hybridization and selection for high drought tolerance [14, 15]. However, the achievement of any crop improvement program depends on the nature and magnitude of the genetic variability present in the respective crop germplasm. Higher variability in a crop species indicates more chances to evolve promising and desired types. A detailed study of the extent of variability and nature of their heritability among the genotypes in the germplasm is the prerequisite for initiating any varietal development program.
Mung bean (Vigna radiata L.) is an important, short-duration tropical pulse crop grown in Asia, Australia, South and North America, the West Indies, and Africa. It contains an essential source of plant protein (24-26%) for the vegetarian diet. Its cultivation largely depends on monsoon rains, but low rainfall particularly during March-May impedes its normal growth and development [16]. So far, the genetic variation present in the diverse gene pool is utilized inadequately in different studies of mung bean germplasms. Ultimately, the identification of parents with superior drought tolerance is critical for future breeding.
Yet, it has also been consistently challenging to determine the degree of drought tolerance in crops with a single parameter [17]. Usually, genotypes that are found to germinate under reduced water potential fail to germinate under drought or osmotic stress, and this prevents the establishment of seedlings. Hence, studies on osmotic potential are necessary to identify genotypes appropriate for growth under water-deficit stress conditions [18]. Field screening is the primary goal, but controlling rainfall is a major concern as it interferes with stress intensity. Therefore, using a chemical like polyethylene glycol (PEG) to assess the stress responses of plants at the early seedling stage under laboratory conditions is a viable option [9]. PEG is commonly used with a seed germination medium to identify the genotypes suitable for growth under water deficit stress conditions. In this study, the variability and diversity of thirty-three mung bean genotypes were studied based on genetic variation in germination and seedling growth traits induced by PEG 6000 stress. To our knowledge, no study has been conducted to explore the variability and diversity of mung bean genotype NO = 33) based on genetic variation in germination and seedling growth traits induced by PEG 6000 stress. The objective of the present study was to explore the variability and diversity of thirty-three mung bean genotypes based on genetic variation in germination and seedling growth traits induced by PEG 6000 stress. The study aimed to identify the selection criteria for a better breeding program and to discover mung bean genotypes with high yield potential in drought-prone areas.
Table 1.
The name of the mung bean genotypes with their pedigree used in the present study.
Experimental
Experimental Site and Duration
The trial was conducted at the Laboratory of Agronomy, Hajee Mohammad Danesh Science and Technology University (HSTU), Dinajpur, Bangladesh, in 2016, under ambient laboratory room temperature with natural light conditions (8-10 hours) and relative humidity (25±0.3ºC and 74±1%, respectively). The average photosynthetic photon flux density was 200-210 µmol m-2 s-1, measured with a digital Lux meter (model LX-101, Portugal).
Plant Materials
Thirty-three mung bean genotypes, including most of the popular varieties and advanced lines, were collected from the Bangladesh Agricultural Research Institute (BARI), Bangladesh Institute of Nuclear Agriculture (BINA), and Bangabandhu Sheikh Mujibur Rahman Agricultural University (BSMRAU), Bangladesh. The list of genotypes is presented in Table 1.
Seed Curing
The stored seeds (10% moisture content) were used for the germination test. Seeds of each mung bean genotype were surface sterilized by dipping the seeds in 0.1% Mercuric chloride (HgCl2) solution for two minutes with intermittent shaking and washing up to 3 times with running tap water to remove the mercuric chloride particles for treating seed from disease-pests [6, 17, 19].
Experimental Treatments and Design
The genotypes were evaluated for drought tolerance by imposing five levels of osmotic potential (0, -0.07, -0.1, -0.2, and -0.4 MPa) with PEG 6000. The amount of PEG dissolved in water for different stress levels is presented in Table 2. The trial was set up in two factors, with completely randomized design (CRD) with three replications. Stress levels were considered factor A, while genotypes were regarded as factor B. Seventy (70) seeds of each genotype were planted on a 15 cm diameter Petri dish containing sand bed moistened by PEG solutions -0.07, -0.1, -0.2, and -0.4 MPa, respectively. After, 5 ml of the solution of respective treatments was applied to each replication of the particular genotype every day. Seedlings were allowed to grow up to 10 days after the placement for seed germination. The solutions regarding the different concentrations of PEG 6000 were calculated as described by Michel and Kaufmann [20], as follows-
Where C = PEG concentration, T = Temperature (centigrade).
Data Collection
Data were recorded daily for the prediction of germination-related traits such as germination (GN), speed of germination (SG), coefficient of germination (CEG), and mean germination time (MGT). After the end of the 10th day, seedling traits such as the shoot length (SL), root length (RL), shoot fresh weight (SFW), shoot dry weight (SDW), root fresh weight (RFW), root dry weight (RDW), and vigor index (VI) were estimated. The GN was calculated by using the following formulae [21], and measured according to the International Seed Testing Association (ISTA) [22]. The SG was calculated according to Maguire’s equation [23]. The CEG was calculated as the formulae given by Copeland [24]. The VI was calculated by using the formulae of Baki and Anderson [25]. The MGT was calculated by the following equation proposed by Moradi [26]. The data for the final GN was analyzed after arcsine transformation [27]. The formula for germination indices is given below:
Where n1, n2,…, n10 are the number of emerged seedlings at times d1, d2, …, d10 (in days).
A = Number of seeds germinated
T = Time (days) corresponding to A
n = No. of days to final count
iv.
Where n is the number of seeds, germinated on day D, and D is the number of days counted from the beginning of germination. Cotyledons were not included in fresh and dry weight.
Statistical Analysis
For statistical analysis, the values of GPs were subjected to arcsine transformation, whereas log transformation was employed for the data of the rest of the traits. This was done as some of the observations were recorded for zero values under higher stress levels. Thus, data transformation was used to stabilize the variances. After the transformation, the data was acceptably normal with homogeneous treatment variances [28]. The data were analyzed by partitioning the total variance with the help of a computer using the R software program [29], following the necessary procedure by Gomez and Gomez [30]. The means separations were done by LSD at 0.05 levels of probability to determine the statistical differences between means when the F value was significant. MS Excel software program was used for drawing the diagrams. Multivariate analysis was done for grouping the mung bean genotypes based on stress tolerance. The data were also subjected to analysis, according to Mahalanobis’ D2-statistics, which measures distance using the covariance matrix of the observed data. It handles the interference of correlation between two studied variables. The intra and intercluster distance, cluster mean, and involvement of each character in the divergence were measured as described by Singh and Chaudhary [31].
Results and Discussion
Variability Estimates of Different Germination and Seedling-Related Traits
Variability in the respective genotypes is the prerequisite for undertaking a varietal development program [32]. Therefore, analyzing the characteristics and extent of the heritable genetic variation existent in the genotypes is essential. The genotypic and phenotypic coefficient of variation, heritability (h2b), genetic advance, and genetic gain for germination and seedling characteristics of 33 mung bean genotypes undertaken in this study were presented in Table 3.
Genotypic and Phenotypic Coefficient of Variation
The genotypic coefficient of variation (GCV) is a measure of the amount of variation within a population for a particular trait, while the phenotypic coefficient of variation (PCV) shows the differences among a population in the observable traits. GCV and PCV showed a wide variation for most of the characteristics in this study. The difference between PCV and GCV values reflects the influence of environmental effects on the traits. It should be considered during the selection process in crop improvement programs [33]. Regarding the results, the GCV ranged from 0.40 to 27.69, while the PCV ranged from 0.52 to 34.78 for different traits. However, the GCV was the highest for RDW (27.69), followed by SDW (21.78), while traits like GN (8.47) gave the lowest in the case of genotypes. In stress level, SL gave the maximum GCV (16.80), followed by SG (15.56), whereas the minimum was in MGT (1.41). In genotypes and stress level interaction, the MGT exhibited the highest GCV value (11.49), and the lowest was in GN (0.40).
Considering the genotypes, the highest PCV (34.78) was for SL, followed by RDW (34.62) and SDW (31.64), while the lowest value was in CEG (13.11). Traits like SL exhibited the highest PCV (16.78) followed by SG (15.94) for stress level, and the minimum was in MGT (1.87). For the given genotypes and stress level interaction, SG exhibited the highest PCV value (12.69), followed by MGT (12.43) and SL (11.15), whereas the lowest values of PCV were obtained for traits like GN (0.52). The estimated data revealed that the PCV was higher than the GCV for all the studied traits, indicating some environmental influence on these traits. These results were also in line with the findings of the previous investigations [34-39]. The traits that showed the lowest PCV and GCV values had the least variability [40].
Heritability
Heritability refers to the ratio of phenotypic variance and genotype variance [33]. The results of heritability (broad sense) estimates are presented in Table 3. The heritability varied from 24.26%, the lowest for the GN to 63.94%, the highest for the RDW (63.94%), regarding the genotypes. While considering the stress levels, it was the lowest for the MGT (57.29%) to the highest for the SL (99.19%), which was closely followed by the rest of the traits. In respect of genotypes and stress levels interaction, the highest value was observed in the SFW (92.69%) followed by the CEG (91.18%), while the lowest was recorded in the RL (24.35%) subsequently the RDW (26.80%). The results exhibited moderate to high heritability (24.26-99.19%) for the majority of the characteristics that offer expected responses for selection.
The characteristics that exhibit high heritability indicate that the selection is more effective. In contrast, the traits showing low heritability suggest that the selection is affected by environmental factors [39]. The high heritability of a trait also indicated that the additive genetic effects are controlling this trait. This result was in line with an earlier study that noticed that relatively high heritability in a particular trait indicates additive gene effects in favor of probable improvement [41]. This study revealed that the variability amongst the majority of traits was primarily due to genotypic variance. However, there was little contribution from the environment to the individual traits. In 37 vegetable cowpea genotypes that were studied earlier to observe the genetic variability and divergence [42], significant differences were observed among the genotypes for all the recorded characteristics [42]. Likewise, high heritability coupled with high genetic advance was reported for seedling dry weight and seedling vigor index of mung bean [35]. Heritability and genetic advances would be more dependable and necessary in formulating the selection methods [43]. An estimate of heritability is essential for applying the optimum breeding strategy [39]. Thus, heritability regulates the skill of selection. However, the usefulness of selection for a particular trait depends on the relative extent of genetic and environmental factors, which reflect the phenotypic differences among genotypes in a population [39].
Genetic Advance and Genetic Gain
Among genotypes, the genetic advance (GA) varied from the lowest for the MGT (0.09) to the highest for the RDW (0.41) followed by the GN (0.40). Under stress, the highest GA was recorded in the GN (0.78) followed by the VI (0.42), and the lowest was observed in the MGT (0.02). Regarding genotypes and stress levels interaction, the maximum GA (0.42) was recorded in the GN and VI, while the minimum GA (0.1) was found in the RDW.
Similarly, the genetic gain (GG) varied from the lowest for the GN (8.59) to the highest for the RDW (45.61) among the genotypes. Under stress, the highest GG was observed in the SL (34.46) followed by the SG (32.50), and the lowest GG was found in the MGT (2.20). In respect of genotypes and stress levels interaction, the GG ranged from 0.34 to 22.05 whereas, the maximum (22.05) was recorded in the MGT followed by the CEG (17.72), and the lowest (0.340) was in the RDW. The minimum value of GA was derived from a low score of phenotypic variances or observed as a result of non-additive gene action, which has epistatic and dominance effects [39]. An increase in the magnitude of GA across the water deficit stress gradient indicated an increase in inherent variation under the response of genotypes to drought and the possibility of selecting suitable genotypes at higher water deficit stress. Similar observations were also reported in an earlier study by [44].
Genetic Diversity Analysis of 33 Mung Bean Genotypes
The Clustering Pattern and Distribution
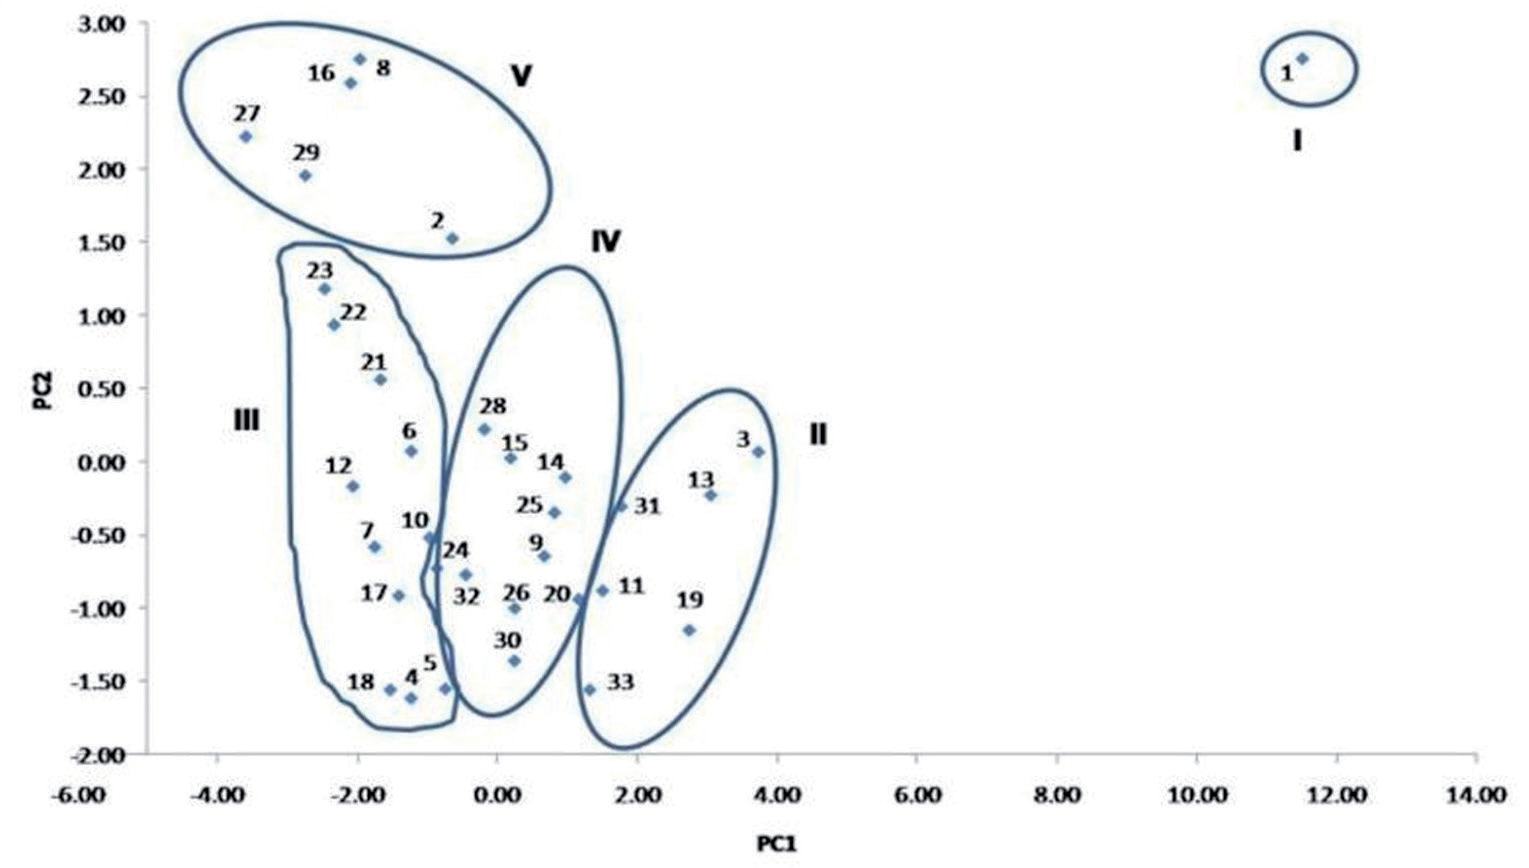
The analysis of variance for individual traits was found significant, suggesting the need for estimating D2 for further study. In this study, 33 mung bean genotypes were grouped into five different clusters using Mahalanobis’s [45] D2 statistic based on the genetic variability present in the respective genotypes (Table 4). Cluster pattern revealed that cluster III was the largest group with the highest number of genotypes (11), closely followed by cluster IV with ten genotypes. The clusters II and V had six and five genotypes, respectively, whereas cluster I contained only one genotype. The genotypes accumulated in the same cluster shared identical adaptation patterns to stress and were not so diversified.
Table 3.
Variability estimates of different germination and seedling-related traits of mung bean genotypes.
Table 4.
Distribution of 33 genotypes of mung bean in five clusters.
Table 5.
Eigenvalues and percentage variations contributed by 11 different component traits in 33 mung bean genotypes.
Contribution of Different Traits Toward the Divergence of Genotypes (Principal Component Analysis)
Eigenvalues represent the performance of different traits to total divergence. Eigenvalues assist in assessing diversity in multivariate scales, and hence are used in the exposure of relationships more clearly. The contributions of 11 quantitative traits to genetic divergence among 33 mung bean genotypes were assessed by a rank average of the individual trait. The trait contributing to maximum divergence needs greater emphasis on deciding the cluster for selecting the hybridization program [33]. The five traits viz., GN, CEG, MGT, SG, and VI were found to contribute to 98.19% of the total variation, of which the first two contributed the major share (82.12%) (Table 5). The scores of PC1 of the genotypes were plotted against PC2, and the scattered diagram depicted the clustering pattern (Fig. 1). This clustering pattern confirmed the results obtained with D2-analysis.
Intra- and Inter-Cluster Distances (Canonical Variate Analysis)
The intra- and inter-cluster distances were estimated to discriminate clusters containing different genotypes. The average intra- and inter-cluster distance values among the five clusters are presented in Table 6. The magnitude of intra-cluster distances indicated the extent of genetic diversity among the genotypes within the same cluster [46]. The inter-cluster distance was greater than the intra-cluster distances, suggesting that the diversity between clusters was greater than the other clusters. It was revealed that the most divergent cluster was Cluster I as it had the highest inter-cluster distance compared with other clusters, which ranged from 16.23 to 16.5, indicating that the genotype in Cluster I was distinctly different from others. However, the highest distance was obtained between Clusters I and III (16.50), signifying the extensive genetic divergence between these two clusters, which was followed by Clusters I and II (16.35), as well as Clusters I & IV (16.33). The minimum distance was observed between Clusters II and IV (2.50), followed by Clusters III and IV (2.81). This result indicates a close relationship among the genotypes included in these clusters [35]. Thus crossing genotypes from these two clusters may not produce a high level of heterotic expression in the F1, and broad-spectrum of variability in segregating (F2) populations [46]. Hence, the parents for hybridization could be selected based on the large inter-cluster distance for isolating useful recombinants in segregating generations [46]. The maximum intra-cluster distance (D = 0.12) was recorded in Cluster II which was closely followed by Cluster V (0.11) and Cluster IV (0.10), and the findings indicate the existence of maximum differences among the genotypes that fall in these clusters. A similar conclusion was recommended from a recent study [35].
Cluster Means
Genetic diversity studies of a cluster mean were measured for 11 characteristics, and presented in Table 7. Means of different clusters showed that different traits had high values in different clusters. It was observed that cluster I gave the lowest mean values for all traits except MGT. Cluster III had the maximum mean values for the SFW, SDW, RFW, and RDW. However, the genotypes in cluster V yielded a greater performance by giving the highest mean value for the GN, CEG, SG, VI, SL, and R.L. This comparison indicates that cluster III and cluster V had better cluster means for most of the characteristics. Hence, cluster III and cluster V might be better for choosing the genotypes as parents used to cross with the genotypes of cluster I, which may generate new recombinants with the desired characteristic(s). It was observed that no cluster had all perfect traits, and the previous studies [35, 47] are also in accordance with our current findings. The divergence in studied genotypes was also reflected in various characteristics measured in different clusters. Several investigations on mung bean diversity agreed with considerable variation for several traits based on the cluster mean values [48-50].
In brief, drought stress impedes crop growth and development, resulting in significant yield reduction [51-53]. Seedling establishment under drought stress conditions is a critical factor for a better yield [6]. The consequences of different drought conditions on seedling growth and development are dissimilar [54]. In this study, the germination and seedling growth of mung beans significantly decreased under high drought stress. Osmotic potential significantly modulates the process of seed germination by reducing the enzymatic activity, especially amylase, and increasing osmotic stress decreases the germination percentage in comparison to the control [55]. Thus, the genotypes that produce higher germination and healthy seedlings (relative biomass) under higher osmotic potentials are treated as drought stress tolerant genotype(s), which may thrive in the field in a drought-prone area. Hence, these parameters could be used as biomarkers. Under water-deficit conditions, several indicators are involved in plant tolerance to water-deficit stress. Observation of germination and seedling traits based on their variability and diversity could be a valuable tool for identifying tolerance genotypes. In our study, drought stress treatments influenced variability and diversity analysis of 33 mung bean genotypes subjected to PEG 6000 induced drought stress. Variability explains the genotypic and phenotypic coefficient of variations, as well as heritability, genetic advance, and genetic gain.
Table 7.
Clusters mean different characteristics in mung bean genotypes.
Regarding the results, the PCV was significantly higher than the GCV for all the studied traits, suggesting an influence of environmental factors on the traits. Heritability estimates are classified as low (5-10%), medium (11-30%), high (31-70%), and the highest for a value greater than this [56]. Heritability in our study ranged from 24.26 to 99.19%, i.e., the mung bean plants exhibited moderate to high heritability. The traits with high heritability indicated that this was controlled by the additive genetic effects, which are more helpful in selecting traits or genotypes under any environmental condition [39]. In this study, diversity analysis explained clustering patterns and distribution, the contribution of different characteristics towards the divergence of genotypes, intra- and inter-cluster distances, and cluster means. Thirty-three mung bean genotypes were grouped into five clusters. The clustering pattern revealed that cluster III contained a maximum of eleven genotypes, followed by cluster IV with 10 genotypes. Cluster I, Cluster II, and Cluster V consist of one, six, and five genotypes, respectively. In the contribution of different traits, the first five components were found to contribute 98.19% of the total variation, among which the first two components contributed 82.12% of the variation. The highest inter-cluster distance was recorded between Clusters I and Cluster III with the rest of the clusters. The lowest inter-cluster distance was obtained between Cluster II and Cluster IV. On the contrary, the maximum intra-cluster distance was observed in Cluster II (0.12), followed by Cluster V (0.11). The genotypes in Cluster V yielded good performance by giving the highest mean value for almost all the studied traits. This means that the genotypes under Cluster V may have a gene or mechanism responsible for plant tolerance against a high level of drought stress. Parental material selection from these clusters may provide higher heterosis if hybridized.
Conclusions
The present study was intended to study the response of the genotypes to the water deficit stress induced by PEG at early growth stages from germination to initial seedling development. This study indicated the variable performance for different traits by the studied genotypes under osmotic stress conditions. Germination and seedling growth traits like GN, MGT, SL, RDW, SDW, etc. exhibited more variation (and also higher heritability along with high genetic gain) under stress. Our research shows that more attention should be given to those traits for improved drought tolerance of mung beans. Those traits can potentially be used as quick selection criteria to screen out many genotypes for the identification of drought tolerance at the early growth stage of mung bean. Also, we observed that grouping helped in sorting genotypes based on their performance under stress situations, and this led to the identification of Cluster III and Cluster V as better-performing clusters under drought. The genotypes BMX-08010-2, BMX- 08009-7, BMX-01015, and BARI Mung-8 exhibited a higher percentage of germination and seedling growth traits, indicating a higher degree of drought tolerance in these genotypes. These genotypes could be used for future drought tolerance studies. In conclusion, the germination and seedling growth traits are potential selection criteria for mung bean improvement programs capable of improving the breeding of other pulse crops.

