

Introduction
Desertification is a phenomenon of land degradation caused by human and natural factors, occurring mainly in arid and semi-arid areas [1]. Since the United Nations Conference on Desertification in 1977, desertification has been recognized as a global ecological and environmental problem [2]. Currently, 1/4 of the global land surface area, 2/3 of the countries, and nearly 1 billion people are affected by desertification [3-5]. Desertification can cause a decrease in available land area, a decrease in land fertility, soil wind erosion, pasture degradation, and other ecological problems directly resulting in serious yield reduction in agriculture and livestock, as well as destruction of amenities and construction works, famine, and social unrest, which can lead to the destabilization of ecosystems, global climate anomalies, and a reduction in biodiversity [6]. And China is one of the countries in the world with a large and widely distributed desertification area [7]. Land desertification has a particularly serious impact on ecological, environmental, and economic problems in the arid and semi-arid regions of northern China [8, 9], causing serious harm to the ecology, hydrology, and agriculture of the region and thus seriously affecting the normal socioeconomic development of the region [10]. Therefore, land desertification has always been an issue of widespread concern to all walks of life, and it is one of the hot issues for research in related disciplines.
Researchers and scholars at home and abroad have done a lot of in-depth research on the establishment of desertification land classification and desertification grade evaluation systems. Initially, the field survey method was mainly used for comprehensive indicator evaluation, but due to the limitations of the research scope of the field survey method, it is difficult to use it for global large-scale desertification land monitoring. With the rise of 3S technology, high spatial resolution and high temporal phase satellites have made large scale desertification monitoring possible. Scholars have started to use visual interpretation methods mostly for classifying and evaluating desertified land and monitoring land desertification dynamics [11, 12]. The method can achieve desertification land classification, but it is time-consuming and laborious, and the classification criteria overly rely on subjective consciousness evaluation, which leads to the low accuracy of the method and makes it difficult to be widely used. With the development of remote sensing technology, researchers began to apply vegetation indices to land classification [13], which can be used for desertification land classification, but lacks knowledge of remote sensing mechanisms to support it. The vegetation cover index, which is derived on the basis of a single vegetation index, has good potential in desertification monitoring studies [14]. It is based on the NDVI (Normalized Difference Vegetation Index) and introduces soil image elements and full vegetation cover image elements, fully considering the actual situation of the study area, and has strong mechanistic knowledge support. Liu Xiaoqian et al. [15] used seven periods of remote sensing images to monitor and analyze the dynamic changes of land sanding in the desert-oasis transition zone at the southeastern edge of the Tengger Desert since 1986 and found that the degree of land sanding in the study area was gradually reduced from west to east during 35 years. La Ba et al. [16] used vegetation cover to construct a desertification monitoring model to analyze the spatial and temporal variation characteristics of desertification in Tibet from 2000-2017 and found that desertification across the region showed a weak improvement trend.
As an important agricultural and pastoral interlacing area in China, Horqin Left Wing Rear Banner has become a major socio-economic and ecological environment problem in the region as land desertification is becoming more and more serious with the continuous development of industry, animal husbandry, and other human activities. At the same time, as one of the main sources of sand and dust storms in China, the state has implemented a series of measures for the area, such as returning farmland to forest and grass, banning grazing and resting livestock, etc., to control the sources of sand and dust and restore the ecological environment, and now the development momentum of desertification has been curbed to a certain extent and the regional ecological environment has improved. However, due to the fragile ecological environment, unstable changes in climatic elements, unreasonable land use and over-cultivation, grazing, and other factors overlapping, the ecological environment of the region is still facing major problems. Ecological civilization construction and sustainable socio-economic development are difficult. Therefore, this paper uses Landsat TM/OLI remote sensing images of 8 periods in 1986, 1991, 1996, 2001, 2006, 2011, 2016, and 2021 as data sources, and adopts Fractional Vegetation Cover (FVC) as an indicator of desertification degree through ArcGIS 10.8, ENVI 5.3, and the human-machine hybrid interpretation method to explore the dynamic evolution characteristics of desertification. Analyzing the response of desertification to natural and anthropogenic factors, and conducting research on the relationship between desertification change processes and natural as well as anthropogenic factors using principal component analysis to reveal the spatial and temporal evolution process and driving mechanism of desertification in Horqin Left Wing Rear Banner over the past 35 years, and to provide reference for desertification prevention and control and the work of relevant departments.
Materials and Methods
Study Area Overview
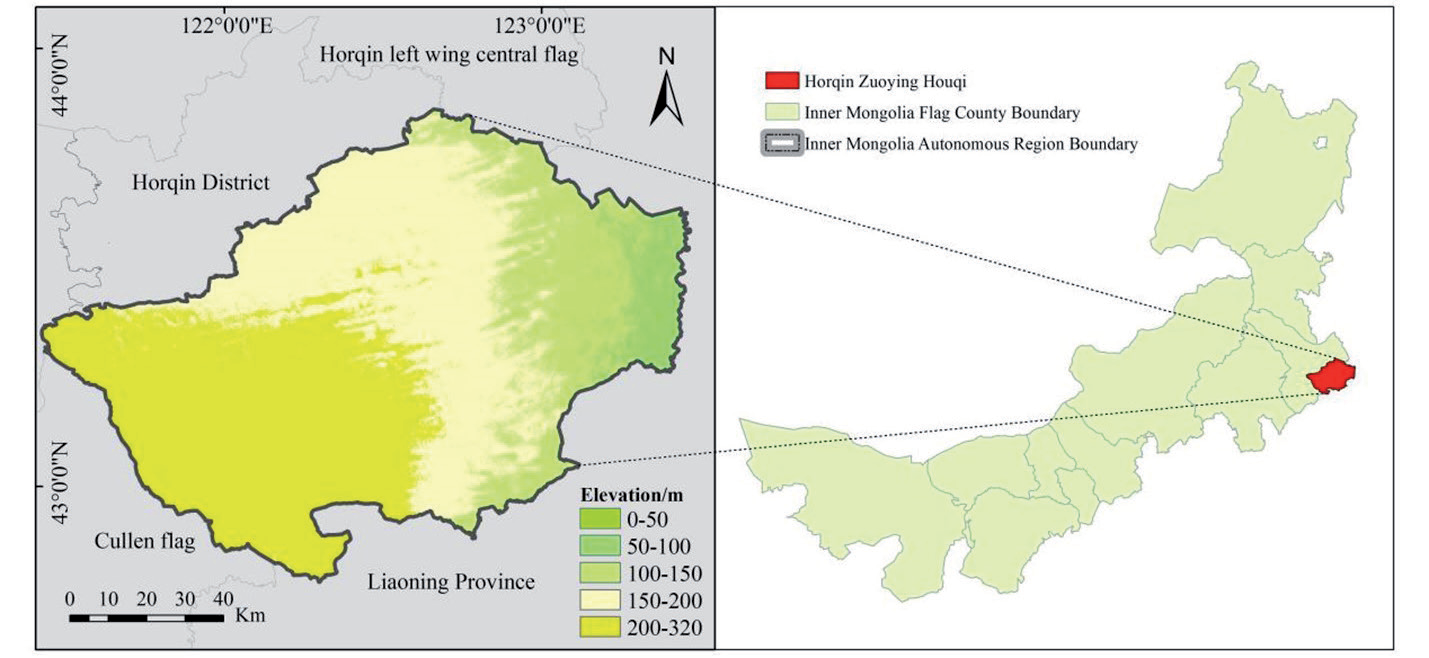
Horqin Left Wing Rear Banner is located at the intersection of Horqin Sand and Songliao Plain (121°30′~123°42′E, 42°40′~43°42′N) (Fig. 1), with an average altitude of 250 m, a total area of about 11500 km2, a jurisdiction of 19 Sumu town fields, and 262 administrative villages. The climate type belongs to the typical semi-arid continental monsoon climate, the average annual temperature is 3~14ºC, the temperature difference between day and night, and the average annual precipitation is 350~400 mm, mainly concentrated in May to September, accounting for about 85% of the total annual precipitation. The average annual wind speed is 3~4.4 m/s, and the number of days with gale force 8 or higher is 20 to 30 days throughout the year.
Data Sources
Remote sensing image data for desertification monitoring was obtained from Landsat5/Landsat8 satellites and downloaded from the United States Geological Survey (https://glovis.usgs.gov/). Landsat5 TM data (multispectral band resolution of 30m) for 1986, 1991, 1996, 2001, 2006, 2011, and Landsat8 OLI data (multispectral band resolution of 30 m) for 2016 and 2021 were selected, respectively. Fractional Vegetation Cover (FVC) is the most important indicator for determining desertification in remote sensing images, so remote sensing images were mainly selected for the vegetation growing season (August-September) with less than 10% cloud cover. Two scenes of images were needed to cover the whole study area, and finally, 16 scenes of Landsat TM/OLI data were acquired for 8 periods from 1986 to 2021. Data were preprocessed using ArcGIS 10.8 and ENVI 5.3 software for geometric correction, radiometric calibration, atmospheric correction, projection transformation, and mosaicing, and cropped by study area vector boundaries.
In this paper, with reference to previous studies [17], eight drivers related to desertification evolution were selected to explain the causes of desertification changes in the study area. These factors have been selected as drivers of desertification evolution in previous studies over the last 50 years. The meteorological data were obtained from the Meteorological Information Center of the Inner Mongolia Autonomous Region, including four meteorological indicators, including annual average temperature, average annual precipitation, annual maximum wind speed, and annual average wind speed of meteorological stations from 1986 to 2021. The social data were obtained from the Statistical Yearbook of Inner Mongolia Autonomous Region and China Statistical Information Network, including the year-end population, livestock volume, arable land area, and GDP of Horqin Left Wing Rear Banner.
Human-Computer Hybrid Interpretation Method
The remote sensing image classification technique is an efficient method to extract desertification information, which is divided into a visual interpretation method and an automatic classification method [18, 19]. The automatic classification methods are supervised and unsupervised classification, desertification index, and spectral mixture analysis, among which supervised classification is widely used by scholars [20-22]. Supervised classification is performed by using the difference between features with distinct spectral characteristics in the image and the rest of the features. On this basis, the auxiliary data are used to visualize and correct the supervised classification results using elevation information and texture information to achieve mixed human-machine interpretation and improve the classification accuracy in order to eliminate non-vegetated areas.
Like Elementary Dichotomous Model
The Image Element Dichotomous Model (IEDM) is a remotely sensed vegetation cover estimation method based on the evolution of NDVI, which is more accurate and applicable, so it is mainly used in the research fields of vegetation change, ecological environment, and soil and water conservation [23-25]. In general, the vegetation cover is relatively low in areas with a high degree of land desertification. Therefore, the correspondence between vegetation cover and the degree of land desertification can be established by using the image dichotomous model to achieve land desertification monitoring. The image dichotomous model is as follows (Equation 1).
In Equation (1), FVC is the fractional vegetation cover, NDVImin is the minimum value of NDVI for the bare soil image, and NDVImax is the maximum value of NDVI for the vegetation image. Due to the influence of surface conditions, vegetation type, and other related factors, the maximum and minimum values of NDVI vary with time and space, and the cumulative frequency of 5% NDVI is the minimum value and 95% NDVI is the maximum value in this study
Desertification Land Classification System
The degree of desertification can be judged by desertification monitoring and evaluation indicators. Based on the results of the field study and the grading criteria of Diao Haiting et al. [26], the degree of desertification in Horqin Left Wing Rear Banner was divided into four grades, of which vegetation cover is the most obvious feature. The four grades include non-desertification (dense vegetation), mild desertification (relatively dense vegetation), moderate desertification (relatively sparse vegetation), and severe desertification (basically no vegetation or bare rock). The classification criteria are shown in Table 1.
Annual Rate of Change
Desertification development can be reflected by the annual rate of change, and the study analyzes desertification at various stages.
In Equation (2), R is the annual rate of change; n is the interval of years; D is the desertified land area in the year of termination; and A is the desertified land area in the year of commencement.
Analysis of the Drivers of Desertification
Desertification is influenced by both natural and man-made factors and is a process of multiple factors combined. Natural factors selected meteorological stations 1986-2021. The meteorological indicators, such as average annual precipitation, annual average temperature, annual average wind speed, and annual maximum wind speed, were selected for the years 1986- 2021. The human factors were selected from the data on arable land area, livestock carrying capacity, population size, and gross domestic product for 1986- 2021. The article uses principal component analysis for the analysis of desertification driving mechanisms in the study area. This method not only simplifies multiple variables, but also quantifies the contribution of multiple factors to the drivers of desertification and reveals the main drivers of the desertification process [27]. The main natural and human influences selected in the article were average annual precipitation (X1), maximum annual wind speed (X2), average annual wind speed (X3), average annual temperature (X4), year-end total population (X5), livestock volume (X6), GDP (X7), and cultivated area (X8).
Results and Analysis
Spatial and Temporal Changes in Land Desertification
Time Change
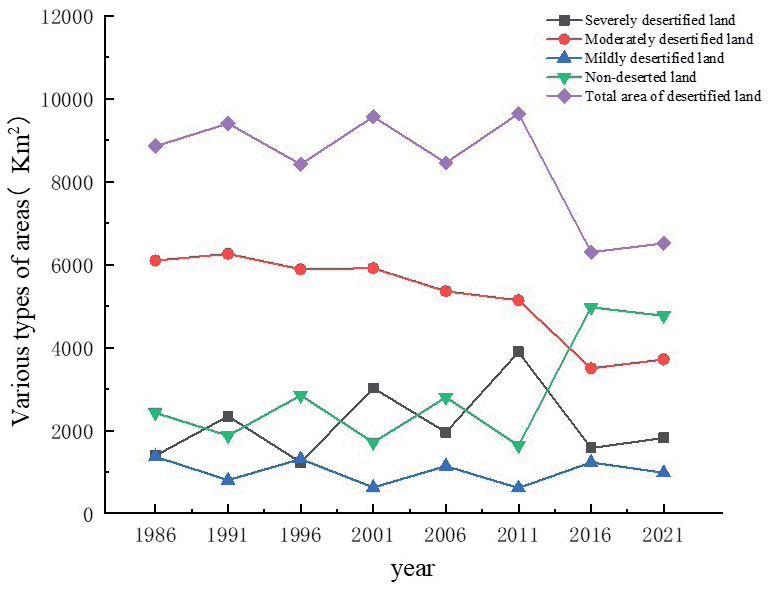
As shown in Table 2 and Fig. 2, the total area of desertified land in the study area decreased by 2,343.82 km2 from 1986 to 2021. Different desertification land types had different trends during the study period, among which were, smaller areas of heavily desertified land, but the fluctuation of change was obvious, and the area of heavily desertified land increased by 2,501.94 km2 during the period of 1986-2011 and proportion of the land increased from 12.33% to 34.51%. The area of land with severe desertification from 2011 to 2021 is significantly reduced, with a decrease of 2,072.8 km2 in only 10 years, from 34.51% to 16.13% of the total area. In conclusion, the area of severely desertified land at the end of the study period increased compared with the beginning of the study period; the most obvious change in the area of land with moderate desertification, a total decrease of 2,383.83 km2 during the study period, accounting for 54.08% to 32.95%; the area of land with mild desertification is not obvious, a decrease of 389.13 km2 during the study period, accounting for 12.12% to 8.67%; during the study period, the area of non-desertified land increased greatly, totaling 2,343.83 km2, and the proportion of non-desertified land area increased from 21.47% to 42.25%. The area of non-desertified land did not change significantly from 1986 to 2011, but increased rapidly after 2011, with an increase of 3,131.56 km2 in 10 years.
Table 2.
Area and proportion of various types of desertified land in Horqin Left Wing Rear Banner for 8 periods.
Spatial Changes
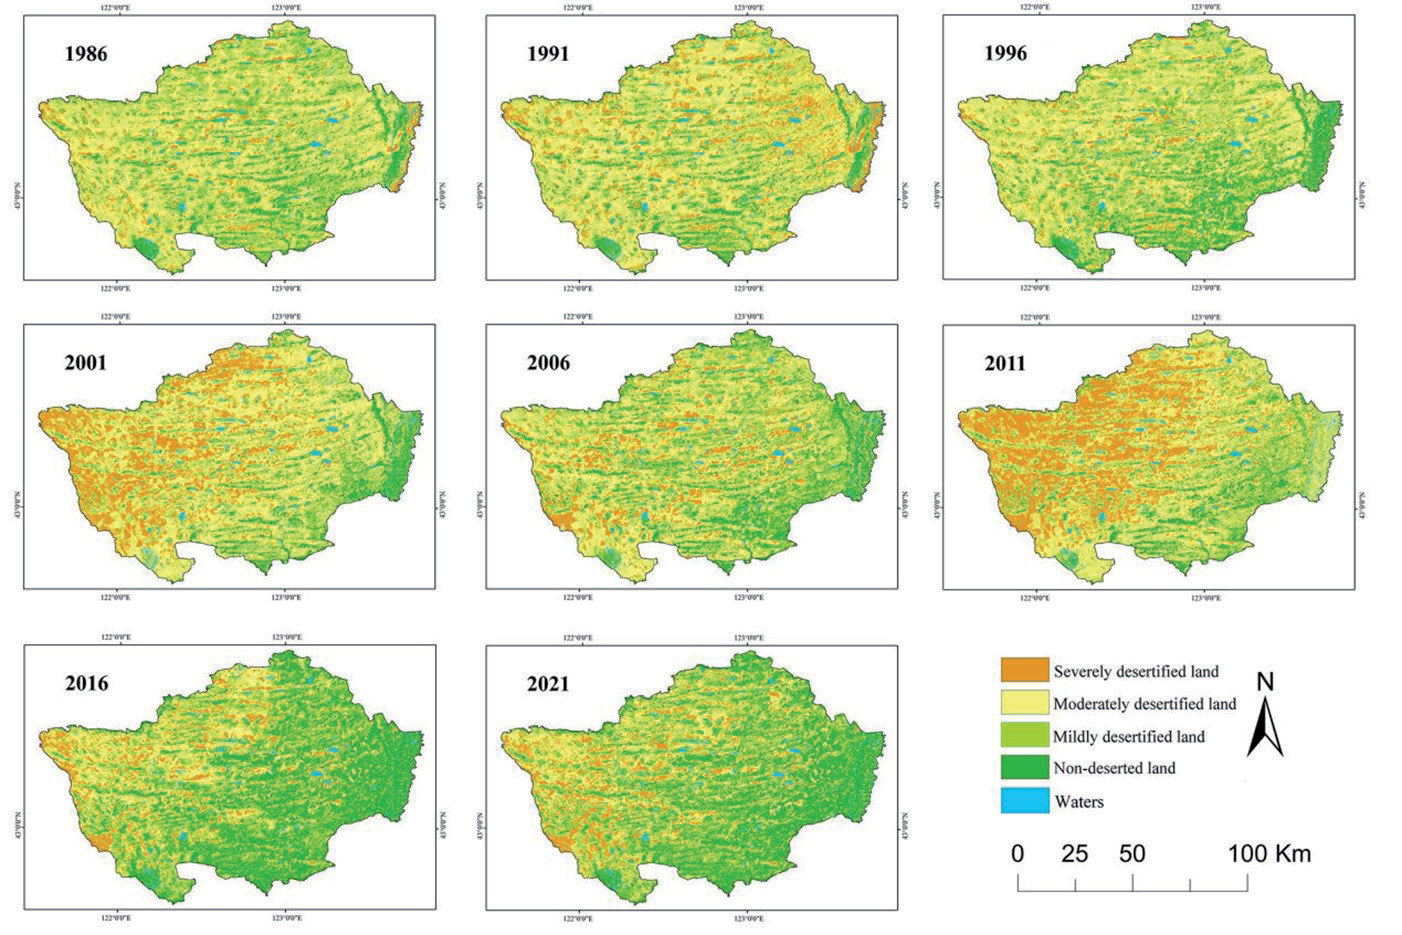
The distribution of desertified land is shown in Fig. 3, with insignificant changes in desertified land from 1986 to 1996, which is mainly evenly distributed in a multi-point shape; from 1996 to 2001, there were significant changes in the distribution of desertified land, with desertification gradually worsening in the western parts of the study area, such as Bayan Maodu Sumu, Chaolu Tuo Township, Nugustai Township, and Bahutala Sumu, and the area of desertified land in the study area gradually decreasing from the northwest to the southeast, showing a pattern of “heavy in the northwest and light in the southeast”; desertification in northwestern areas such as Bayan Maodu Sumu and Nugustai Sumu showed a trend of gradual reversal from 2001 to 2006; desertification activities were strongest from 2006 to 2011; desertified land was rapidly reversed after 2011, but the basic pattern of extension from northwestern to southeastern areas remained unchanged.
Annual Rate of Change
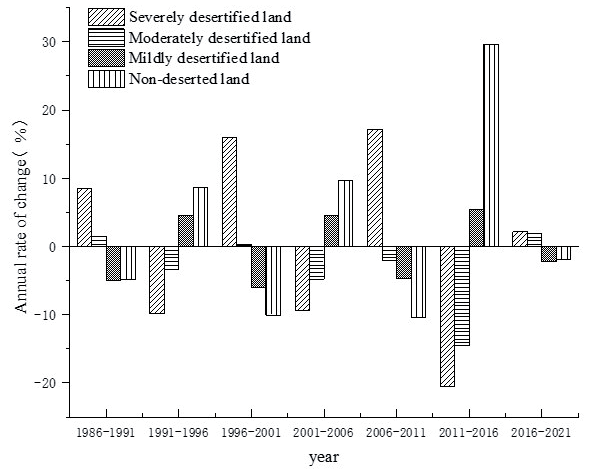
Fig. 4 gives the annual rate of change of various types of desertified land in different periods, which can be basically categorized into two groups, with different degrees of desertification aggravation trends during 1986-1991, 1996-2001, 2006-2011, and 2016- 2021, while 1991-1996, 2001-2006, and 2011-2016 show a reversal trend of desertification. During the study period, the area of heavily desertified land fluctuated greatly, showing a tendency to increase and decrease, and the total area increased at the end of the study period compared with the beginning of the study period; the area of moderately desertified land, except for the positive rate of change in the years 1986-1991 and 2016-2021, was negative in the rest of the period; and the land of lightly desertified land accounted for a relatively small area and fluctuated less, with the annual rate of change being mostly negative; the area of non-desertified land fluctuates more, and the overall proportion increases significantly. Indicates that the area of desertified land in the region has been decreasing in the last 35 years; the desertification activities were the strongest in 1996-2001 and 2006-2011, and the desertified land changed more obviously, the desertification activities were stronger in 1986-1991, and the desertification activities were weaker in the period of 2016-2021, and the rest of the years had different degrees of reversal trend.
Analysis of Desertification Land Transfer Change
According to the desertification land transfer matrix of Horqin Left Wing Rear Banner (Fig. 5), the area of various types of desertification land in Horqin Left Wing Rear Banner converted to each other during 1986-2021. Among them, land areas under severe desertification, although not a significant proportion of it, it is more active, mainly converting the land with moderate desertification. The area of land transformed from moderately desertified land to severely desertified land during the study period was 1,121.22 km2, and the area of land reversed from land with severe desertification to land with moderate desertification, light desertification, and non-desertified land was 530.21 km2, respectively and 105.87 km2 and 303.55 km2, respectively; the area of moderate desertification land is larger, but there is an obvious The area of moderately desertified land is larger, but there is a clear trend of reversal, and the areas of land converted to light desertification and non-desertification are 519.76 km2 and 2,173.98 km2; the area of light desertification land is less, showing a trend of reversal, with 655.72 km2 reversing to non-desertification land, while the area of non-desertification land has increased significantly; the main source is moderate desertification land, reversing 2,173.98 km2.
Analysis of Driving Factors
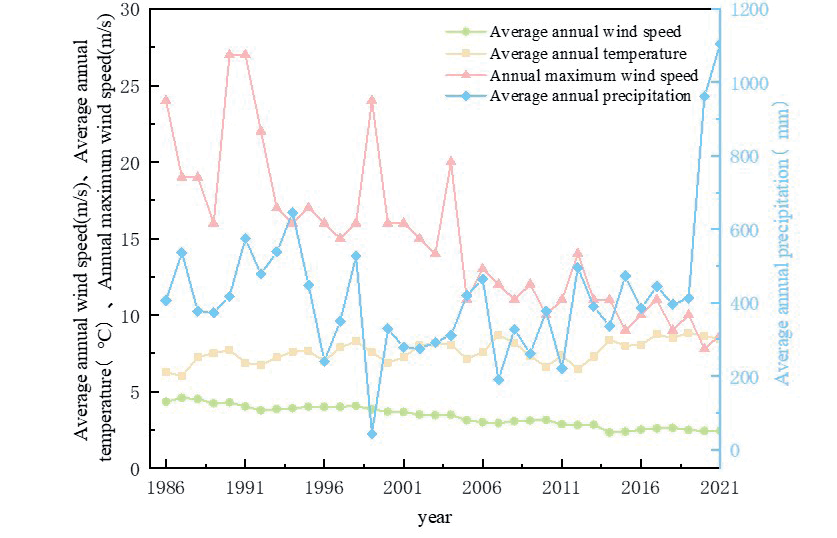
Among the natural factors affecting desertification, the relationship between climate factors such as temperature, precipitation, wind speed, and desertification is closer [28]. In the past 35 years, the annual average temperature, annual average wind speed, and annual maximum wind speed of Horqin Left Wing Rear Banner have fluctuated greatly, among which the annual average temperature is 7.61ºC, which has increased since 1987, and the annual average wind speed is 3.38 m/s and the annual maximum wind speed is 14.93 m/s, which both show a continuous decreasing trend. The average annual precipitation in the region is 419.46 mm, which is basically in a stable state (Fig. 6).
Among the anthropogenic factors affecting desertification, indicators such as year-end total population, cultivated area, livestock volume, and GDP were mainly selected as the main elements of desertification occurrence and development. In the past 35 years, the cultivated area in the study area has shown a slow growth trend. The change in livestock volume fluctuates greatly, showing an overall increase followed by a decrease and a gradual stabilization. This change corresponds to the national responsibility system of the rural land contract implemented in 1980 and the policies of returning farmland to forest and grass and enclosing grazing land in 1999. The population of the study area shows a slow and steady growth trend, and the GDP changes more obviously, with a significant growth trend starting in 2000.
The influence of climatic factors on desertification is a long process, so the correlation analysis between natural factors such as average annual temperature, average annual precipitation, average annual wind speed, maximum annual wind speed, and FVC were selected, and finally, the correlation between average annual temperature, average annual precipitation, and average annual wind speed and the degree of desertification was high.
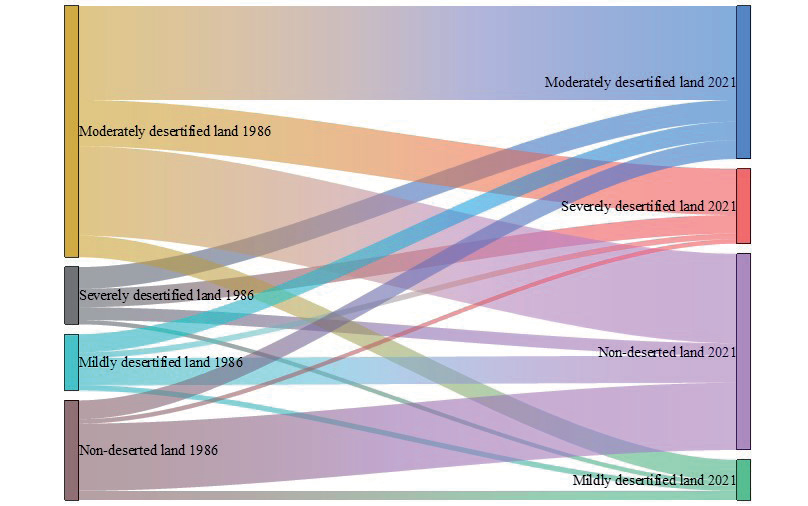
Fig. 6.
Characteristics of temperature, precipitation and wind speed changes in Horqin Left Wing Rear Banner from 1986-2021.
Based on eight driving factors, including average annual precipitation (X1), maximum annual wind speed (X2), average annual wind speed (X3), average annual temperature (X4), year-end total population (X5), livestock volume (X6), GDP (X7), and cultivated area (X8), principal component analysis was conducted for the factor data of Horqin Left Wing Rear Banner for the last 35 years, and the factors with a characteristic root greater than 1 and a cumulative contribution rate greater than 70.0% were selected for the principal component loading analysis. According to the analysis in Table 3, among the eight influencing factors, the cumulative contribution of the first two principal components reached 73.394%, and the contribution of each principal component was 59.554% and 13.85%, respectively (Table 3). In the first principal component, the contribution of the variables was 59.554%, and the loadings of average annual wind speed (X3), cultivated area (X8), livestock volume (X6), GDP (X7), and maximum annual wind speed (X2) were higher. The first principal component is dominated by human factors and supplemented by natural factors. In the second principal component, two factors, such as year-end total population (X5) and average annual precipitation (X1), contribute more, indicating that the second principal component natural factors and anthropogenic factors work together in the development of desertification. Taken together, the desertification process in Horqin Left Wing Rear Banner was strongly influenced by anthropogenic factors during the period 1986-2021 (the highest contribution of the first principal component), and natural factors play a supporting role.
Discussion
With the continuous development of society and economy, the degree of desertification in Inner Mongolia has become more and more serious, and since the 1950s, the State has issued policy documents on desertification prevention and control in Inner Mongolia, the main contents of which are the protection of forests, the prevention of indiscriminate and pirated logging, and the prohibition of blindly clearing land. As the largest sandland in China, the comprehensive management of the Horqin sandland has been included in the national special project, and the study area of this paper is located in the southeastern part of the Horqin sandland, which is the main carrying out area of the whole project. The article utilizes 8-period remote sensing image data from 1986-2021 in the study area to extract desertified land through professional software such as ENVI 5.3 and ArcGIS 10.8, and The results show that the area of desertified land in Horqin Left Wing Rear Banner has significantly decreased in the last 35 years, and desertification in general has been on a decreasing trend. Wang Shuxiang [29] conducted a study on the desertification dynamics of the Horqin Sandland from 1900 to 2015 through multi-source data and found that the land desertification of the Horqin Sandland showed the development trend of “expansion-rapid reversal-stabilization”. The conclusions of this paper further validate the results, and on this basis, we use principal component analysis to study the influencing factors of desertification changes and clarify the spatial and temporal evolution of desertification and its driving mechanism in Kezuo Houqi in the past 35 years.
Table 3.
Area and proportion of various types of desertified land in Horqin Left Wing Rear Banner for 8 periods.
The evolution of desertified land in the study area is mainly influenced by anthropogenic factors, with natural factors playing a secondary role, which is in line with the findings of previous studies [30, 31] and [32]. Since 1986, agricultural and pastoral activities have become more frequent as the number of people continues to grow. The implementation of the land contract responsibility system in China has led to the phenomenon of large-scale land reclamation and cultivation all over the country, which, on the one hand, has increased the output of agricultural production and gross domestic product (GDP), but, on the other hand, the blind reclamation and irrational land utilization have led to the ecological deterioration of ecologically fragile agro-pastoral intertwined regions [33]. During the period 1996-2001, the population, cultivated area, and GDP of the study area were increasing, while the average annual temperature decreased from 7.65 to 6.87ºC. Among them, a severe drought occurred in the region in 1999, with an average annual precipitation of only 42.6 mm, which led to a sharp increase in desertified land area in the western parts of Chaolutu Town, Bahuta Sumu, and Ganciqa Town, which increased from 8,424.38 km2 to 9,567.26 km2. Starting in 2001, the volume of livestock in Horqin Left Wing Rear Banner increased dramatically, from 634,600 heads in 2001 to 1,268,800 heads in 2008, and during the same period, the area of grain cultivation expanded, and the pastureland was occupied as arable land, so the influence of human factors such as the volume of animal husbandry, GDP, and industrial development made the area of its desertified land increase in a wave-like manner. Until 2010, with the aggravation of desertification, government residents and experts paid more attention to the study and management of desertification in the region, combined with the national ecological environment construction project, and carried out comprehensive desertification prevention and control work in various aspects such as agriculture, forestry, animal husbandry, land resources, etc., set up forbidden protection zones, laid grass squares, and planted windbreaks and sand-fixing vegetation, so that desertification prevention and control work has really entered the stage of comprehensive implementation [34]. The implementation of policies such as enclosing and banning grazing and returning farmland to forests and grasses and the initial results of the ecological project of the “Three North Protective Forests” have dramatically reduced the amount of livestock and cropland in Horqin Left Wing Rear Bannerr, decreased the carrying capacity of the land, and slowed down the desertification of the land. The man-made measures for preventing and treating sand have increased, and the effect has been remarkable. It has effectively promoted the increase in forest and grass cover in the project area year by year. In some areas, greening and sand retreat have been realized. As a result, the degree of desertification in Horqin Left Wing Rear Banner has gradually decreased, and 2010 became a turning point from increasing to decreasing desertified land area in the region [35].
In previous studies, natural factors were also one of the important factors influencing the formation and development of desertification, and the climatic conditions of drought and high winds provided important environmental conditions for the expansion of desertification [36]. The average annual temperature in the study area has not varied much since 1986, ranging from 6.01 to 8.68ºC, with a mean value of 7.61ºC; average annual precipitation fluctuates greatly, ranging from about 42.6 to 1104.50mm, with an average value of about 419.46 mm, showing a fluctuating growth trend after 2000; the average annual wind speed decreases from 4.33 m/s in 1986 to 2.43 m/s in 2021; and the maximum annual wind speed decreases from 24 m/s in 1986 to 8.7 m/s in 2021. Average annual precipitation has a greater impact on land desertification relative to the average annual temperature, so an increase in average annual precipitation and a decrease in wind speed can help the growth of vegetation and the stabilization of land desertification and mitigate land desertification to a certain extent. respectively, which is consistent with the results of the analysis of desertification dynamics in the Hunshandak Sandy Land under climate fluctuations conducted by Li Chunlan et al. [37]. Yuan Zhihui et al. [38] concluded that the interannual variation of NDVI was more closely related to precipitation (R2 reached 0.75) by studying the change of vegetation cover in Hunshandak Sandy Land during the period of 2000-2014, which, on the other hand, illustrated the mitigating effect of precipitation on land desertification.
Among the drivers of desertification in Horqin Left Wing Rear Banner, the total population at the end of the year, gross domestic product, animal husbandry, and cultivated land area are the main influencing factors, while the increase in average annual precipitation and the decrease in the average annual wind speed alleviate the land desertification to a certain extent, and other factors have less influence on the desertified land. Therefore, in the future, in the process of combating desertification in Horqin Left Wing Rear Banner, it is important to control the number of livestock heads, limit the continued growth of arable land area, implement the policies of returning farmland to forests and grassland, and forbidding and resting grazing, as well as to increase the production of agriculture and animal husbandry by means of modernized technology to ensure the growth of the economy, and to rationally carry out the project of sand control and prevention, so as to further improve the degree of desertification in Horqin Left Wing Rear Banner and to enhance the quality of the regional ecological environment. However, in the past
10 years, while combating desertification, various human activities have intensified, which has also increased the difficulty of desertification control work to a certain extent. How to solve this contradiction is an issue that needs attention in the future in desertification management.
Conclusions
By analyzing the situation of land desertification in Kozuo Houqi for the last 35 years and discussing the climate and human factors in the study area, the following conclusions were drawn:
(1) In time, the desertified land in Horqin Left Wing Rear Banner has shown wave-like changes in the past 35 years, with a total decrease of 2,343.83 km2 in total area. Among them, the area of moderately desertified land had more obvious changes and was on the trend of continuous reduction, with a total reduction of 2,383.83 km2.
(2) Spatially, there was no obvious change in the desertified land from 1986 to 1996, and it was mainly evenly distributed in the form of multiple points; from 1996 to 2001, the change was remarkable, and the degree of desertification gradually decreased from northwest to southeast; from 2001 to 2006, the severe desertified areas in the northwest, such as Bayan Maodu Township, Chaolu Tuo Township, and Nugusutai Sumu, showed a reversal of the trend; from 2006 to 2011, the desertification activities were the most severe. From 2006 to 2011, desertification activities were the strongest, with a pattern of “heavy in the northwest and light in the southeast”; after 2011, desertified land was rapidly reversed, but the basic pattern of decreasing desertification from west to east did not change.
(3) The evolution of desertified land in the study area is mainly influenced by anthropogenic factors, with natural factors playing a secondary role. Among the driving factors, the contribution rate of human factors such as livestock volume (X6), GDP (X7), and cultivated area (X8) was higher than 0.8, and the contribution rate of year-end total population (X5) in the second principal component reached 0.746.

